Upgrade to Pro — share decks privately, control downloads, hide ads and more …

SER431 Lecture 15

SER431 Lecture 15

Advanced Graphics
Hermite and Chaikin Curves
(201810)

Javier Gonzalez-Sanchez
PRO

October 11, 2018
Tweet

More Decks by Javier Gonzalez-Sanchez

Other Decks in Programming

Transcript

  1. jgs
    SER 431
    Advanced Graphics
    Lecture 15: Hermite and Chaikin Curves
    Javier Gonzalez-Sanchez
    [email protected]
    PERALTA 230U
    Office Hours: By appointment

    View Slide

  2. jgs
    Hermite Curves

    View Slide

  3. Javier Gonzalez-Sanchez | SER431 | Fall 2018 | 3
    jgs
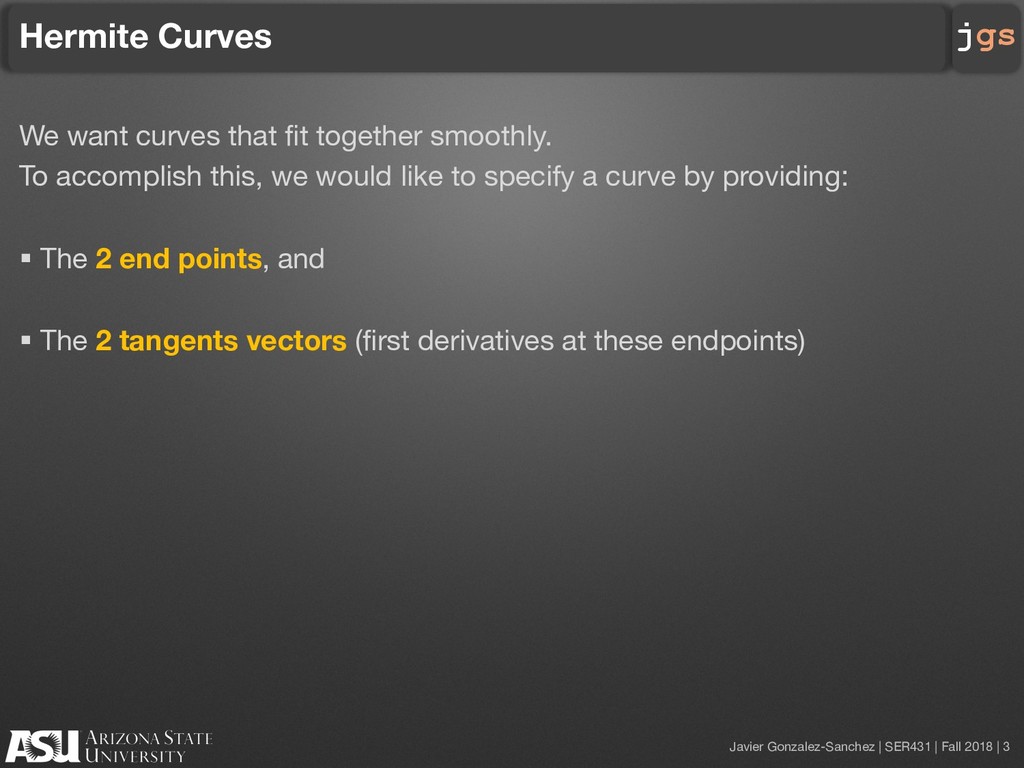
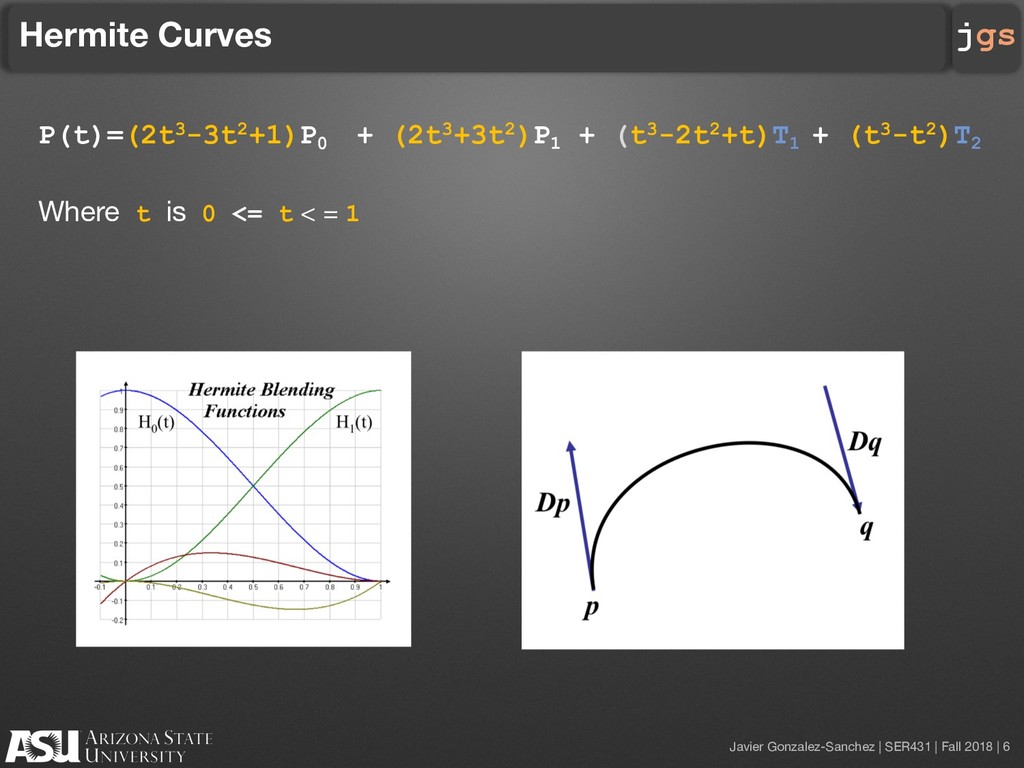
    Hermite Curves
    We want curves that fit together smoothly.
    To accomplish this, we would like to specify a curve by providing:
    § The 2 end points, and
    § The 2 tangents vectors (first derivatives at these endpoints)

    View Slide

  4. Javier Gonzalez-Sanchez | SER431 | Fall 2018 | 4
    jgs
    Hermite Curves Examples
    0 0 0
    10 10 0
    0 100 0
    0 100 0
    0 0 0
    10 10 0
    0 10 0
    10 0 0
    P1=(0, 0, 0)
    P2=(10,10, 0)
    T1=(0,10, 0) T2=(10,0,0)
    P1=(0, 0, 0)
    P2=(10,10, 0)
    T1=(0,100, 0)
    T2=(100,0,0)

    View Slide

  5. Javier Gonzalez-Sanchez | SER431 | Fall 2018 | 5
    jgs
    Hermite blending functions
    § A curve spline is specified as
    P(t) = p0
    *B0
    (t) + p1
    *B1
    (t) + p2
    *B2
    (t) + p3
    *B3
    (t)
    § Hermite Curve
    B0
    (t)= 2*t3 – 3*t2 + 1,
    B1
    (t)= -2*t3 + 3*t2,
    B2
    (t)= t3 - 2*t2 + t,
    B3
    (t)= t3 – t2

    View Slide

  6. Javier Gonzalez-Sanchez | SER431 | Fall 2018 | 6
    jgs
    Hermite Curves
    P(t)=(2t3-3t2+1)P0
    + (2t3+3t2)P1
    + (t3-2t2+t)T1
    + (t3-t2)T2
    Where t is 0 <= t < = 1

    View Slide

  7. Javier Gonzalez-Sanchez | SER431 | Fall 2018 | 7
    jgs
    Hermite Curves Examples
    § All tangent vector magnitudes are equal, but the direction of the left
    tangent vector varies.

    View Slide

  8. Javier Gonzalez-Sanchez | SER431 | Fall 2018 | 8
    jgs
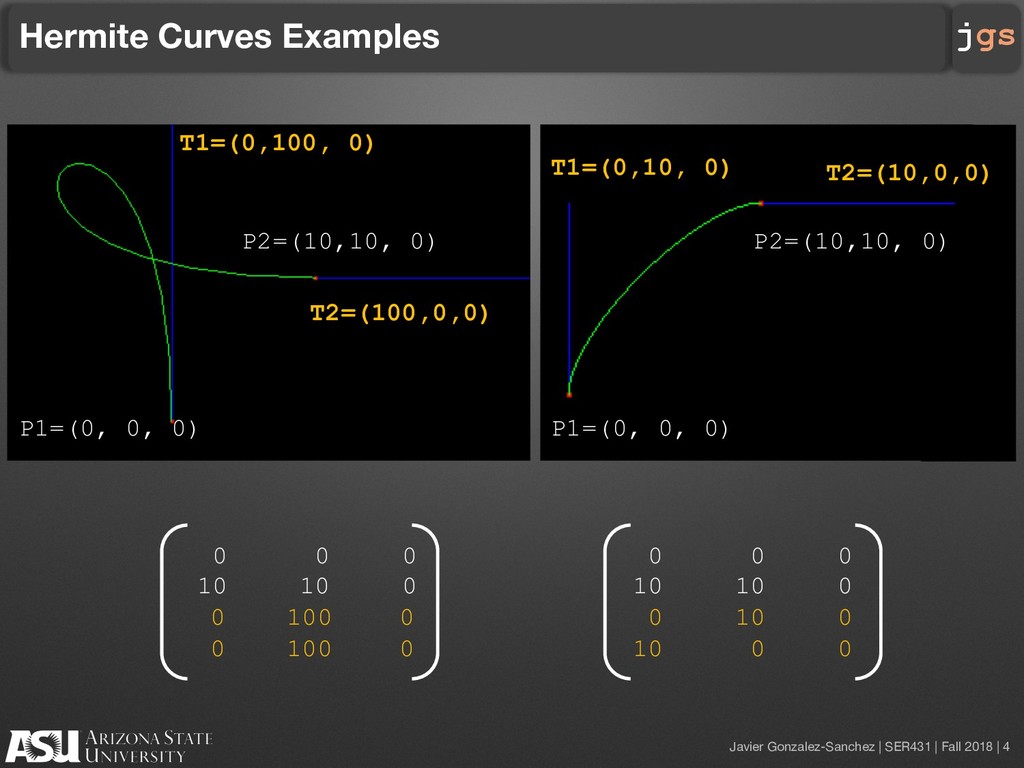
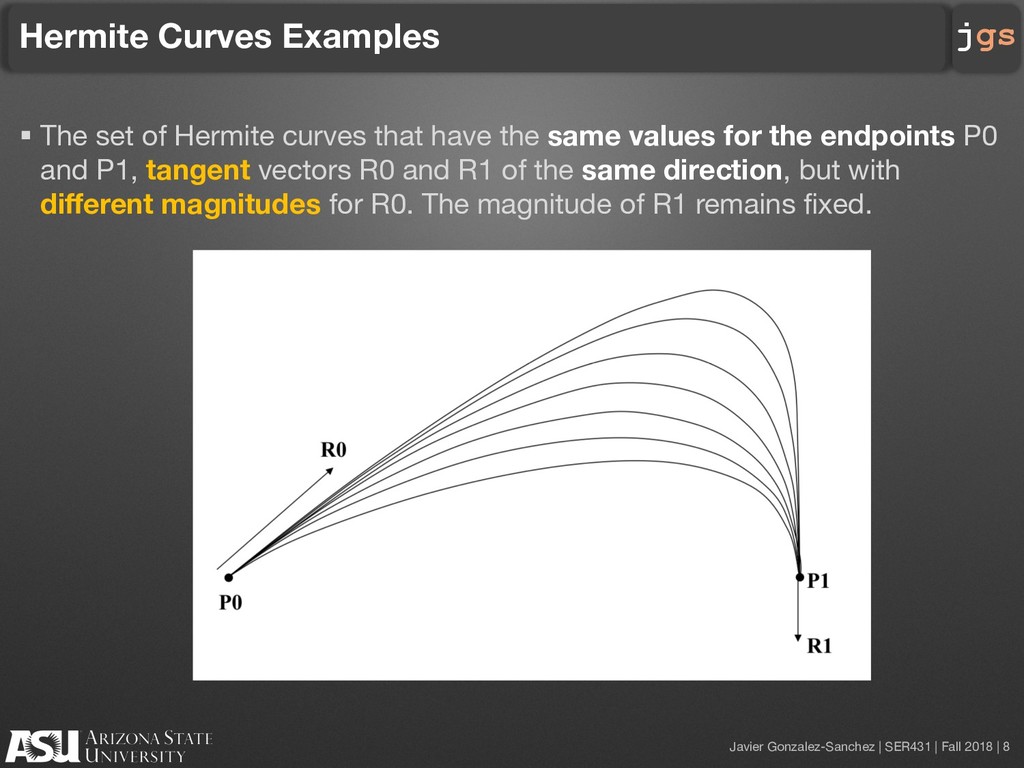
    Hermite Curves Examples
    § The set of Hermite curves that have the same values for the endpoints P0
    and P1, tangent vectors R0 and R1 of the same direction, but with
    different magnitudes for R0. The magnitude of R1 remains fixed.

    View Slide

  9. Javier Gonzalez-Sanchez | SER431 | Fall 2018 | 9
    jgs
    Test Yourselves
    0 0 0
    10 10 0
    0 10 0
    10 0 0
    A
    B

    View Slide

  10. jgs
    Source Code

    View Slide

  11. Javier Gonzalez-Sanchez | SER431 | Fall 2018 | 11
    jgs
    Step 1
    float Geometry[4][3] = {
    { -10, -10, 0 }, // Point 1
    { 10, 10, 0 }, // Point 2
    { -10, 20, 0 }, // Tangent 1
    { 10, 0, 0 } // Tangent 2
    };

    View Slide

  12. Javier Gonzalez-Sanchez | SER431 | Fall 2018 | 12
    jgs
    Step 2
    // Points
    glColor3f(1, 0, 0);
    glPointSize(3);
    glBegin(GL_POINTS);
    glVertex3fv(Geometry[0]);
    glVertex3fv(Geometry[1]);
    glEnd();

    View Slide

  13. Javier Gonzalez-Sanchez | SER431 | Fall 2018 | 13
    jgs
    Step 3
    glColor3f(0, 1, 0);
    glBegin(GL_LINE_STRIP);
    for (int i = 0; i != N; ++i) {
    float t = (float)i / (N - 1);
    // blending functions
    float b0 = 2 * t*t*t - 3 * t*t + 1;
    float b1 = -2 * t*t*t + 3 * t*t;
    float b2 = t*t*t - 2 * t*t + t;
    float b3 = t*t*t - t * t;
    // x, y and z of the curve point
    float x = b0*Geom[0][0] + b1*Geom[1][0] + b2*Geom[2][0] + b3*Geom[3][0];
    float y = b0*Geom[0][1] + b1*Geom[1][1] + b2*Geom[2][1] + b3*Geom[3][1];
    float z = b0*Geom[0][2] + b1*Geom[1][2] + b2*Geom[2][2] + b3*Geom[3][2];
    // the point
    glVertex3f(x, y, z);
    }
    glEnd();

    View Slide

  14. Javier Gonzalez-Sanchez | SER431 | Fall 2018 | 14
    jgs
    Step 4 (extra)
    // Control Graph
    glColor3f(0, 0, 1);
    glPushMatrix();
    glTranslatef(Geometry[0][0], Geometry[0][1], Geometry[0][2]);
    glBegin(GL_LINES);
    glVertex3f(0, 0, 0);
    glVertex3fv(Geometry[2]);
    glEnd();
    glPopMatrix();
    glPushMatrix();
    glTranslatef(Geometry[1][0], Geometry[1][1], Geometry[1][2]);
    glBegin(GL_LINES);
    glVertex3f(0, 0, 0);
    glVertex3fv(Geometry[3]);
    glEnd();
    glPopMatrix();

    View Slide

  15. jgs
    Chaikin Curves

    View Slide

  16. Javier Gonzalez-Sanchez | SER431 | Fall 2018 | 16
    jgs
    Definition
    § Corner cutting algorithm
    § Generate a curve by successive refinement of a control polygon (a set of
    control points)

    View Slide

  17. Javier Gonzalez-Sanchez | SER431 | Fall 2018 | 17
    jgs
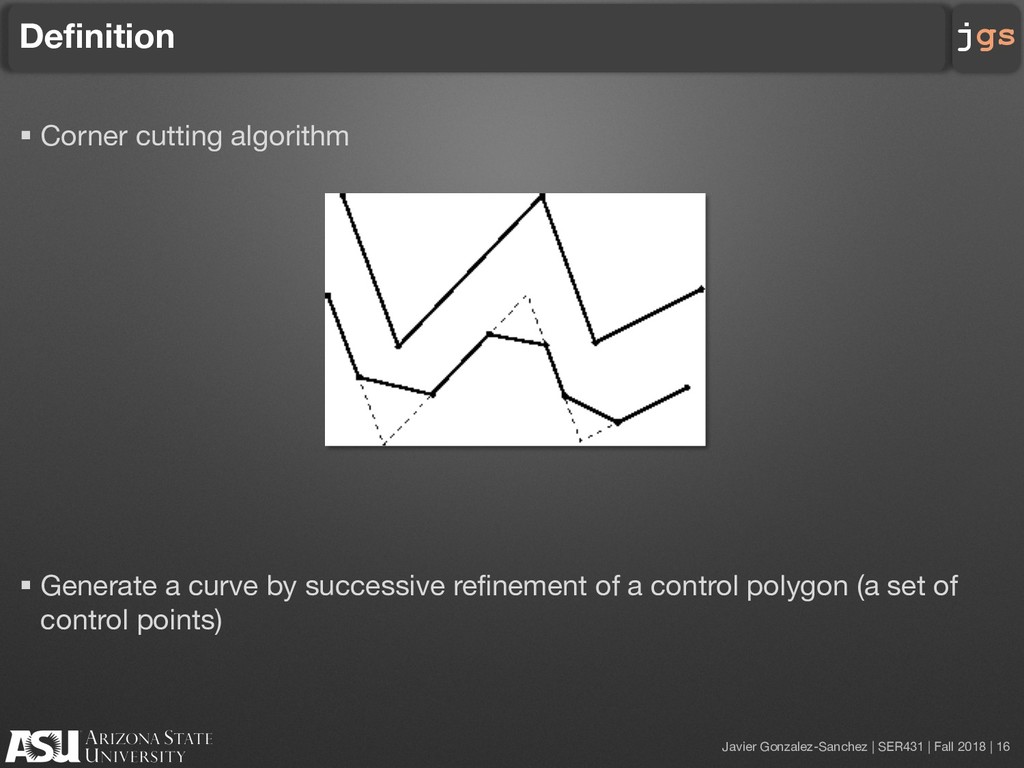
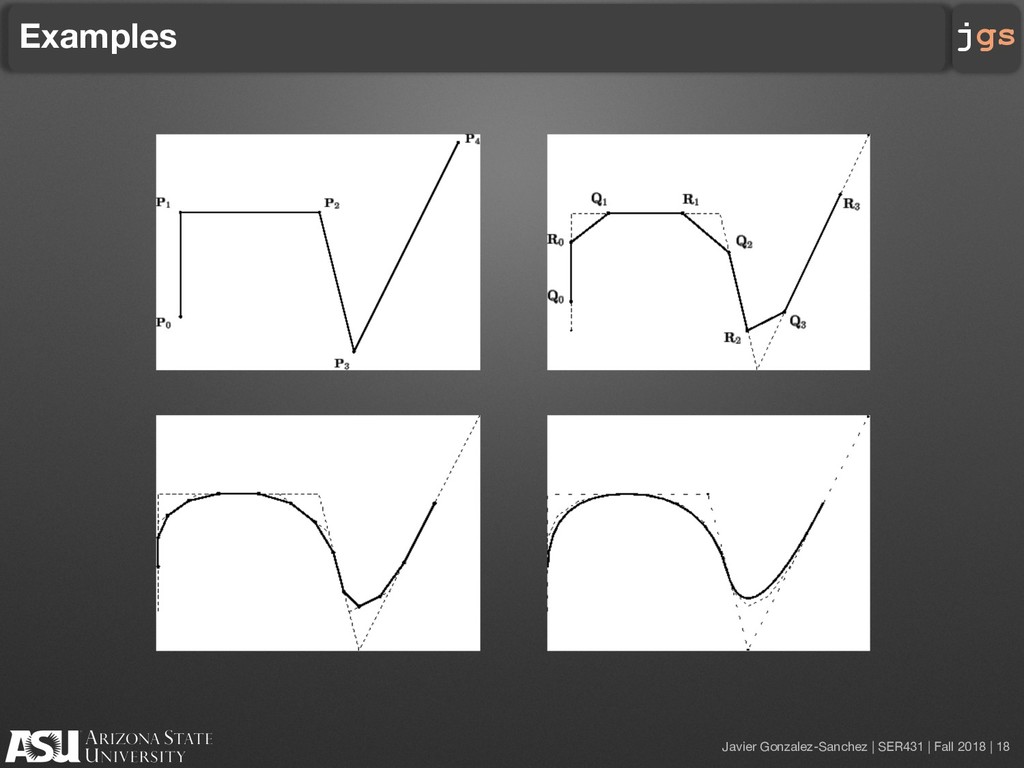
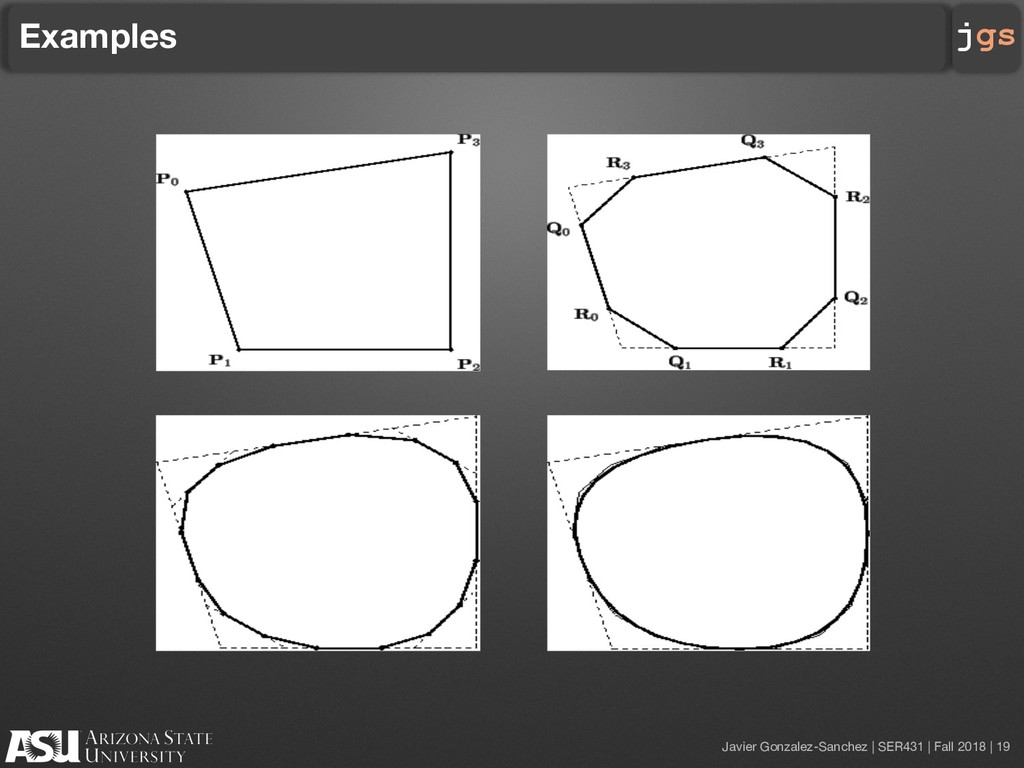
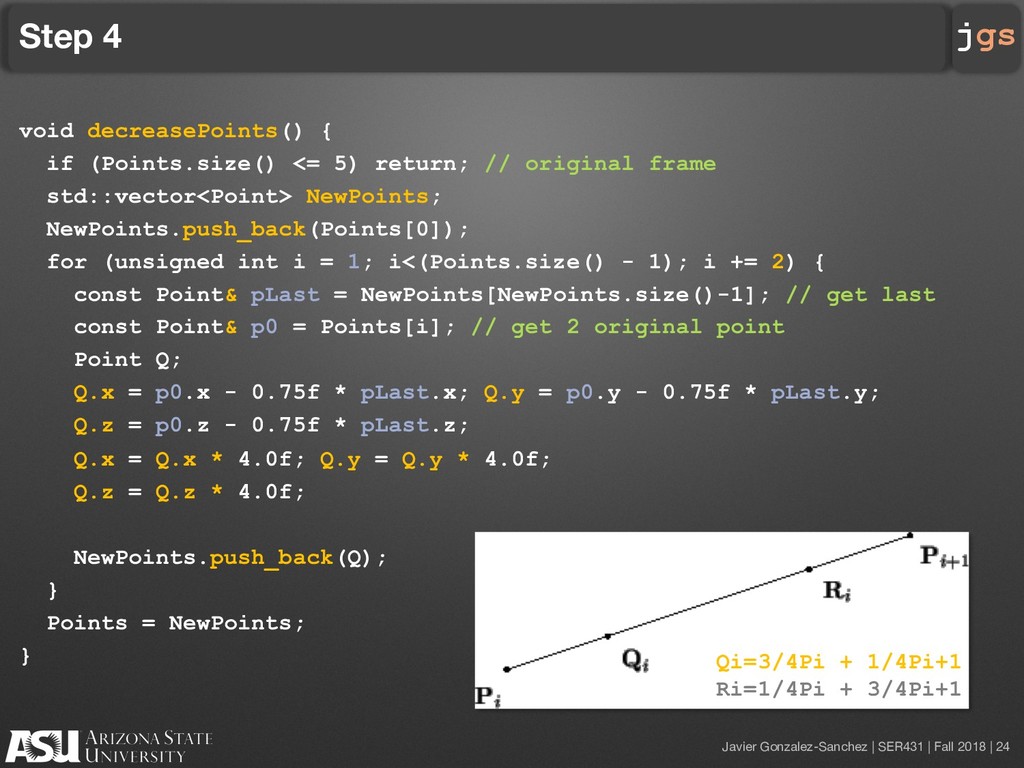
    Method
    § Given a control polygon {P0, P1, P2, …, Pn}
    § Refine it by generating a new sequence of control point as
    {Q0, R0, Q1, R1, …, Qn-1, Rn-1}
    Where each pair Qi, Ri are to be at a ratio of ¼ and ¾ between the end
    points of the line segment Pi Pi+1
    Qi=3/4Pi + 1/4Pi+1
    Ri=1/4Pi + 3/4Pi+1

    View Slide

  18. Javier Gonzalez-Sanchez | SER431 | Fall 2018 | 18
    jgs
    Examples

    View Slide

  19. Javier Gonzalez-Sanchez | SER431 | Fall 2018 | 19
    jgs
    Examples

    View Slide

  20. jgs
    Source Code

    View Slide

  21. Javier Gonzalez-Sanchez | SER431 | Fall 2018 | 21
    jgs
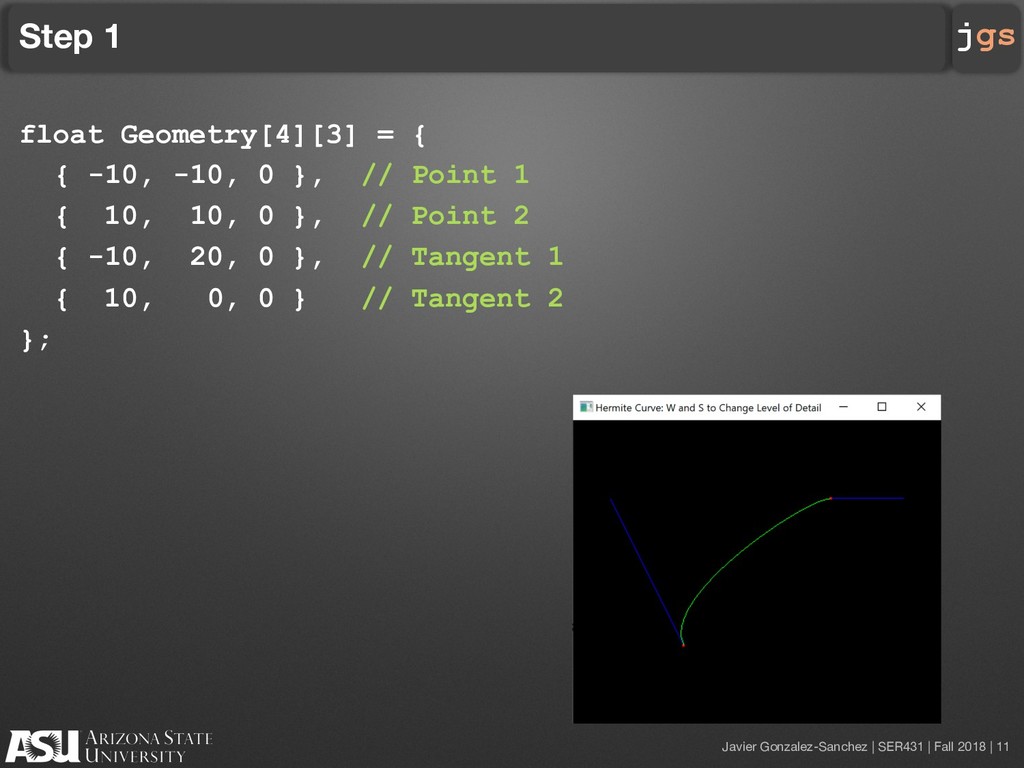
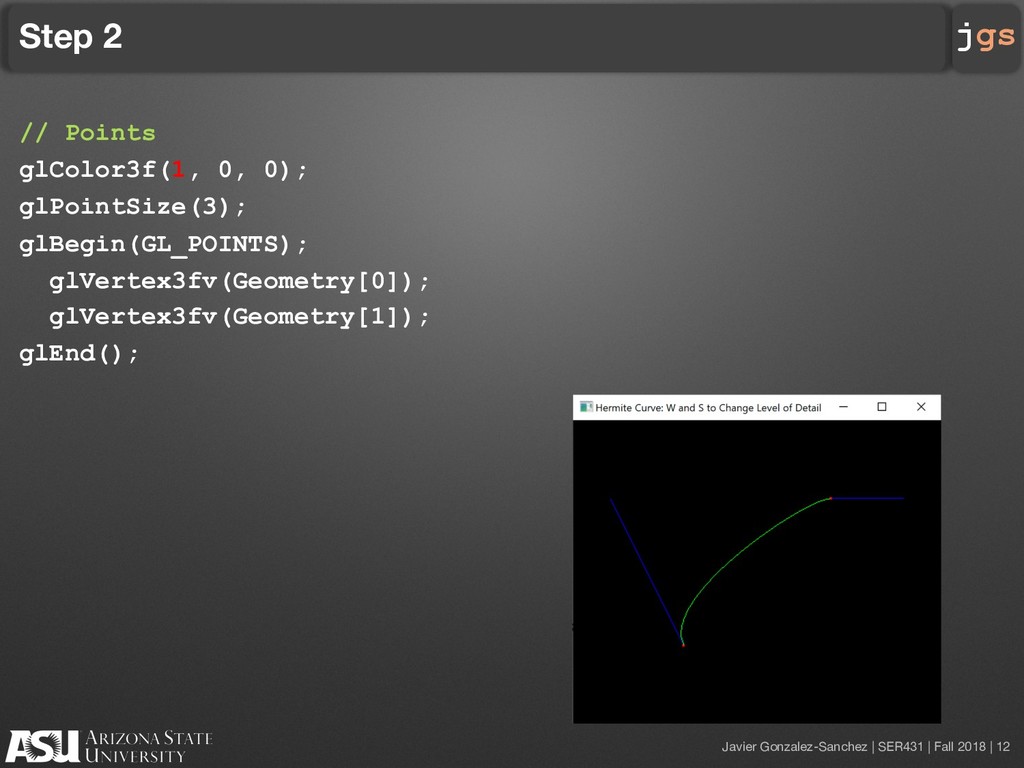
    Step 1
    class Point {
    public:
    float x, y, z;
    Point() { x = 0; y = 0; z = 0; }
    Point(const float a, const float b, const float c) { x = a; y = b; z = c; }
    Point(const Point& p) { x = p.x; y = p.y; z = p.z; }
    };
    std::vector Points;

    View Slide

  22. Javier Gonzalez-Sanchez | SER431 | Fall 2018 | 22
    jgs
    Step 2
    // Initial Points
    Points.push_back(Point( 0, 10, 0));
    Points.push_back(Point( -10, 10, 0));
    Points.push_back(Point(- 10, -10, 0));
    Points.push_back(Point( 10, -10, 0));
    Points.push_back(Point( 10, 10, 0));

    View Slide

  23. Javier Gonzalez-Sanchez | SER431 | Fall 2018 | 23
    jgs
    Step 3
    void increasePoints() {
    if (Points.size() >= 50) return;
    std::vector NewPoints;
    NewPoints.push_back(Points[0]); // keep the first point
    for (unsigned int i = 0; i<(Points.size() - 1); ++i) {
    const Point& p0 = Points[i];
    const Point& p1 = Points[i + 1];
    Point Q, R;
    Q.x = 0.75f*p0.x + 0.25f*p1.x; Q.y = 0.75f*p0.y + 0.25f*p1.y;
    Q.z = 0.75f*p0.z + 0.25f*p1.z;
    R.x = 0.25f*p0.x + 0.75f*p1.x; R.y = 0.25f*p0.y + 0.75f*p1.y;
    R.z = 0.25f*p0.z + 0.75f*p1.z;
    NewPoints.push_back(Q);
    NewPoints.push_back(R);
    }
    NewPoints.push_back(Points[Points.size() - 1]);
    Points = NewPoints;
    }

    View Slide

  24. Javier Gonzalez-Sanchez | SER431 | Fall 2018 | 24
    jgs
    Step 4
    void decreasePoints() {
    if (Points.size() <= 5) return; // original frame
    std::vector NewPoints;
    NewPoints.push_back(Points[0]);
    for (unsigned int i = 1; i<(Points.size() - 1); i += 2) {
    const Point& pLast = NewPoints[NewPoints.size()-1]; // get last
    const Point& p0 = Points[i]; // get 2 original point
    Point Q;
    Q.x = p0.x - 0.75f * pLast.x; Q.y = p0.y - 0.75f * pLast.y;
    Q.z = p0.z - 0.75f * pLast.z;
    Q.x = Q.x * 4.0f; Q.y = Q.y * 4.0f;
    Q.z = Q.z * 4.0f;
    NewPoints.push_back(Q);
    }
    Points = NewPoints;
    } Qi=3/4Pi + 1/4Pi+1
    Ri=1/4Pi + 3/4Pi+1

    View Slide

  25. Javier Gonzalez-Sanchez | SER431 | Fall 2018 | 25
    jgs
    Step 5
    // Control Graph
    void display() {
    // ...
    glColor3f(1, 1, 0);
    glBegin(GL_LINE_STRIP);
    std::vector::iterator it = Points.begin();
    for ( ; it != Points.end(); ++it) {
    glVertex3f(it->x, it->y, it->z);
    }
    glEnd();
    glutSwapBuffers();
    }

    View Slide

  26. Javier Gonzalez-Sanchez | SER431 | Fall 2018 | 26
    jgs
    Homework
    § Review the source code on Github

    View Slide

  27. jgs
    SER431 Advanced Graphics
    Javier Gonzalez-Sanchez
    [email protected]
    Fall 2018
    Disclaimer. These slides can only be used as study material for the class SER431 at ASU. They cannot be
    distributed or used for another purpose.

    View Slide