Upgrade to Pro — share decks privately, control downloads, hide ads and more …

Measuring Crowdsourcing Effort with Error-Time Curves

Measuring Crowdsourcing Effort with Error-Time Curves

Presented at CHI 2015.

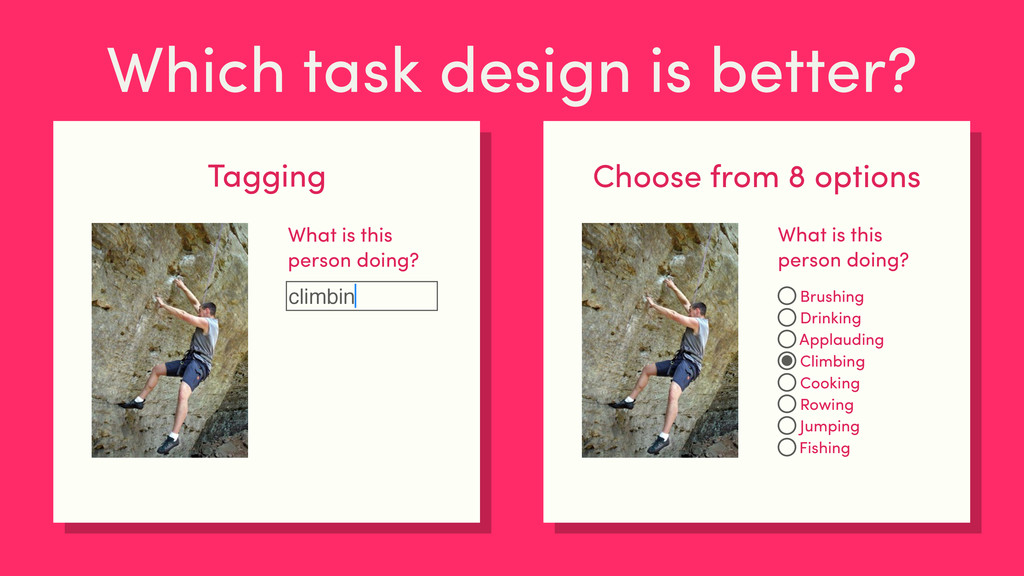
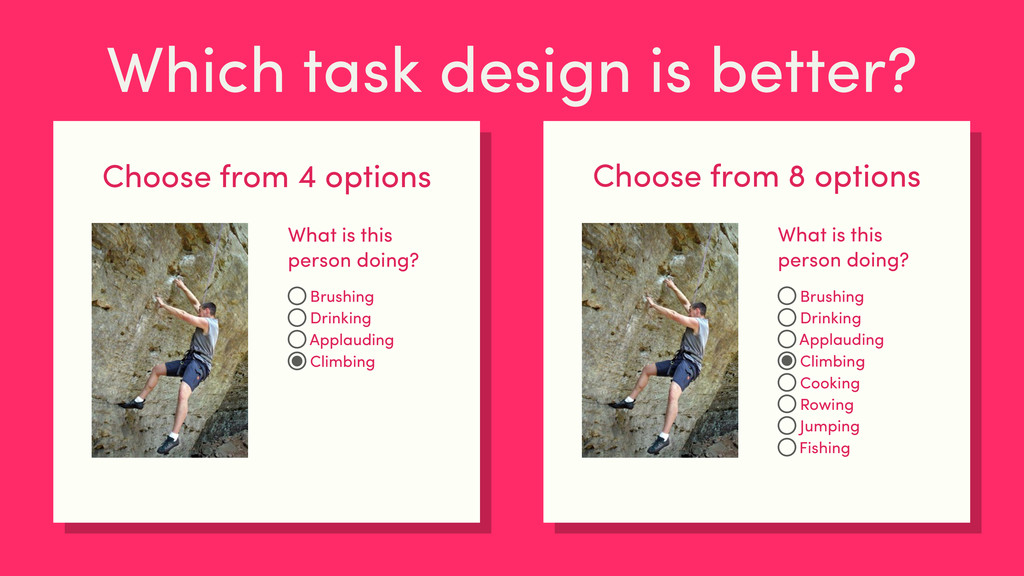
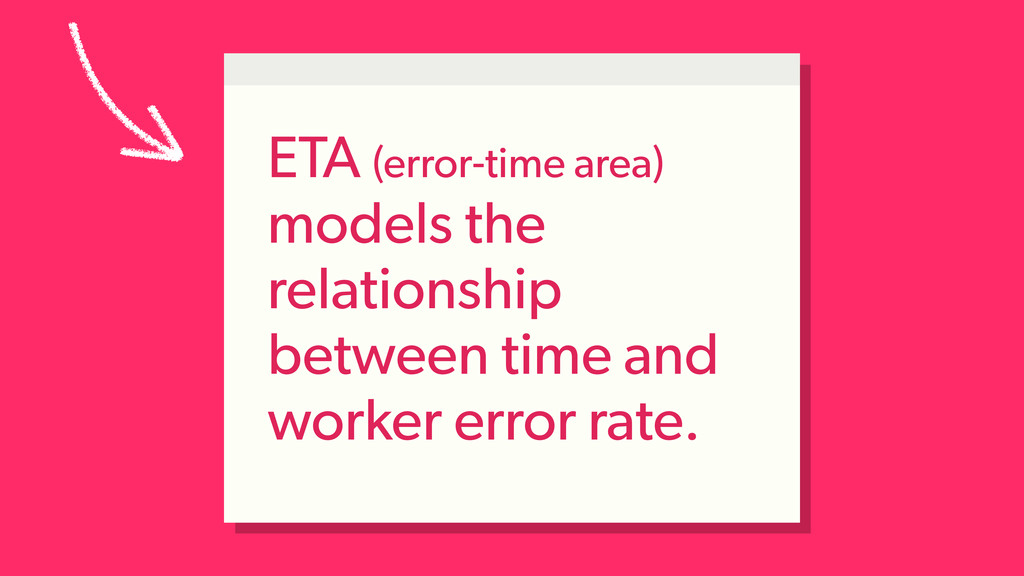
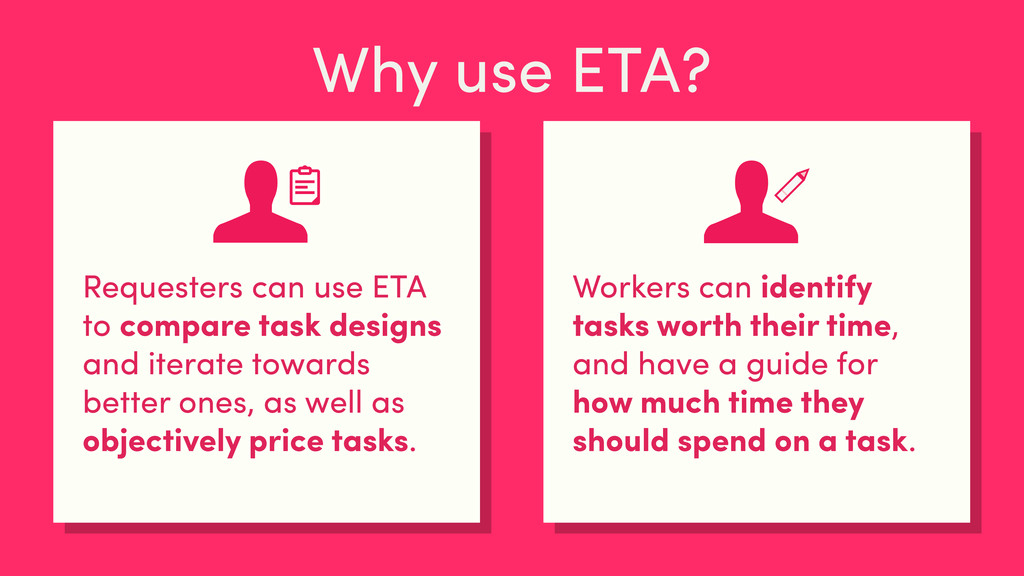
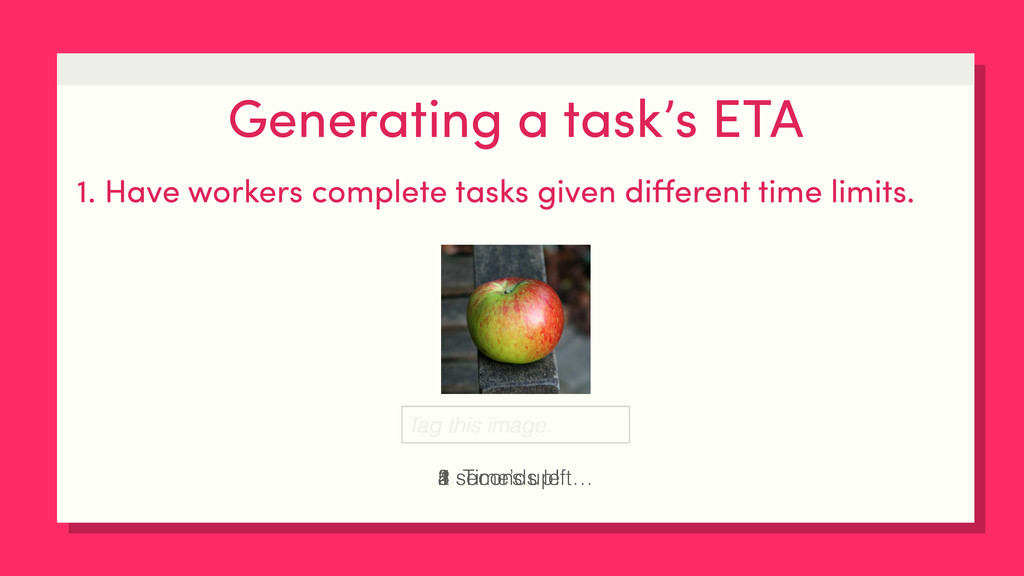
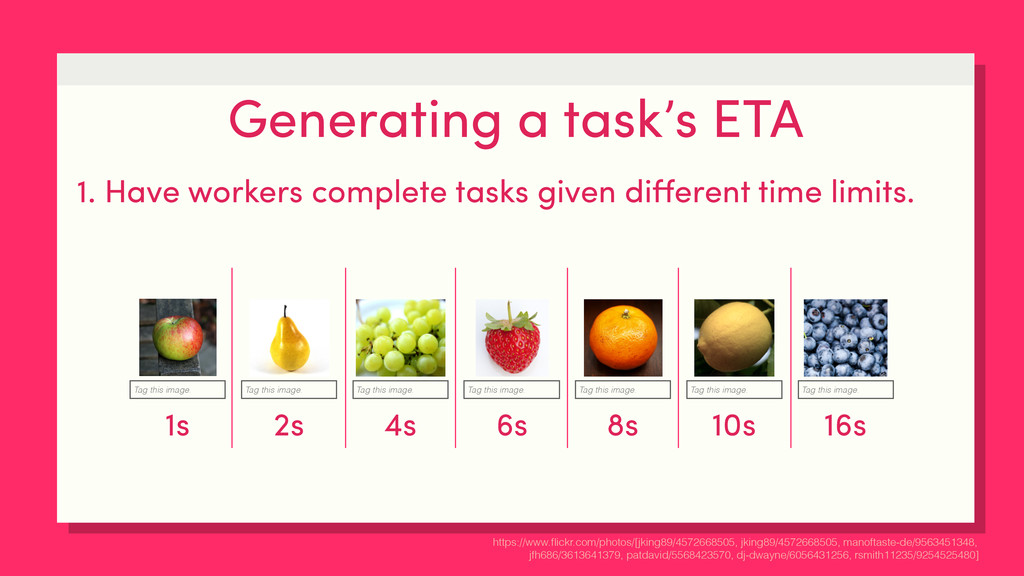
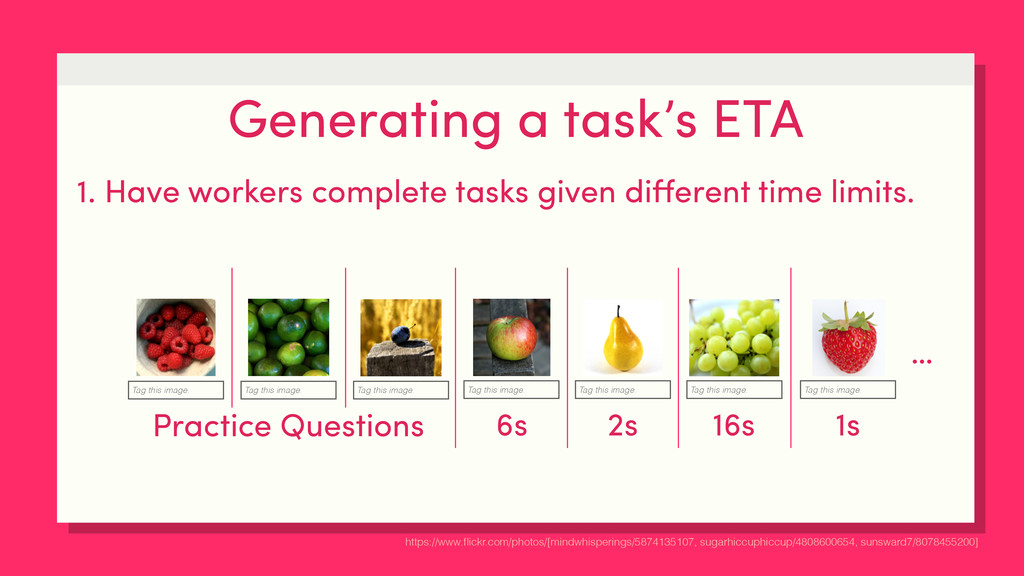
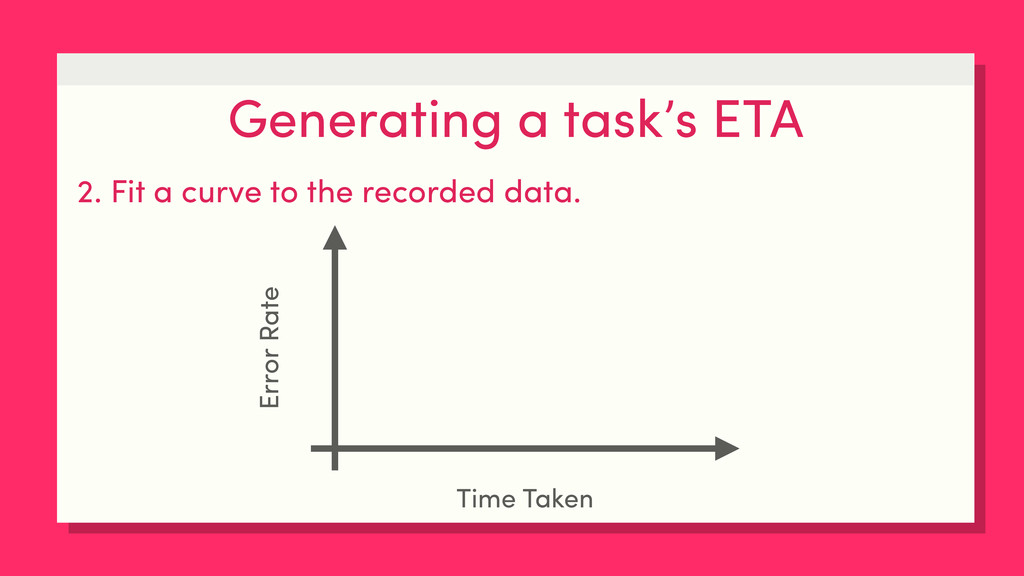
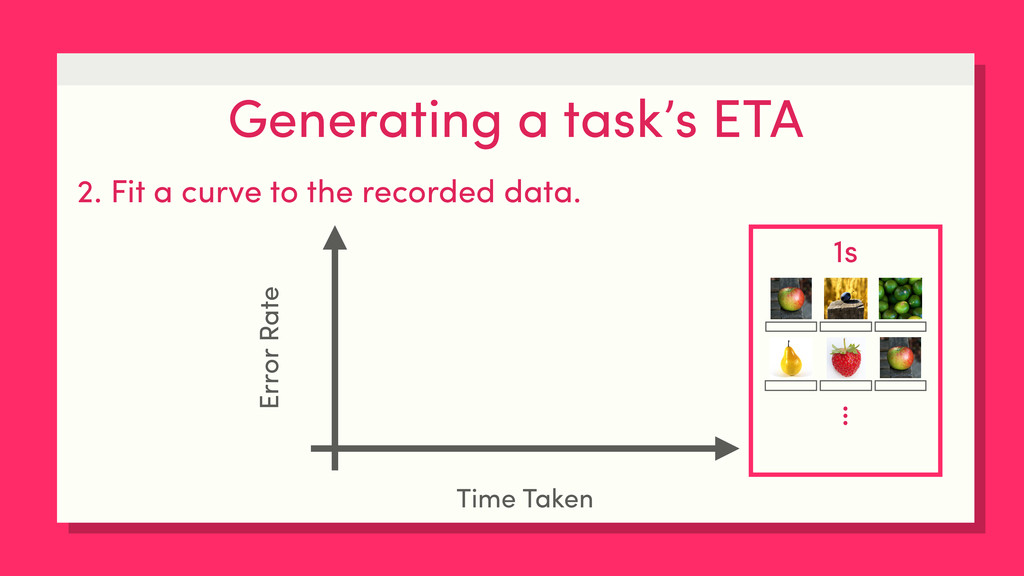
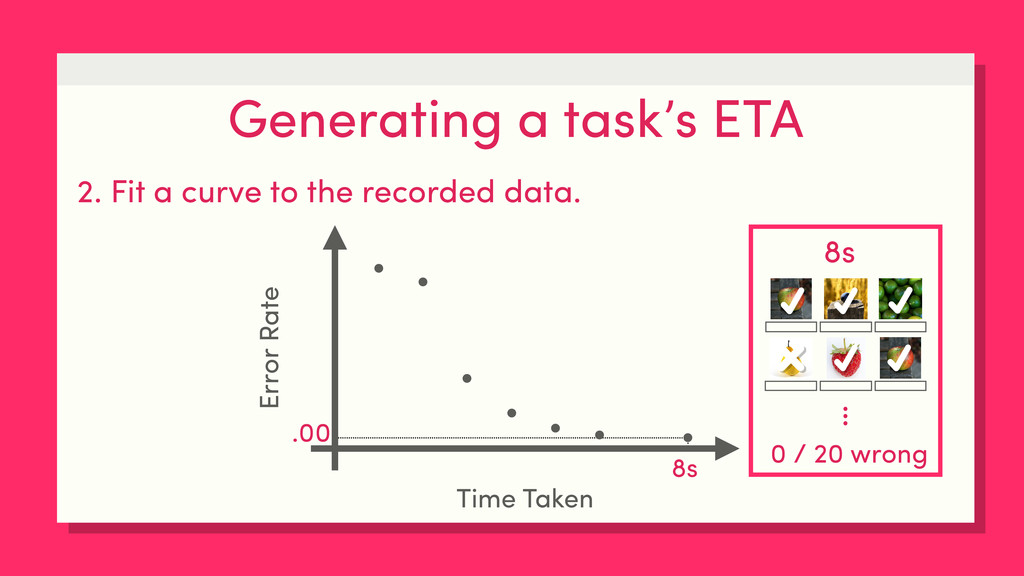
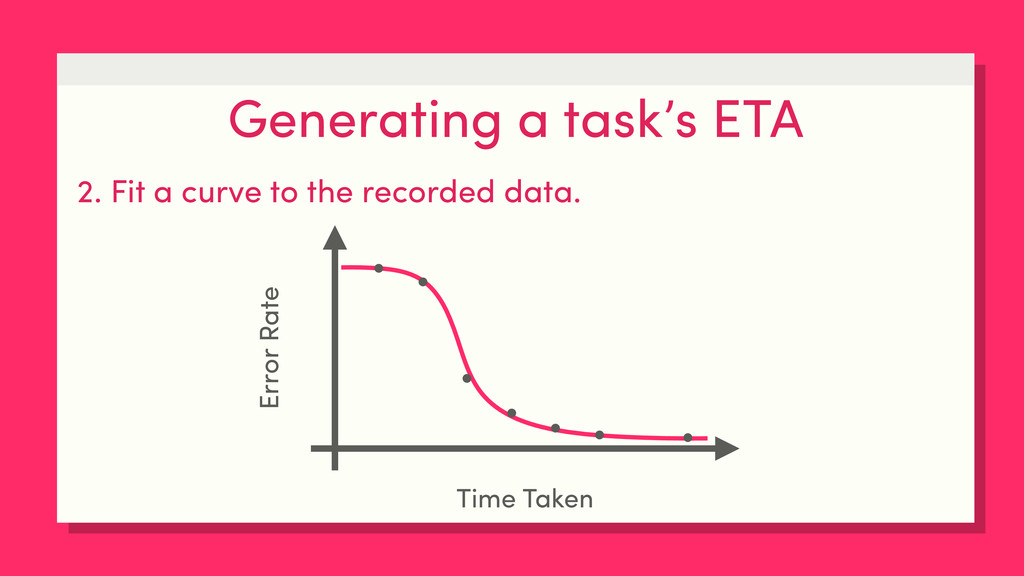
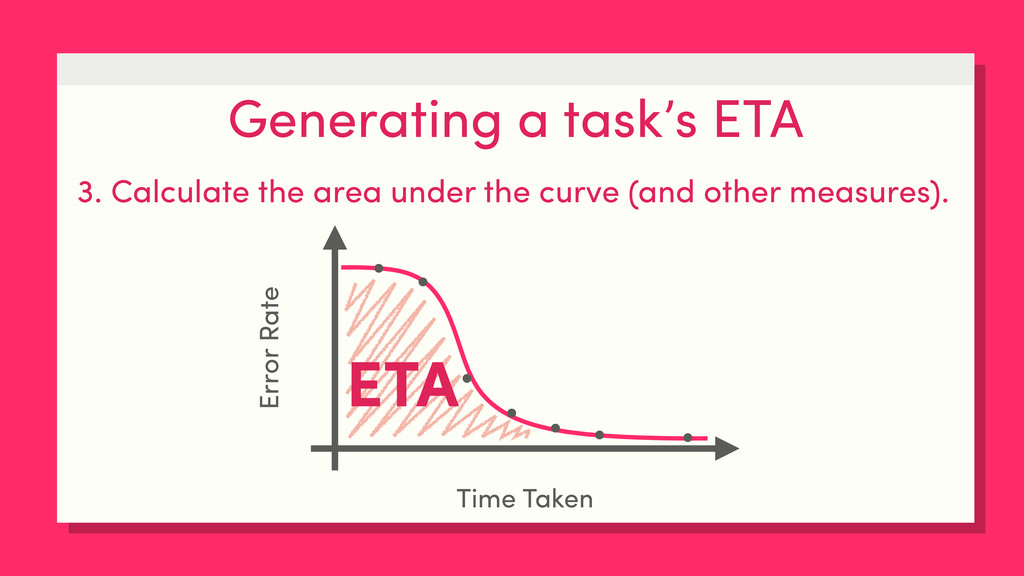
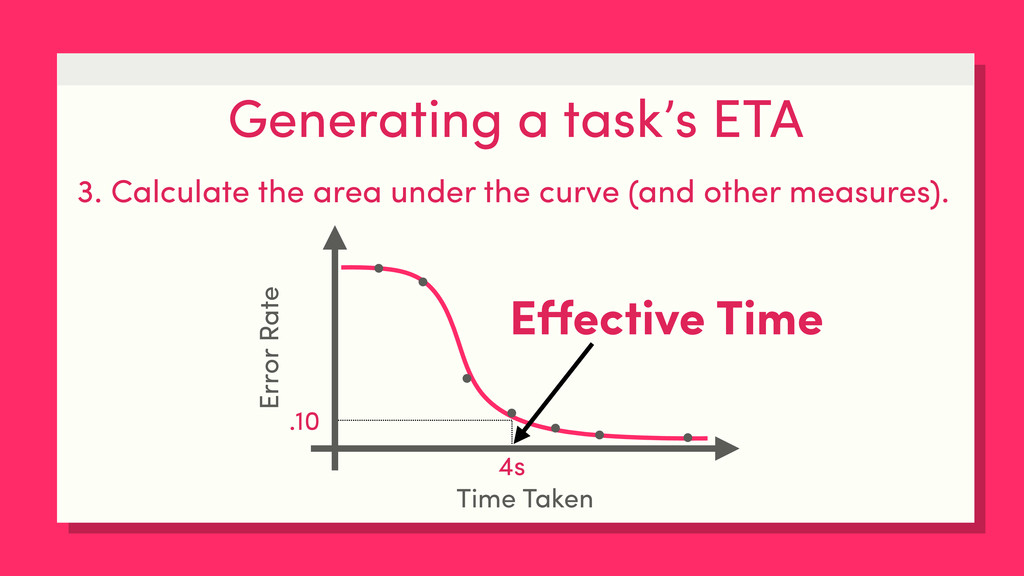
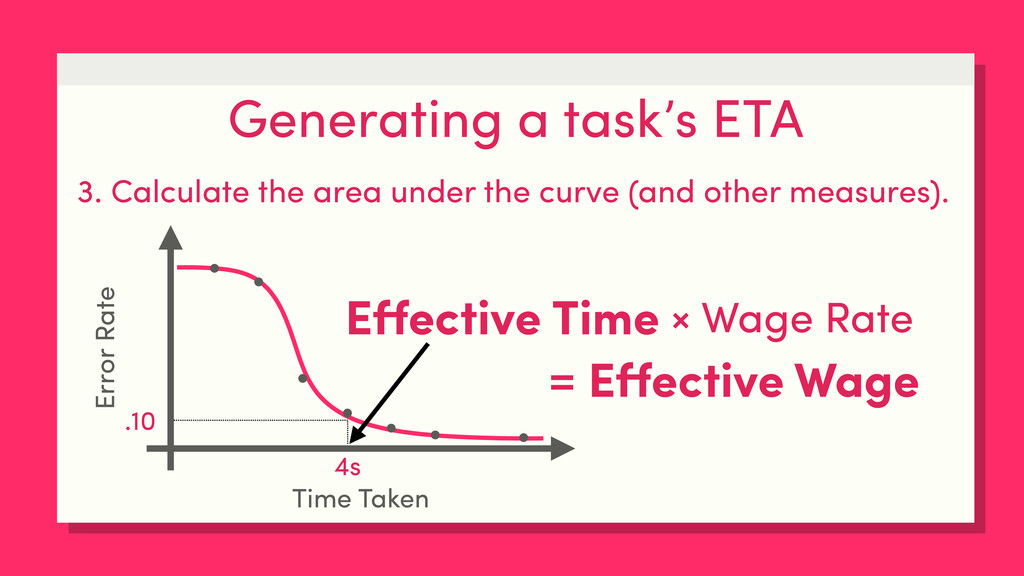
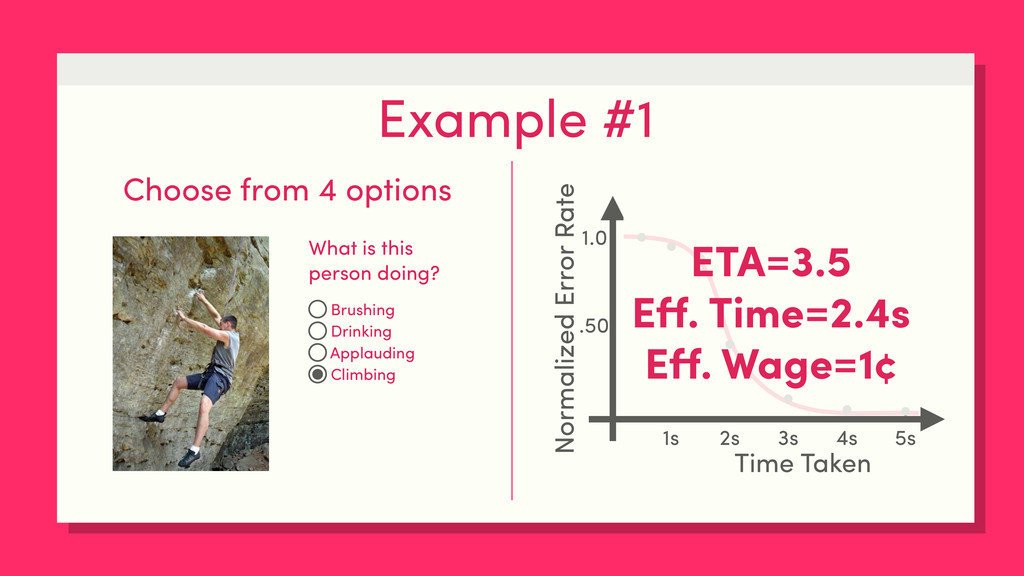
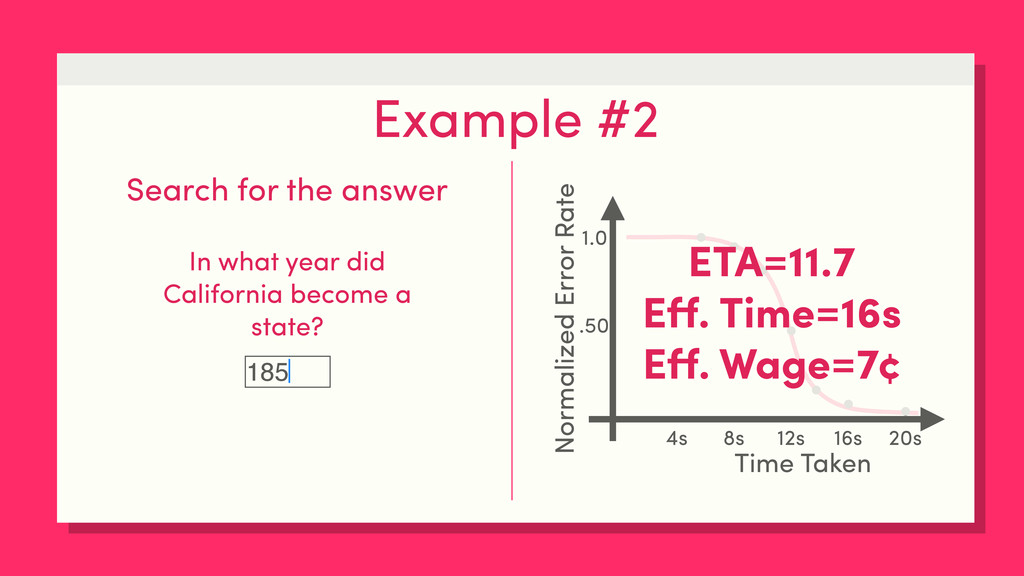
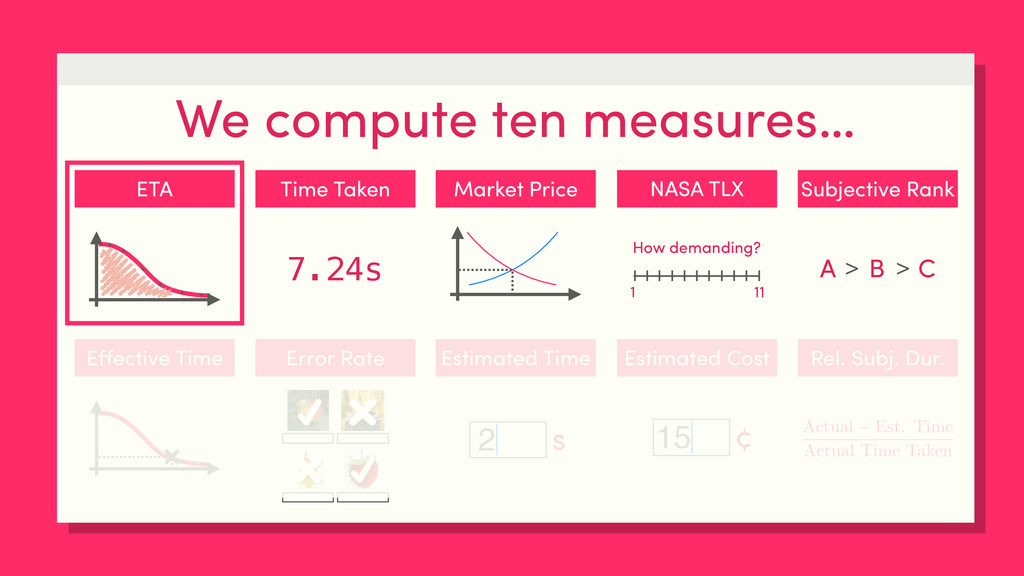
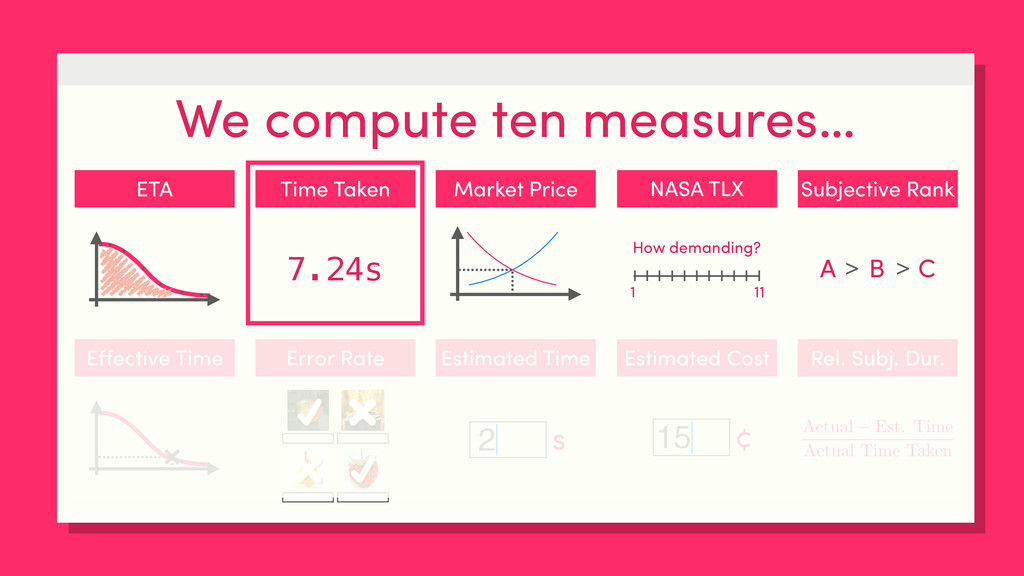
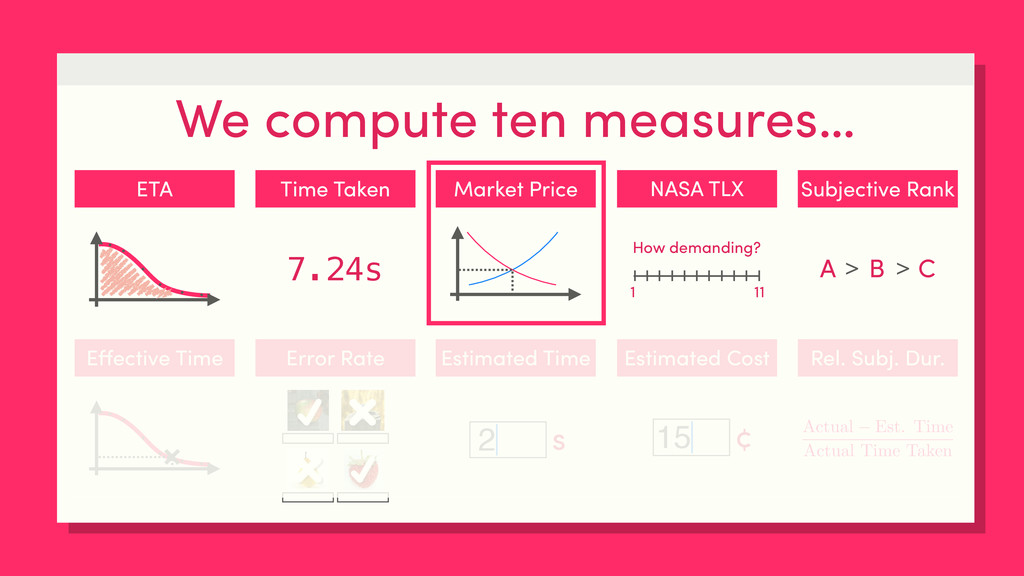
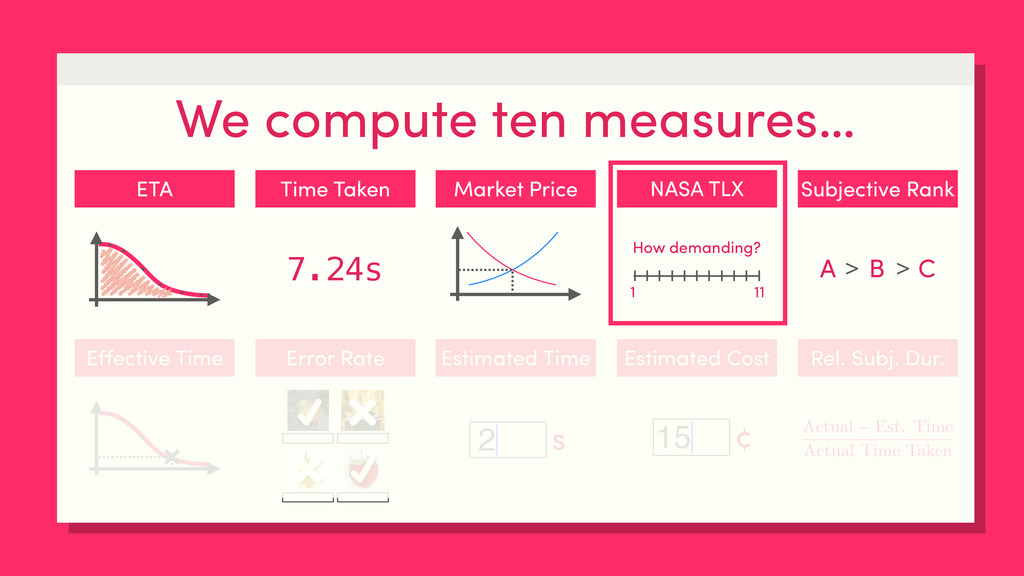
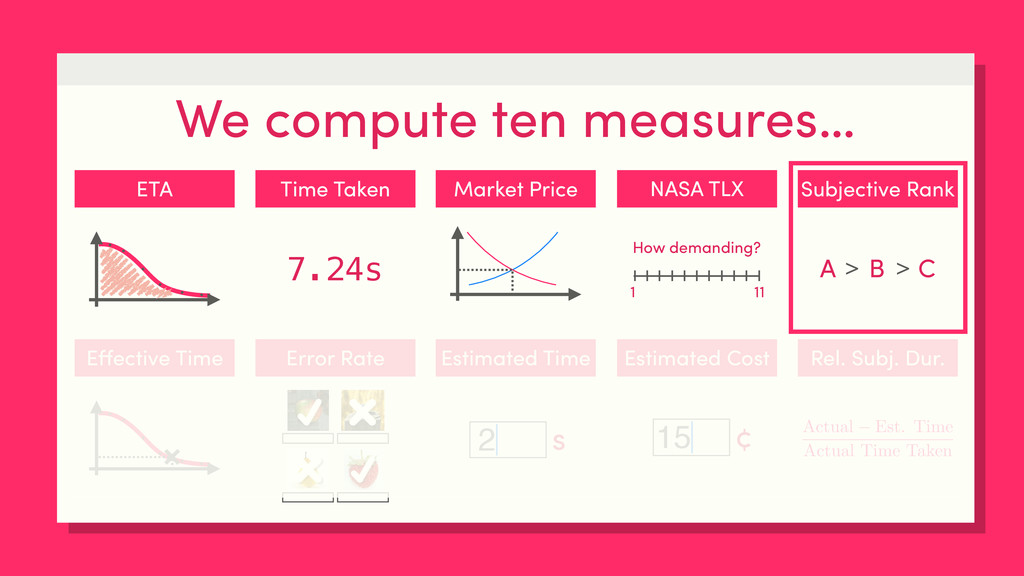
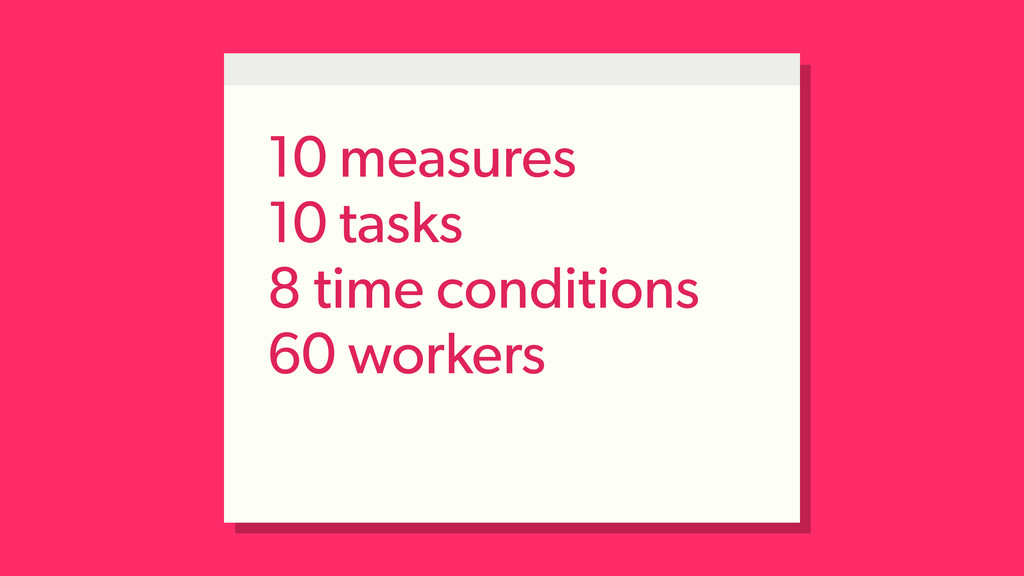
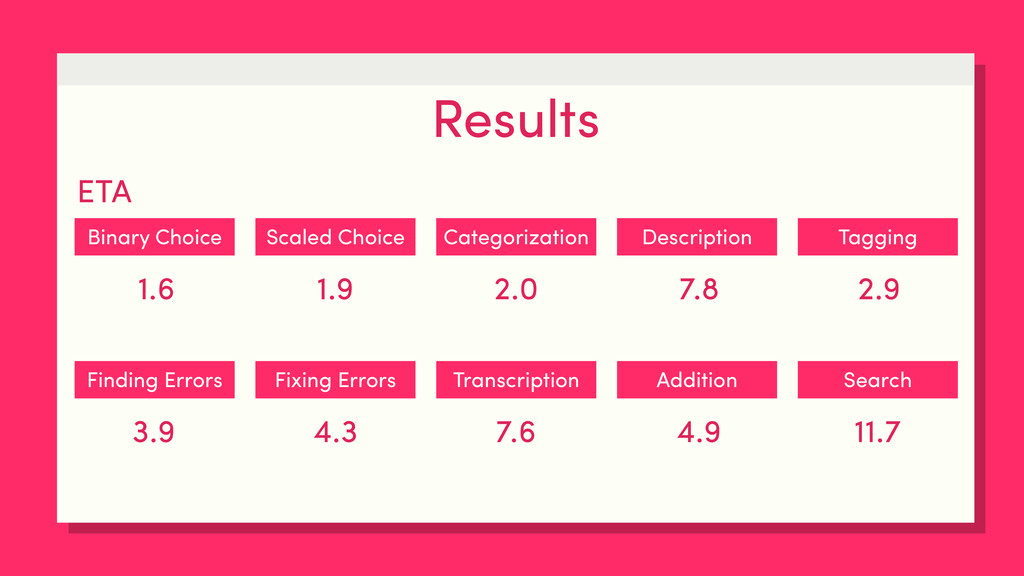
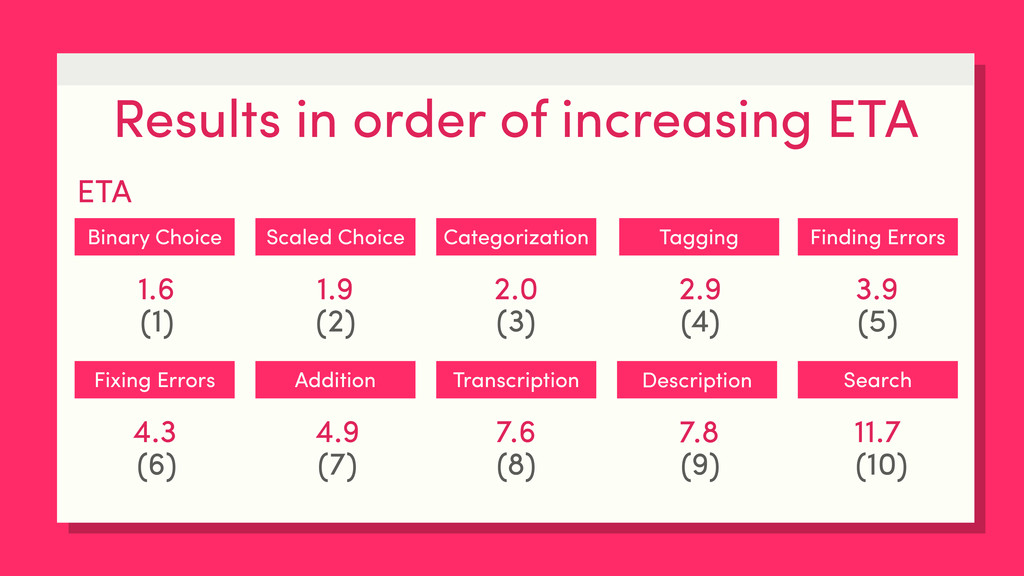
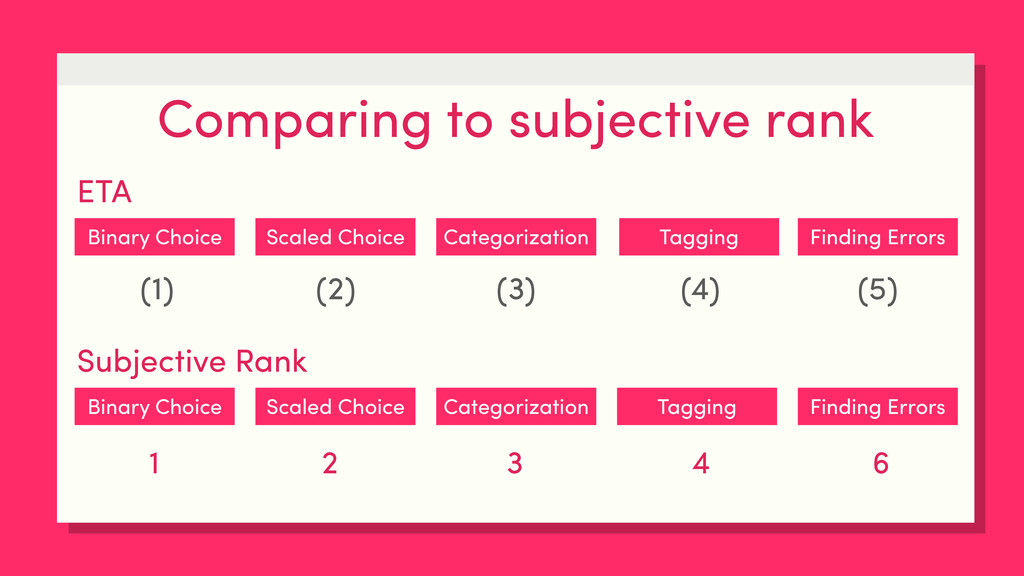
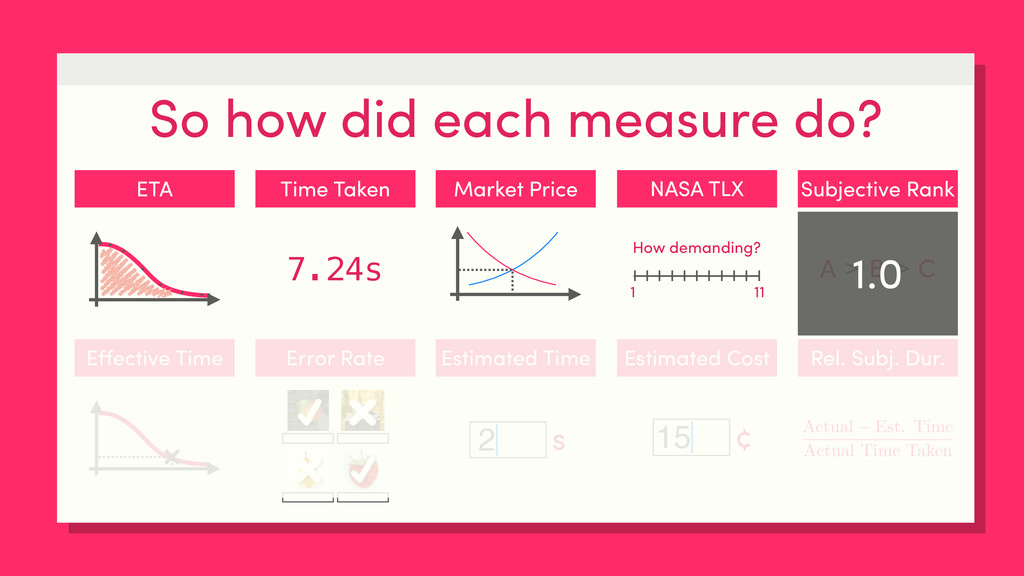
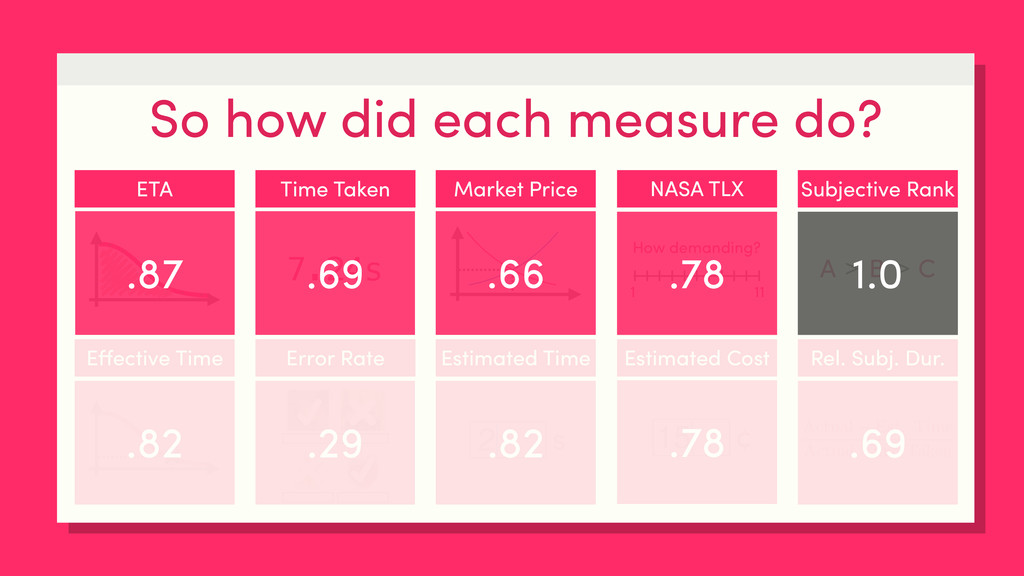
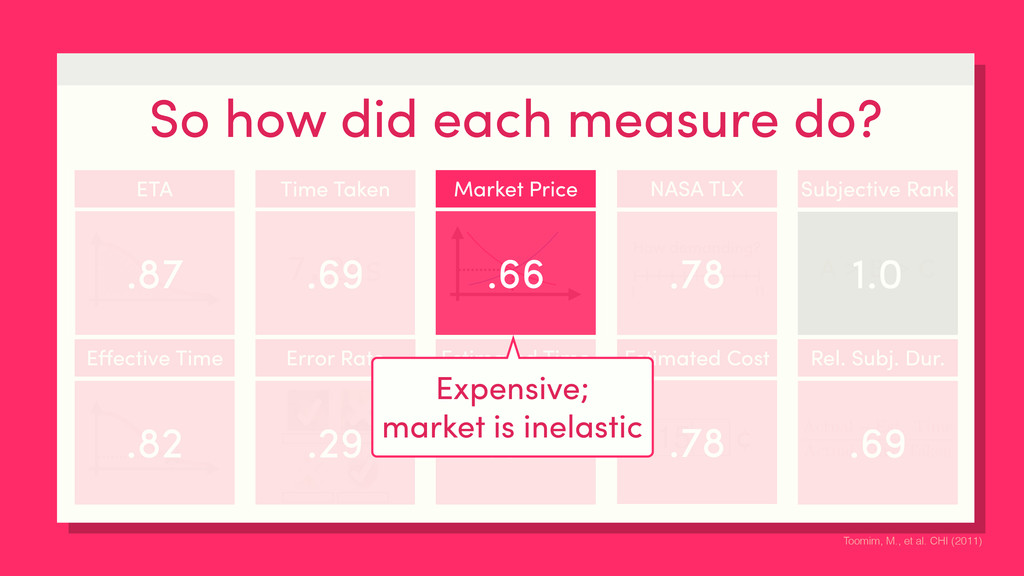
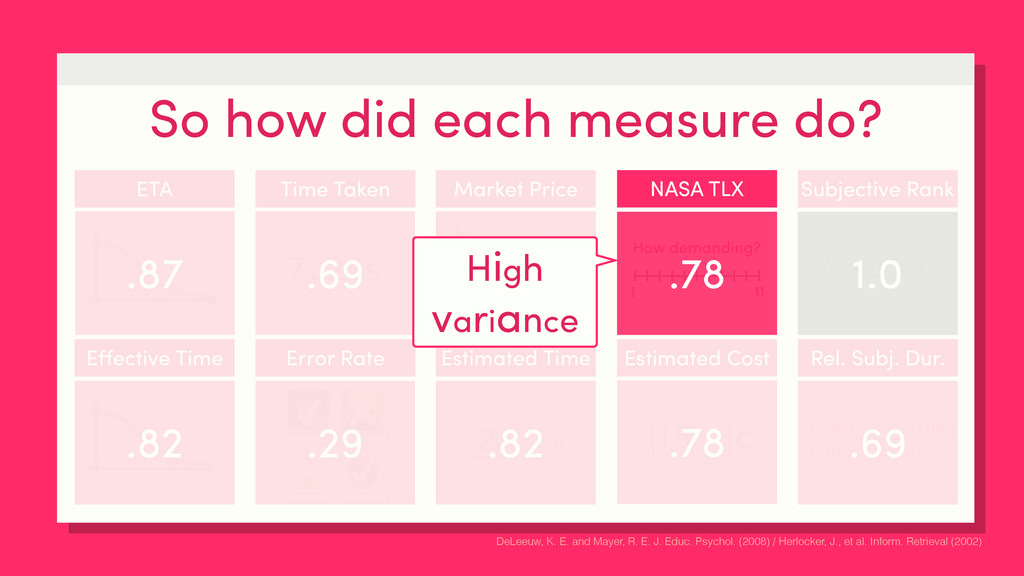
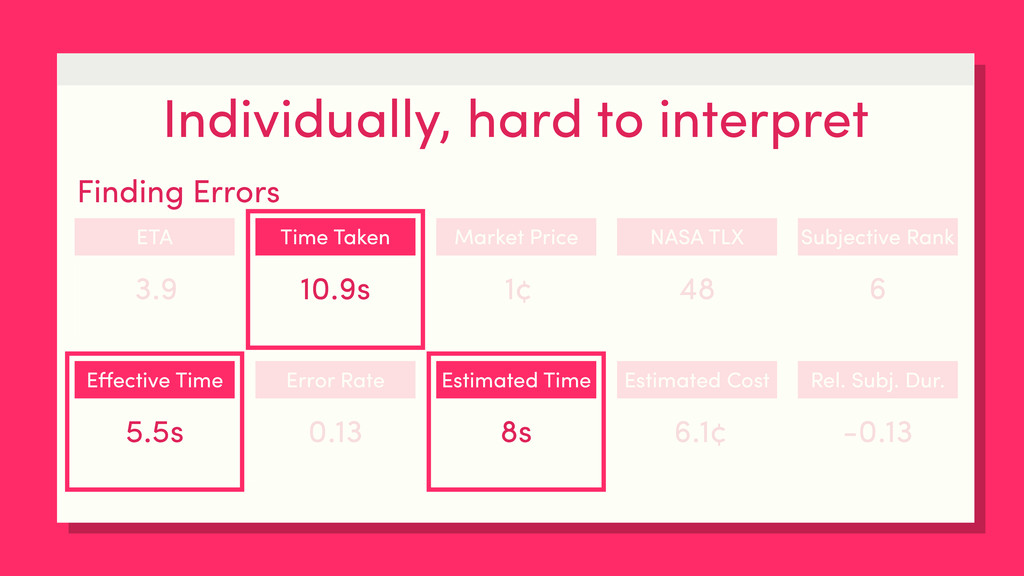
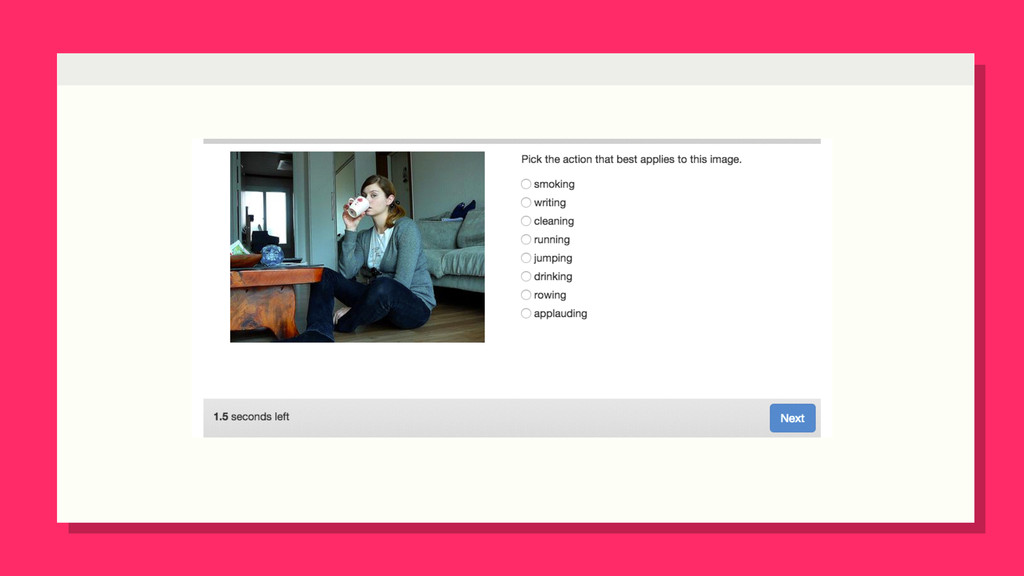
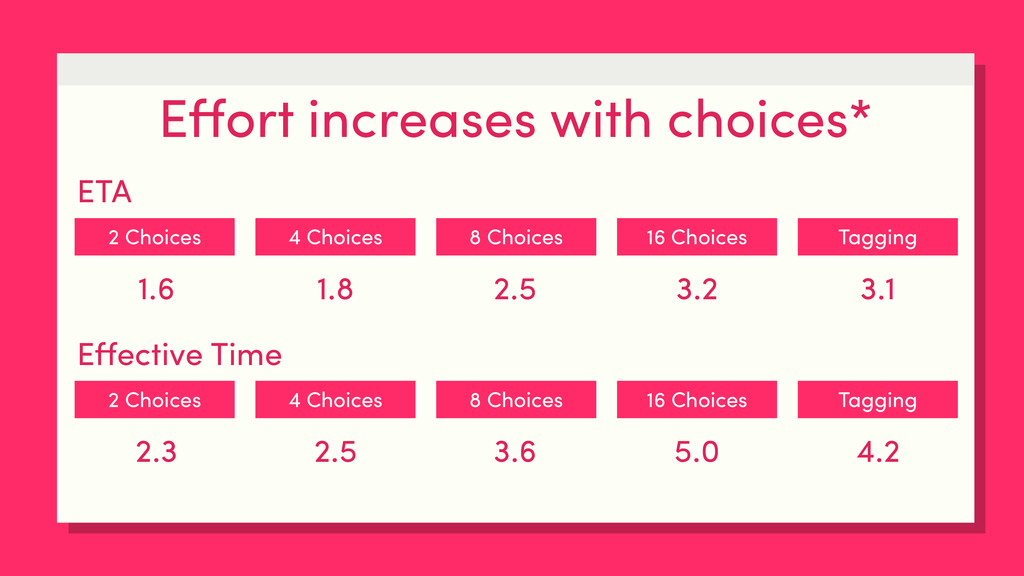
Crowdsourcing systems lack effective measures of the effort required to complete each task. Without knowing how much time workers need to execute a task well, requesters struggle to accurately structure and price their work. Objective measures of effort could better help workers identify tasks that are worth their time. We propose a data-driven effort metric, ETA (error-time area), that can be used to determine a task's fair price. It empirically models the relationship between time and error rate by manipulating the time that workers have to complete a task. ETA reports the area under the error-time curve as a continuous metric of worker effort. The curve's 10th percentile is also interpretable as the minimum time most workers require to complete the task without error, which can be used to price the task. We validate the ETA metric on ten common crowdsourcing tasks, including tagging, transcription, and search, and find that ETA closely tracks how workers would rank these tasks by effort. We also demonstrate how ETA allows requesters to rapidly iterate on task designs and measure whether the changes improve worker efficiency. Our findings can facilitate the process of designing, pricing, and allocating crowdsourcing tasks.

Justin Cheng

April 21, 2015
Tweet

More Decks by Justin Cheng

Other Decks in Research

Transcript

  1. Error-Time Curves
    Justin Cheng @jcccf / Stanford
    Jaime Teevan @jteevan / Microsoft Research
    Michael Bernstein @msbernst / Stanford
    Measuring Crowdsourcing Effort with
    http://hci.st/eta

    View Slide

  2. Crowdsourcing
    allows large
    numbers of people
    to accomplish tasks
    at a global scale.
    Kittur, A., et al. CSCW (2013)

    View Slide

  3. Crowdsourcing
    allows large
    numbers of people
    to accomplish tasks
    at a global scale.
    Copyediting
    Categorization
    Retrieval
    Labeling
    Surveys
    Experiments
    Kittur, A., et al. CSCW (2013)

    View Slide

  4. But it’s difficult to
    design and price
    tasks well.

    View Slide

  5. Which task design is better?
    Tagging
    climbin
    What is this
    person doing?
    Choose from 8 options
    Brushing
    Cooking
    Applauding
    Drinking
    Climbing
    Rowing
    Fishing
    Jumping
    What is this
    person doing?

    View Slide

  6. Which task design is better?
    Choose from 4 options Choose from 8 options
    Brushing
    Applauding
    Drinking
    Climbing
    What is this
    person doing?
    Brushing
    Cooking
    Applauding
    Drinking
    Climbing
    Rowing
    Fishing
    Jumping
    What is this
    person doing?

    View Slide

  7. Requesters end up
    pricing tasks
    arbitrarily.

    View Slide

  8. Requesters tend to
    underestimate the
    effort required to
    complete tasks.
    Hinds, P. Journal of Experimental Psychology: Applied (1999)

    View Slide

  9. Workers are hard-
    pressed to figure
    out which tasks are
    worth their time.

    View Slide

  10. Why not just
    measure how long
    workers take to
    complete a task?

    View Slide

  11. Why not just ask
    workers how
    difficult they
    thought a task
    was?
    Many existing
    measures are
    imprecise

    View Slide

  12. To reliably
    determine task
    difficulty, we need
    a robust, objective
    measure of effort.

    View Slide

  13. ETA (error-time area)
    is a continuous,
    absolute, data-
    driven measure
    of task effort.

    View Slide

  14. ETA (error-time area)
    models the
    relationship
    between time and
    worker error rate.

    View Slide

  15. Why use ETA?
    Requesters can use ETA
    to compare task designs
    and iterate towards
    better ones, as well as
    objectively price tasks.
    Workers can identify
    tasks worth their time,
    and have a guide for
    how much time they
    should spend on a task.

    View Slide

  16. Overview
    1 Error-Time Curves (and ETA)
    Evaluating ETA and other measures
    2
    ETA in action
    3

    View Slide

  17. Understanding
    Error-Time Curves

    View Slide

  18. Time Taken
    Error Rate
    ETA
    How do we
    generate this?

    View Slide

  19. Generating a task’s ETA
    1. Have workers complete tasks given different time limits.
    Tag this image.
    5 seconds left…
    4 seconds left…
    3 seconds left…
    2 seconds left…
    1 seconds left…
    Time’s up!
    Tag this image.

    View Slide

  20. Generating a task’s ETA
    1. Have workers complete tasks given different time limits.
    Tag this image. Tag this image. Tag this image. Tag this image. Tag this image. Tag this image. Tag this image.
    1s 2s 4s 8s 10s 16s
    6s
    https://www.flickr.com/photos/[jking89/4572668505, jking89/4572668505, manoftaste-de/9563451348,
    jfh686/3613641379, patdavid/5568423570, dj-dwayne/6056431256, rsmith11235/9254525480]

    View Slide

  21. Generating a task’s ETA
    1. Have workers complete tasks given different time limits.
    Tag this image. Tag this image. Tag this image. Tag this image.
    1s
    2s 4s
    8s 10s
    16s
    6s
    Tag this image. Tag this image. Tag this image.
    https://www.flickr.com/photos/[jking89/4572668505, jking89/4572668505, manoftaste-de/9563451348,
    jfh686/3613641379, patdavid/5568423570, dj-dwayne/6056431256, rsmith11235/9254525480]

    View Slide

  22. Generating a task’s ETA
    1. Have workers complete tasks given different time limits.
    Tag this image.
    2s 16s
    6s
    Tag this image. Tag this image.
    Tag this image.
    Practice Questions
    https://www.flickr.com/photos/[mindwhisperings/5874135107, sugarhiccuphiccup/4808600654, sunsward7/8078455200]
    Tag this image. Tag this image.
    1s
    Tag this image.

    View Slide

  23. Generating a task’s ETA
    2. Fit a curve to the recorded data.
    Time Taken
    Error Rate

    View Slide

  24. Generating a task’s ETA
    2. Fit a curve to the recorded data.
    1s
    Time Taken
    Error Rate

    View Slide

  25. Generating a task’s ETA
    2. Fit a curve to the recorded data.
    1s
    Time Taken
    Error Rate

    1s
    1.0
    20 / 20 wrong

    View Slide

  26. Generating a task’s ETA
    2. Fit a curve to the recorded data.
    2s
    Time Taken
    Error Rate

    2s
    .90
    18 / 20 wrong

    View Slide

  27. Generating a task’s ETA
    2. Fit a curve to the recorded data.
    8s
    Time Taken
    Error Rate

    .00
    8s
    0 / 20 wrong

    View Slide

  28. Generating a task’s ETA
    2. Fit a curve to the recorded data.
    Time Taken
    Error Rate

    View Slide

  29. Generating a task’s ETA
    3. Calculate the area under the curve (and other measures).
    Time Taken
    Error Rate
    ETA

    View Slide

  30. Generating a task’s ETA
    3. Calculate the area under the curve (and other measures).
    Time Taken
    Error Rate
    .10
    4s
    Effective Time

    View Slide

  31. Generating a task’s ETA
    3. Calculate the area under the curve (and other measures).
    = Effective Wage
    × Wage Rate
    Time Taken
    Error Rate
    .10
    4s
    Effective Time

    View Slide

  32. Example #1
    Time Taken
    Normalized Error Rate
    Choose from 4 options
    Brushing
    Applauding
    Drinking
    Climbing
    What is this
    person doing?
    1s 2s 3s 4s 5s
    1.0
    .50
    ETA=3.5

    Eff. Time=2.4s

    Eff. Wage=1¢

    View Slide

  33. Example #2
    Time Taken
    Search for the answer
    In what year did
    California become a
    state?
    4s 8s 12s 16s 20s
    1.0
    .50
    ETA=11.7

    Eff. Time=16s

    Eff. Wage=7¢
    185
    Normalized Error Rate

    View Slide

  34. ETA can be
    computed with as
    few as 8 workers.
    For a 2¢ task, ETA
    costs less than $5.

    View Slide

  35. ETA vs.
    other measures of
    effort

    View Slide

  36. How well can ETA
    (or other measures)
    predict task effort?

    View Slide

  37. Task A
    Task C
    Task B
    Task D
    Task E

    View Slide

  38. Task A
    Task C
    Task B
    Task D
    Task E
    More
    difficult
    Gold-standard

    View Slide

  39. Task A
    Task C
    Task B
    Task D
    Task E
    Task C
    Task A
    Task B
    Task D
    Task E
    Gold-standard Measure X
    More
    difficult

    View Slide

  40. We compute ten measures…
    ETA
    Effective Time
    Time Taken
    Estimated Time Rel. Subj. Dur.
    Error Rate
    NASA TLX
    Market Price
    Estimated Cost
    Subjective Rank
    ×
    7.24s
    2 s Actual Est. Time
    Actual Time Taken
    How demanding?
    1 11
    15 ¢
    A B C
    > >

    View Slide

  41. We compute ten measures…
    ETA
    Effective Time
    Time Taken
    Estimated Time Rel. Subj. Dur.
    Error Rate
    NASA TLX
    Market Price
    Estimated Cost
    Subjective Rank
    ×
    7.24s
    2 s Actual Est. Time
    Actual Time Taken
    How demanding?
    1 11
    15 ¢
    A B C
    > >

    View Slide

  42. We compute ten measures…
    ETA
    Effective Time
    Time Taken
    Estimated Time Rel. Subj. Dur.
    Error Rate
    NASA TLX
    Market Price
    Estimated Cost
    Subjective Rank
    ×
    7.24s
    2 s Actual Est. Time
    Actual Time Taken
    How demanding?
    1 11
    15 ¢
    A B C
    > >

    View Slide

  43. We compute ten measures…
    ETA
    Effective Time
    Time Taken
    Estimated Time Rel. Subj. Dur.
    Error Rate
    NASA TLX
    Market Price
    Estimated Cost
    Subjective Rank
    ×
    7.24s
    2 s Actual Est. Time
    Actual Time Taken
    How demanding?
    1 11
    15 ¢
    A B C
    > >

    View Slide

  44. We compute ten measures…
    ETA
    Effective Time
    Time Taken
    Estimated Time Rel. Subj. Dur.
    Error Rate
    NASA TLX
    Market Price
    Estimated Cost
    Subjective Rank
    ×
    7.24s
    2 s Actual Est. Time
    Actual Time Taken
    How demanding?
    1 11
    15 ¢
    A B C
    > >

    View Slide

  45. We compute ten measures…
    ETA
    Effective Time
    Time Taken
    Estimated Time Rel. Subj. Dur.
    Error Rate
    NASA TLX
    Market Price
    Estimated Cost
    Subjective Rank
    ×
    7.24s
    2 s Actual Est. Time
    Actual Time Taken
    How demanding?
    1 11
    15 ¢
    A B C
    > >

    View Slide

  46. …on ten common tasks.
    Binary Choice Scaled Choice Categorization Description Tagging
    Finding Errors Fixing Errors Transcription Addition Search
    True
    False
    A
    B
    C
    D
    Strongly Agree
    Strongly Disagree
    Neutral
    Agree
    Disagree
    apple
    a person is

    standing
    this paer is juicy
    pear
    this paer is juicy
    1 2 3 4
    2
    tiny green pear
    tiny gree
    1.68 + 0.74 = ?
    2.4
    What year did

    California become

    a state?
    185

    View Slide

  47. 10 measures
    10 tasks
    8 time conditions
    60 workers

    View Slide

  48. Results
    ETA
    Binary Choice Scaled Choice Categorization Description Tagging
    3.9 4.3 7.6 4.9 11.7
    1.6 1.9 2.0 7.8 2.9
    Finding Errors Fixing Errors Transcription Addition Search

    View Slide

  49. Results in order of increasing ETA
    ETA
    Binary Choice Scaled Choice Categorization
    Description
    Tagging
    3.9
    4.3 7.6
    4.9 11.7
    1.6 1.9 2.0
    7.8
    2.9
    Finding Errors
    Fixing Errors Transcription
    Addition Search

    View Slide

  50. Results in order of increasing ETA
    ETA
    (6) (7) (8) (9) (10)
    (1) (2) (3) (4) (5)
    Binary Choice Scaled Choice Categorization
    Description
    Tagging
    3.9
    4.3 7.6
    4.9 11.7
    1.6 1.9 2.0
    7.8
    2.9
    Finding Errors
    Fixing Errors Transcription
    Addition Search

    View Slide

  51. Comparing to subjective rank
    ETA
    Subjective Rank
    Binary Choice Scaled Choice Categorization Tagging Finding Errors
    1 2 3 4 6
    Binary Choice Scaled Choice Categorization Tagging Finding Errors
    (1) (2) (3) (4) (5)

    View Slide

  52. So how did each measure do?
    ETA
    Effective Time
    Time Taken
    Estimated Time Rel. Subj. Dur.
    Error Rate
    NASA TLX
    Market Price
    Estimated Cost
    Subjective Rank
    ×
    7.24s
    2 s Actual Est. Time
    Actual Time Taken
    How demanding?
    1 11
    15 ¢
    A B C
    > >
    1.0

    View Slide

  53. So how did each measure do?
    ETA
    Effective Time
    Time Taken
    Estimated Time Rel. Subj. Dur.
    Error Rate
    NASA TLX
    Market Price
    Estimated Cost
    Subjective Rank
    ×
    7.24s
    2 s Actual Est. Time
    Actual Time Taken
    How demanding?
    1 11
    15 ¢
    A B C
    > >
    1.0
    .87 .69 .66 .78
    .82 .29 .82 .78 .69

    View Slide

  54. So how did each measure do?
    ETA
    Effective Time
    Time Taken
    Estimated Time Rel. Subj. Dur.
    Error Rate
    NASA TLX
    Market Price
    Estimated Cost
    Subjective Rank
    ×
    7.24s
    2 s Actual Est. Time
    Actual Time Taken
    How demanding?
    1 11
    15 ¢
    A B C
    > >
    1.0
    .87 .69 .66 .78
    .82 .29 .82 .78 .69
    It’s relative.

    View Slide

  55. So how did each measure do?
    ETA
    Effective Time
    Time Taken
    Estimated Time Rel. Subj. Dur.
    Error Rate
    NASA TLX
    Market Price
    Estimated Cost
    Subjective Rank
    ×
    7.24s
    2 s Actual Est. Time
    Actual Time Taken
    How demanding?
    1 11
    15 ¢
    A B C
    > >
    1.0
    .87 .69 .66 .78
    .82 .29 .82 .78 .69
    Workers
    multitask.
    Rzeszotarski, J. M., and Kittur, A. UIST (2011)

    View Slide

  56. So how did each measure do?
    ETA
    Effective Time
    Time Taken
    Estimated Time Rel. Subj. Dur.
    Error Rate
    NASA TLX
    Market Price
    Estimated Cost
    Subjective Rank
    ×
    7.24s
    2 s Actual Est. Time
    Actual Time Taken
    How demanding?
    1 11
    15 ¢
    A B C
    > >
    1.0
    .87 .69 .66 .78
    .82 .29 .82 .78 .69
    Expensive;
    market is inelastic
    Toomim, M., et al. CHI (2011)

    View Slide

  57. So how did each measure do?
    ETA
    Effective Time
    Time Taken
    Estimated Time Rel. Subj. Dur.
    Error Rate
    NASA TLX
    Market Price
    Estimated Cost
    Subjective Rank
    ×
    7.24s
    2 s Actual Est. Time
    Actual Time Taken
    How demanding?
    1 11
    15 ¢
    A B C
    > >
    1.0
    .87 .69 .66 .78
    .82 .29 .82 .78 .69
    High
    variance
    DeLeeuw, K. E. and Mayer, R. E. J. Educ. Psychol. (2008) / Herlocker, J., et al. Inform. Retrieval (2002)

    View Slide

  58. Individually, hard to interpret
    Finding Errors
    0.13
    48

    6.1¢
    6
    3.9
    5.5s
    10.9s
    8s -0.13
    ETA
    Effective Time
    Time Taken
    Estimated Time Rel. Subj. Dur.
    Error Rate
    NASA TLX
    Market Price
    Estimated Cost
    Subjective Rank

    View Slide

  59. Individually, hard to interpret
    Finding Errors
    0.13
    48

    6.1¢
    6
    3.9
    5.5s
    10.9s
    8s -0.13
    ETA
    Effective Time
    Time Taken
    Estimated Time Rel. Subj. Dur.
    Error Rate
    NASA TLX
    Market Price
    Estimated Cost
    Subjective Rank

    View Slide

  60. ETA in Action

    View Slide

  61. People doing things.

    View Slide

  62. What’s the best
    way to label these
    images?

    View Slide

  63. Multiple Choice vs. Tagging
    Brushing
    Drinking
    Brushing
    Applauding
    Gardening
    Climbing
    Brushing
    Cooking
    Applauding
    Drinking
    Climbing
    Rowing
    Fishing
    Jumping
    Gardening
    Cleaning
    Writing
    Waving
    Typing
    Reading
    Phoning
    Swimming
    Brushing
    Cooking
    Applauding
    Drinking
    Climbing
    Rowing
    Fishing
    Jumping
    2 Choices 4 Choices 8 Choices 16 Choices Tagging
    What is this
    person doing?
    runnin

    View Slide

  64. View Slide

  65. Effort increases with choices*
    2 Choices 4 Choices 8 Choices 16 Choices Tagging
    ETA
    1.6 1.8 2.5 3.2 3.1
    2 Choices 4 Choices 8 Choices 16 Choices Tagging
    Effective Time
    2.3 2.5 3.6 5.0 4.2

    View Slide

  66. Effort increases with choices*
    2 Choices 4 Choices 8 Choices 16 Choices Tagging
    ETA
    1.6 1.8 2.5 3.2 3.1
    2 Choices 4 Choices 8 Choices 16 Choices Tagging
    Effective Time
    2.3 2.5 3.6 5.0 4.2
    But tagging is less
    work than picking
    from 16 choices!
    *

    View Slide

  67. Also in the paper…
    1 Computing ETA without ground truth
    Measuring the perceptual cost of a task
    2
    Complete experimental results
    3

    View Slide

  68. ETA can effectively
    capture task effort
    to inform task
    design and pricing.

    View Slide

  69. ETA can effectively
    capture task effort
    to inform task
    design and pricing.

    (Minimal effort required.)

    View Slide

  70. http://hci.st/eta

    View Slide

  71. Justin Cheng @jcccf / Stanford
    Jaime Teevan @jteevan / Microsoft Research
    Michael Bernstein @msbernst / Stanford
    Error-Time Curves
    Measuring Crowdsourcing Effort with
    http://hci.st/eta

    View Slide