the stuff between loading data and formal analysis is “exploratory” • This includes – Visualization – Checks for data completeness and reliability – Quantification of centrality and variability – Initial evaluation of hypotheses – Hypothesis generation Exploratory data analysis
you as an analyst – True for you as a communicator • You should make dozens, maybe even hundreds, of graphics for each dataset – Most of these are for your eyes only – A small subset are for others A picture is worth 1000 words
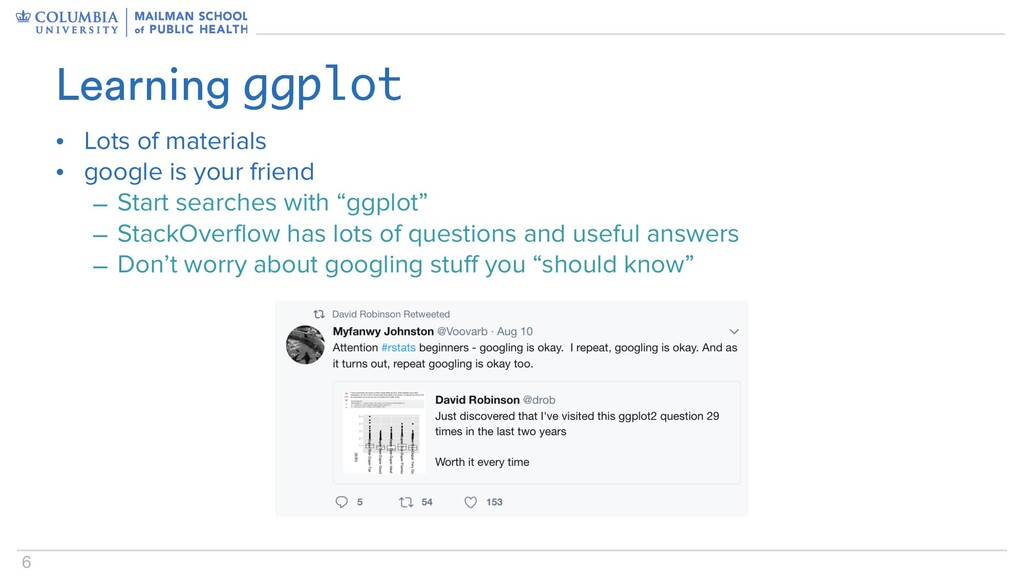
– Start searches with “ggplot” – StackOverflow has lots of questions and useful answers – Don’t worry about googling stuff you “should know” Learning ggplot
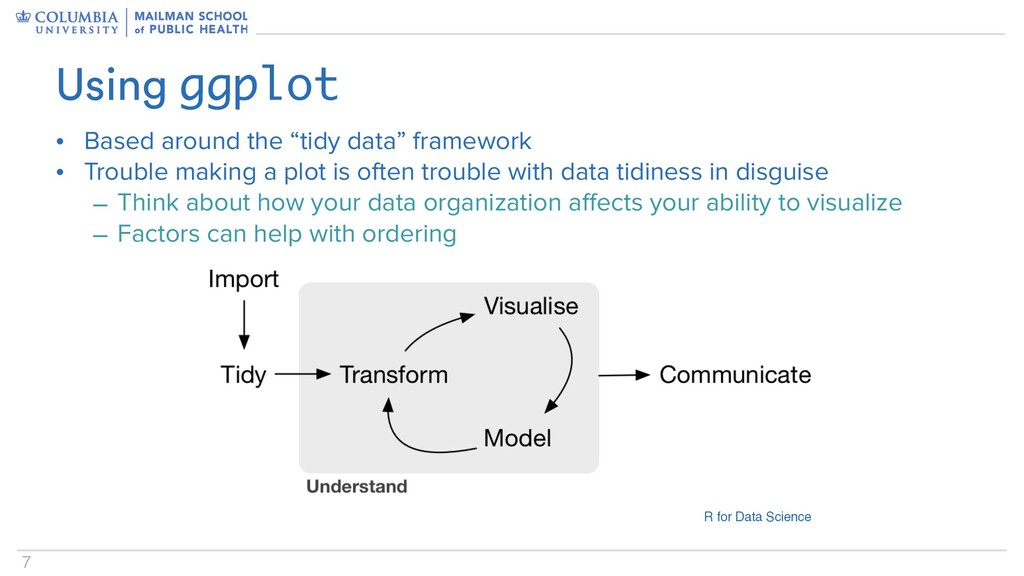
making a plot is often trouble with data tidiness in disguise – Think about how your data organization affects your ability to visualize – Factors can help with ordering Using ggplot R for Data Science
– geoms • Advanced graph components – facets – scales – statistics • A graph is built by combining these components • Components are consistent across graph types – Scatterplots, bar graphs, density plots, ridge plots … Using ggplot