student from Dublin, Ireland. • I entered my Project “The Vibes of Ireland” into the BT Young Scientist and Technology Exhibition 2011, it won it’s category. • Read online at thevibesofrireland.com. • Over the summer I’ve been working at CLARITY: Centre for Sensor Web Technologies.
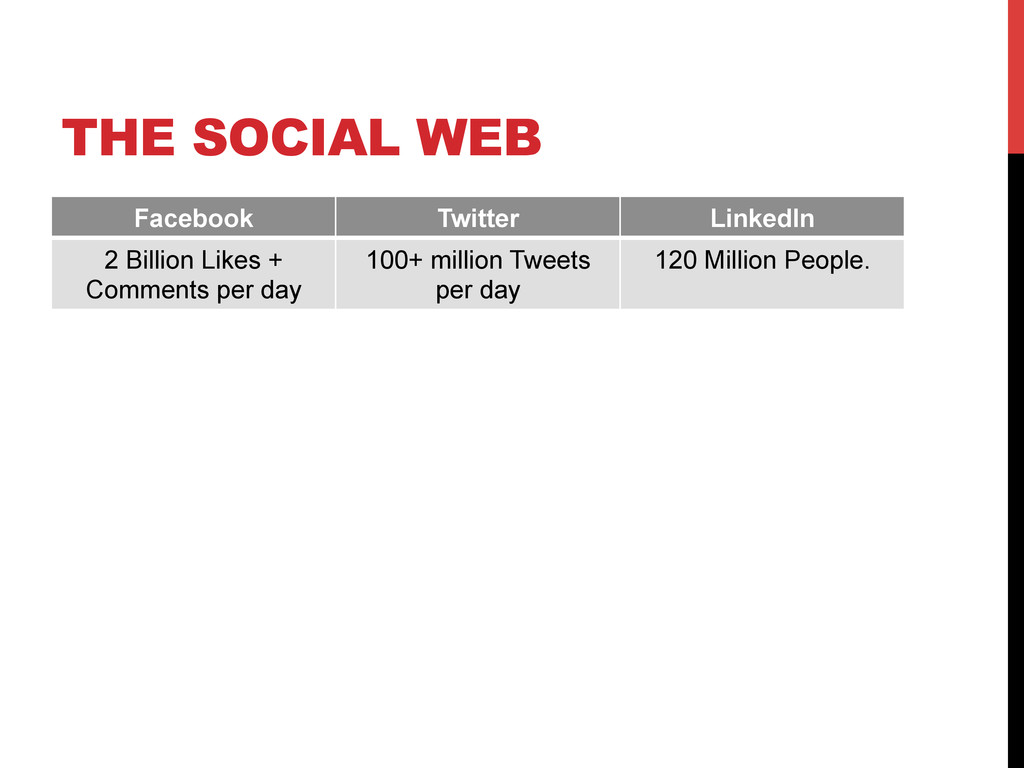
interaction, using highly accessible and scalable publishing techniques.” • Creation and exchange of user-generated content. • Rapid spread of information. • Ability to reach a massive audience • Facebook – 700 Million Active Users. • Twitter – 100 Million Active Users. • LinkedIn – 100 Million Active Users.
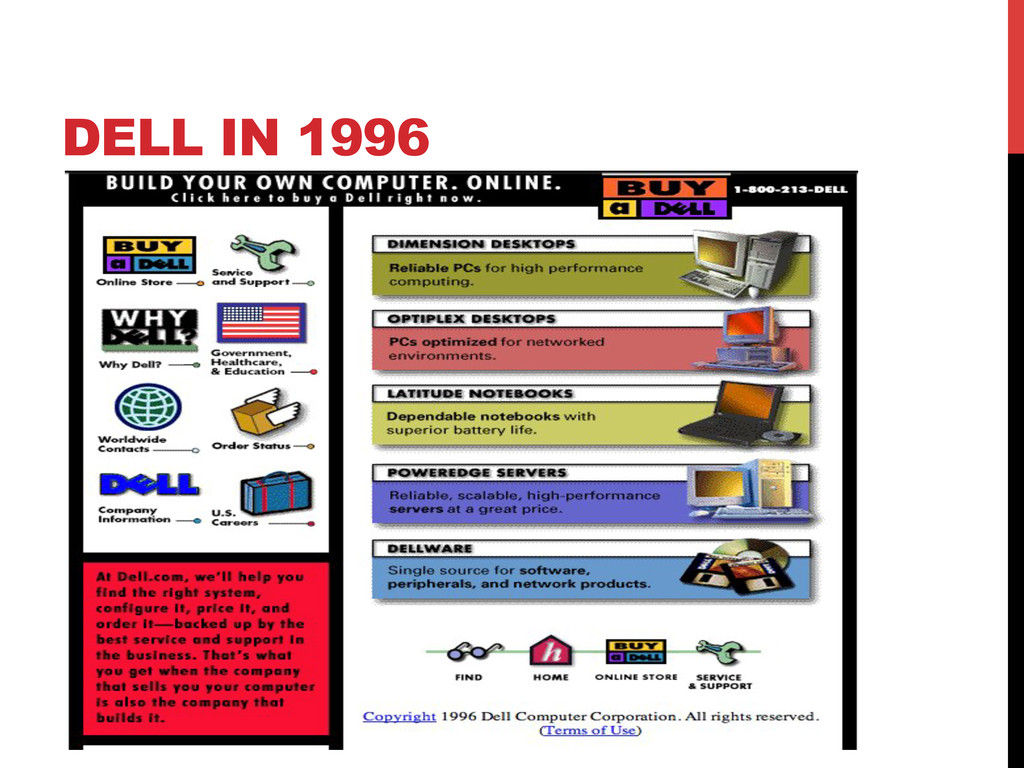
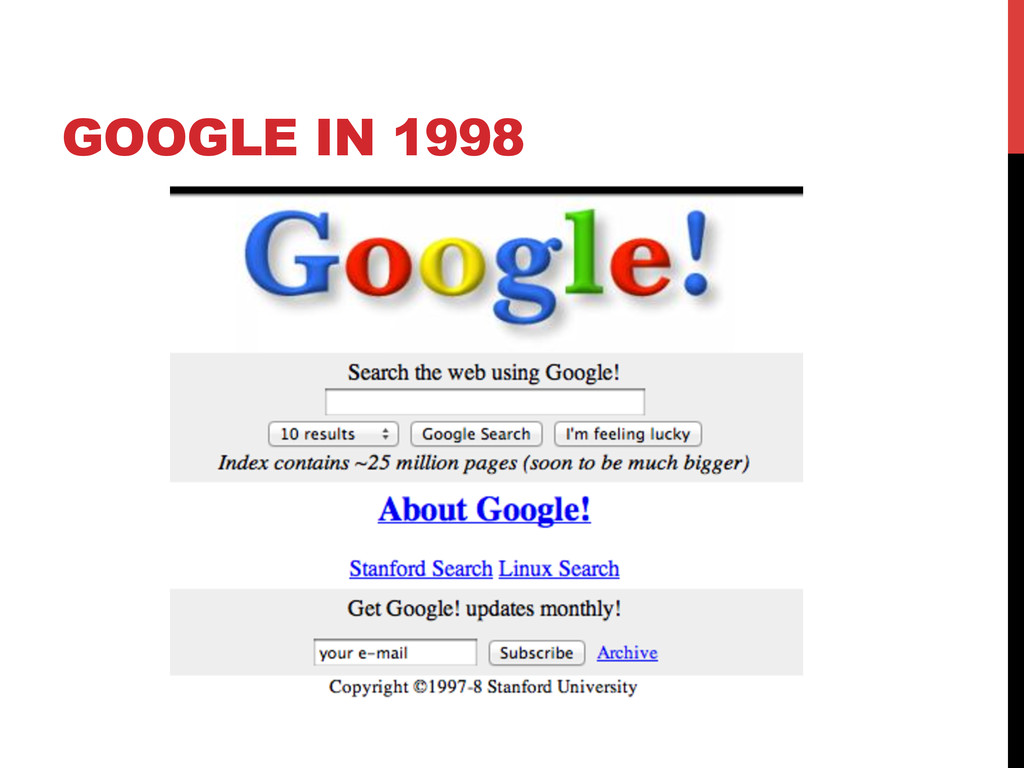
Websites were always the same, rarely changed. • Information was stagnant and outdated. • No real time information • No Social Networks • By 1991 traffic on the early Internet was 930 GB /month.
web becomes more real-time used more widely. • Facebook setup in 2004 which sets the stage for massive amounts of social information moving across the internet. • Imagine it like an Information super-highway.
+ easily available to everybody (almost). • Massive datasets full of information to be accessed and analysed. • Many avenues of analytics on this data yet to be explored + many ongoing creative experiments.
Twitter. • Collectively these people create 200 million Tweets /day. • Each Tweet contains meta information (location, time, name of people mentioned in Tweet, info about user account etc). • Accessing 2-3% of these tweets is free. • Data from Twitter is widely used in research and statistical projects – it’s proven to work well. • Experiments such as predicting the stocks have proven very possible with twitter data.
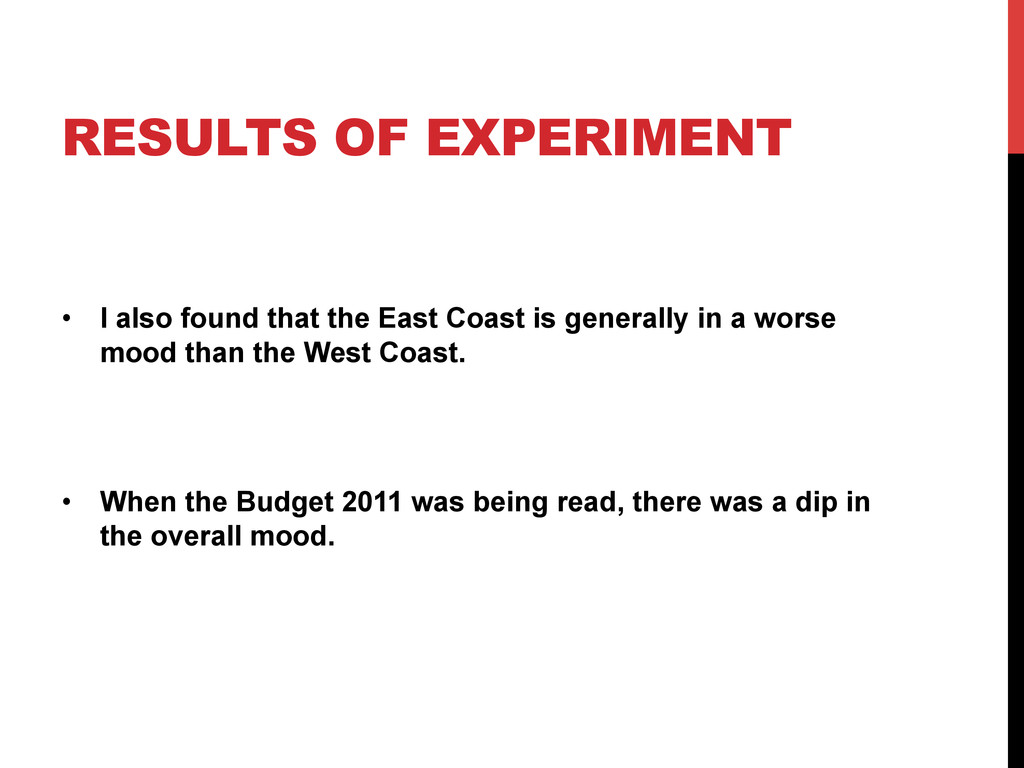
counties in Ireland over a 4 month period. (September – December 2011) • Mood was derived from the ratio of “happy tweets” to “sad tweets”. • A tweet is a “happy” tweet if it the polarity1 of the majority of words is positive. • A tweet is a “sad” tweet if the polarity1 of the majority of words is negative. • With Real-time mood tracking I was able to correlate sudden changes in sentiment in a county to a news story. • E.g. Tyrone was unhappy for almost a week due to that woman’s death on her honeymoon. 1 Polarity is the overall mood or sentiment of a particular word.
data miner that is capable of downloading about 100,000 Tweets per day. 1. This miner was built using a language called PHP. 2. All 4 million tweets were grouped into the counties that they originated from. 3. I built an algorithm that differentiates between positive and negative tweets.
of Tweets • Used the Subjectivity Lexicon (courtesy of the University of Pittsburg) • Had 2000 words tagged as positive, negative or neutral. • Algorithm attempted to understand whole sentence, not just individual words. • E.g. “I am not happy” is a sad Tweet, “not” changes the meaning of the sentence. A bad algorithm would take that sentence as being a happy tweet.
of Tweets • Various identifiers can be used to teach the computer about a sentence. • E.g. if a word ends in “ing” it is most likely a verb. • E.g. if a word is preceded by a “a” is is likely a noun. • You could go on forever adding grammatical rules (see Machine Learning techniques).
was the icing on the cake for this project. • I had a map of Ireland with each county changing from shades of red to shades of green depending on the happiness/sadness of each county. • The average mood was also constantly being plotted on a graph so the past 6 hours of mood changes for each county could also be view too.
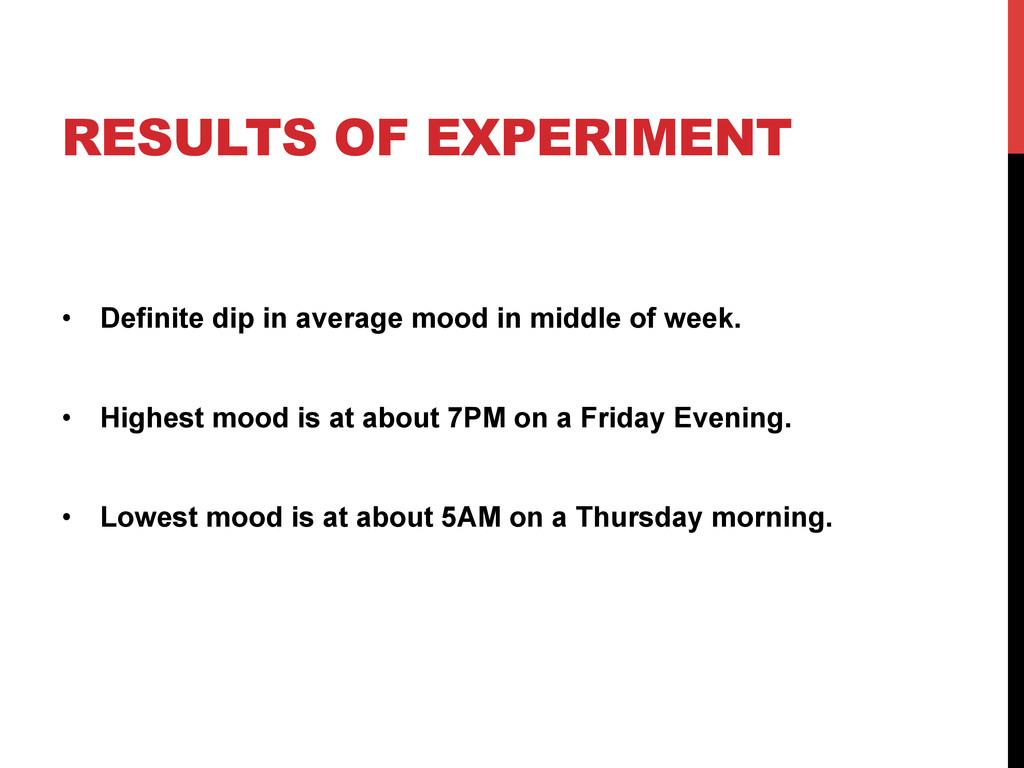
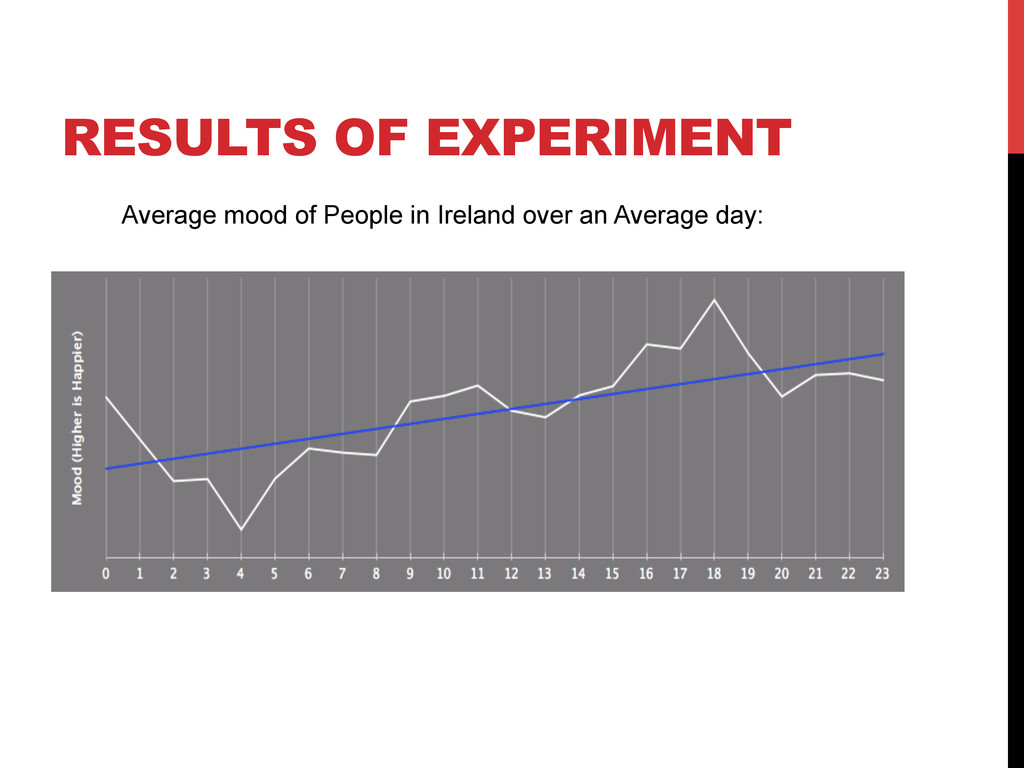
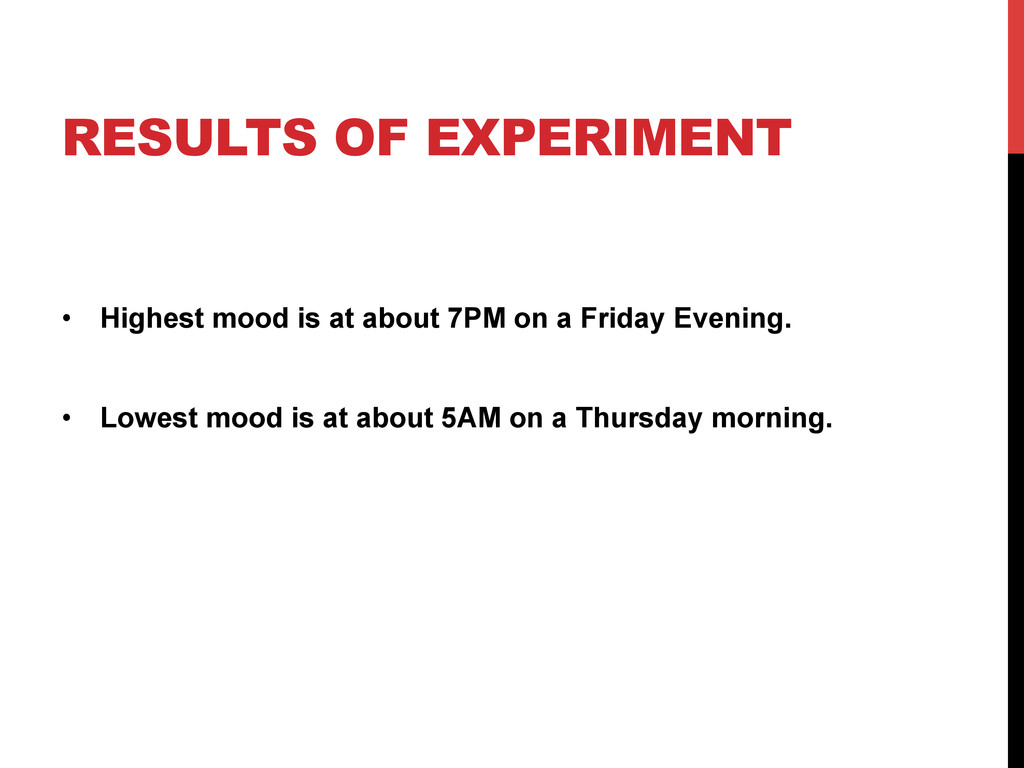
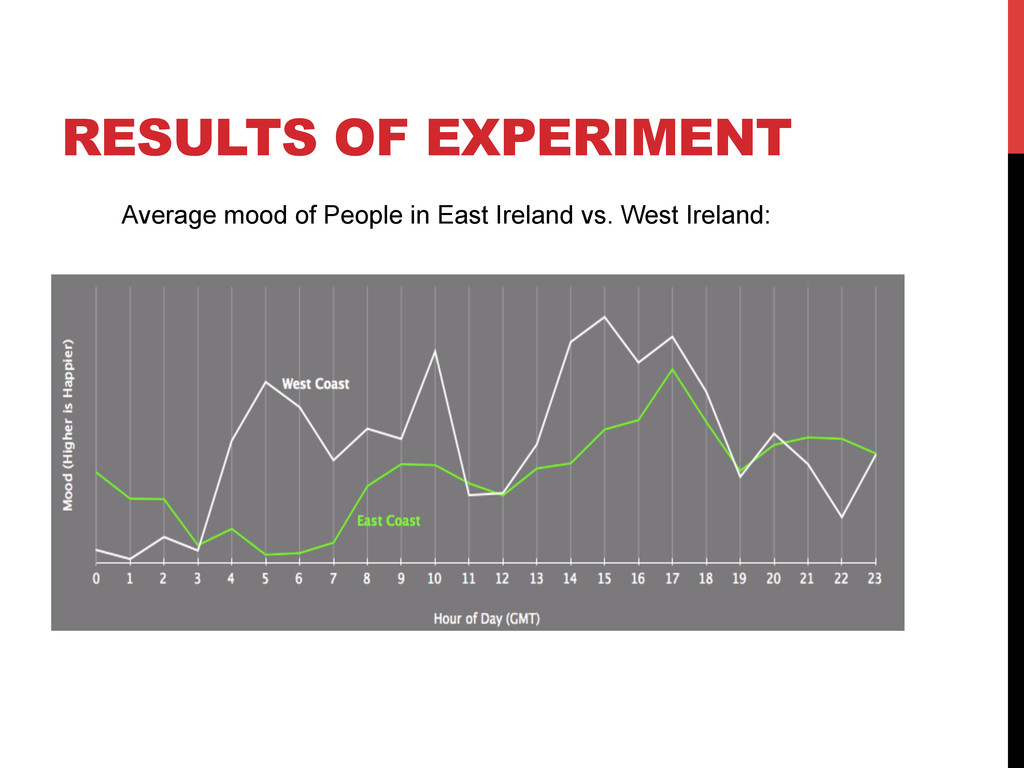
evening, and least happy early on a Thursday morning. • There is a definite dip in the mood during the middle of the week. • On an average day, people are happiest at about 18:00 (6pm) and least happy early in the morning 04:00 – 08:00.
Johan Bollen, Huina Mao, and Xiao-Jun Zeng at Cornell University. • Measuring how calm People on Twitter are on a given day they can foretell the direction of the Dow Jons Ind Avg 3 days later with accuracy of 86.7%.
like a psychiatric patient,” Bollen said. “This allows us to measure the mood of the public over these six different mood states.” • Found that the ‘calm’ emotion matched up with the stock market movements.
data from Twitter and Facebook in statistics makes for some very interesting results. • What people say on handwritten forms and surveys is different to what they might say online. Twitter and Facebook could be used in conjunction with data from a handwritten survey to add an extra dimension to the results.
prove a point, try using Twitter to help. • Imagine a situation where you see that the number of robberies in Ireland has gone up in the past 2-3 years, you could use Twitter data to find that Irish people are indeed talking about robberies x% of the time.
Media can influence statistics heavily. • Relatively untapped gold mine of information in Facebook, Twitter, LinkedIn etc. • Hard Facts (surveys, census etc) can be married up with data from Twitter to make for more interesting and persuasive results.
![THANKS! Any Questions? [email protected]](https://files.speakerdeck.com/presentations/4f2092029d9fe60022010bf9/slide_28.jpg)