& EMC “Data-Hero” award. • I made “Better Examinations.ie” which won an Irish Web Award. • Spoken at the Dublin Web Summit on the Main Stage, & at the Central Statistics office re: data.
real-time used more widely. • Facebook setup in 2004 which sets the stage for massive amounts of social information moving across the internet. • Imagine it like an Information super- highway.
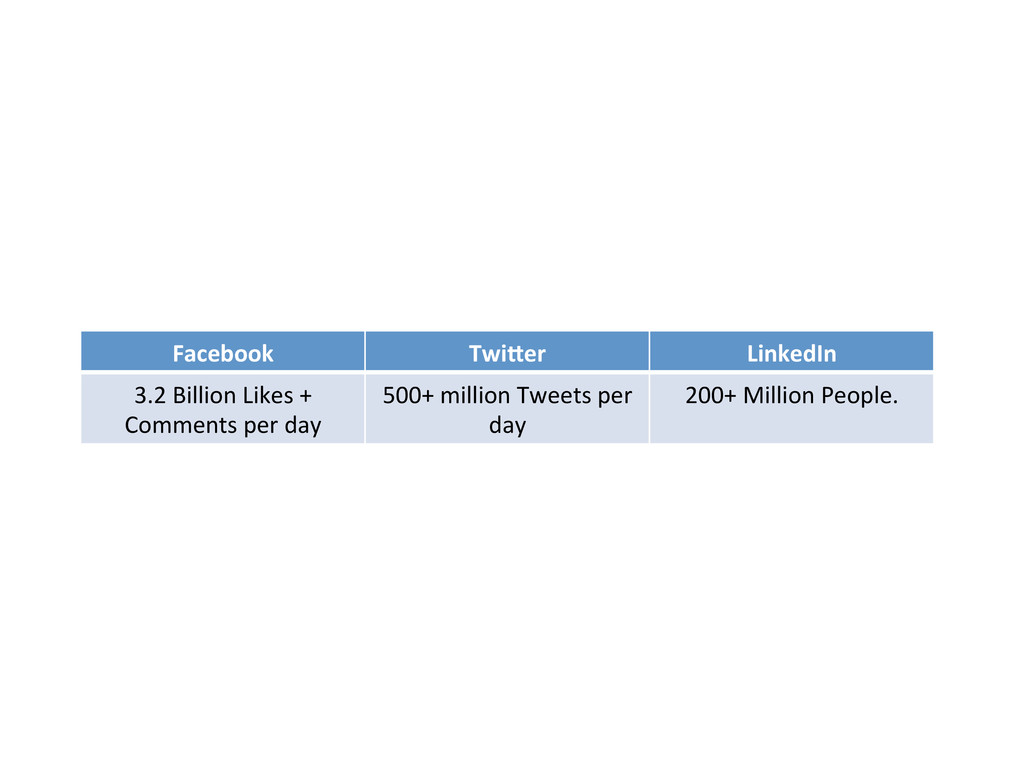
to everybody (almost). • Massive datasets full of information to be accessed and analysed. • Many avenues of analytics on this data yet to be explored + many ongoing creative experiments.
people create 500 million Tweets /day. • Each Tweet contains meta information (location, time, name of people mentioned in Tweet, info about user account etc). • Accessing 2-3% of these tweets is free. • Data from Twitter is widely used in research and statistical projects – it’s proven to work well. • Experiments such as predicting the stocks have proven very possible with twitter data.
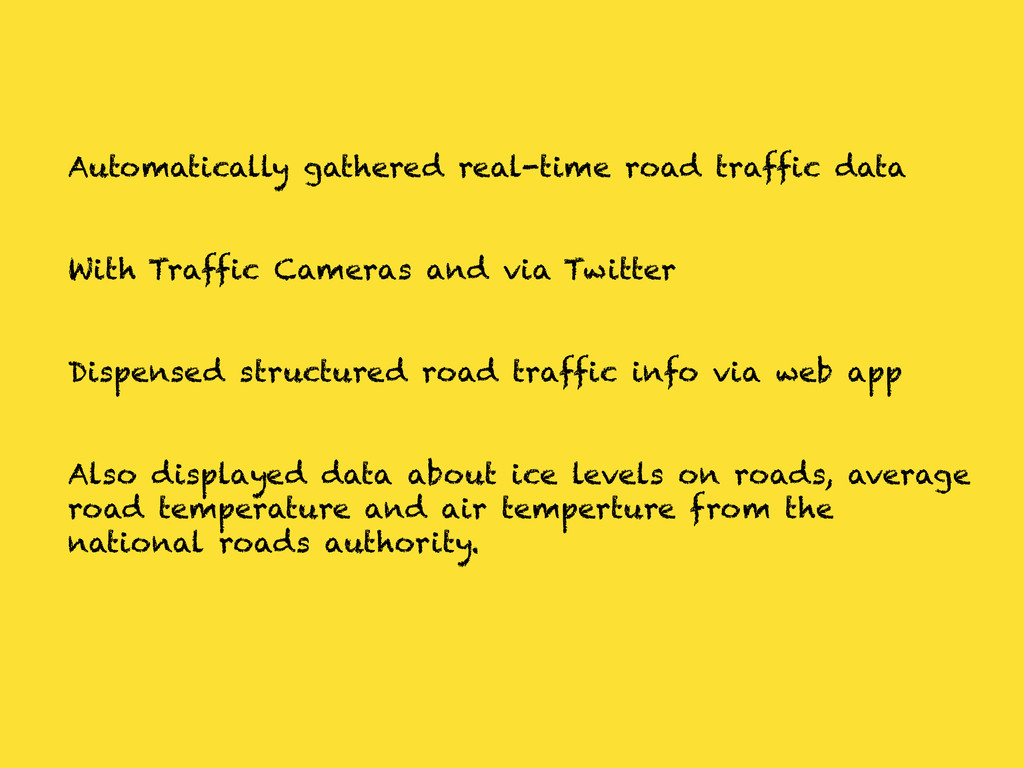
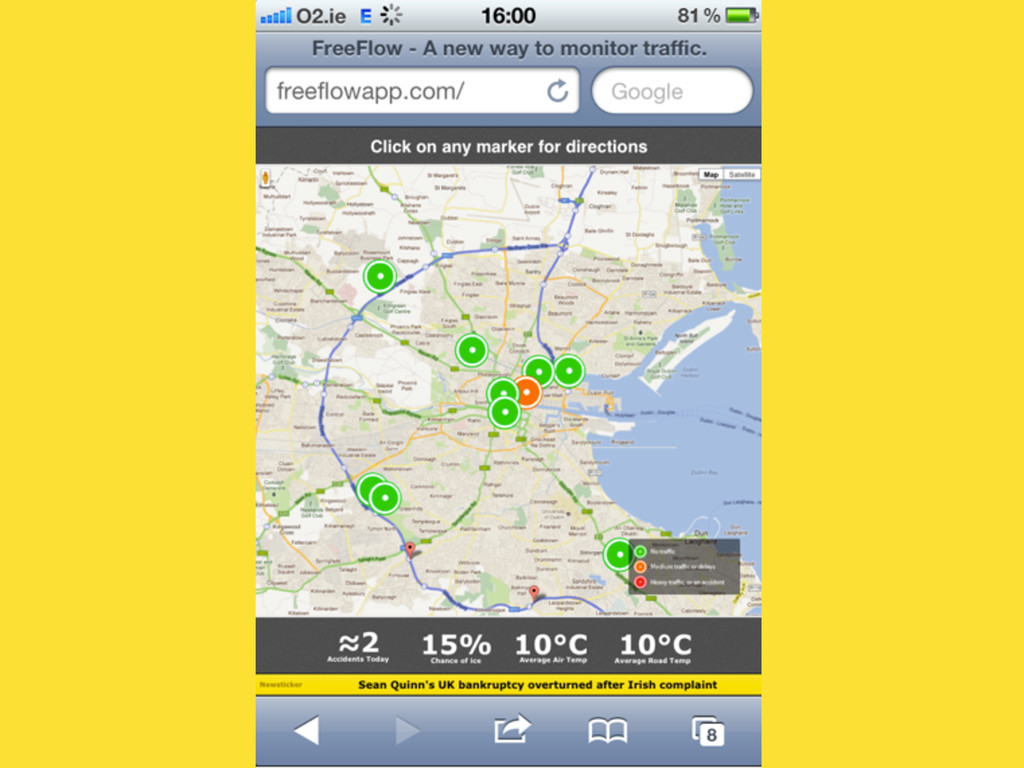
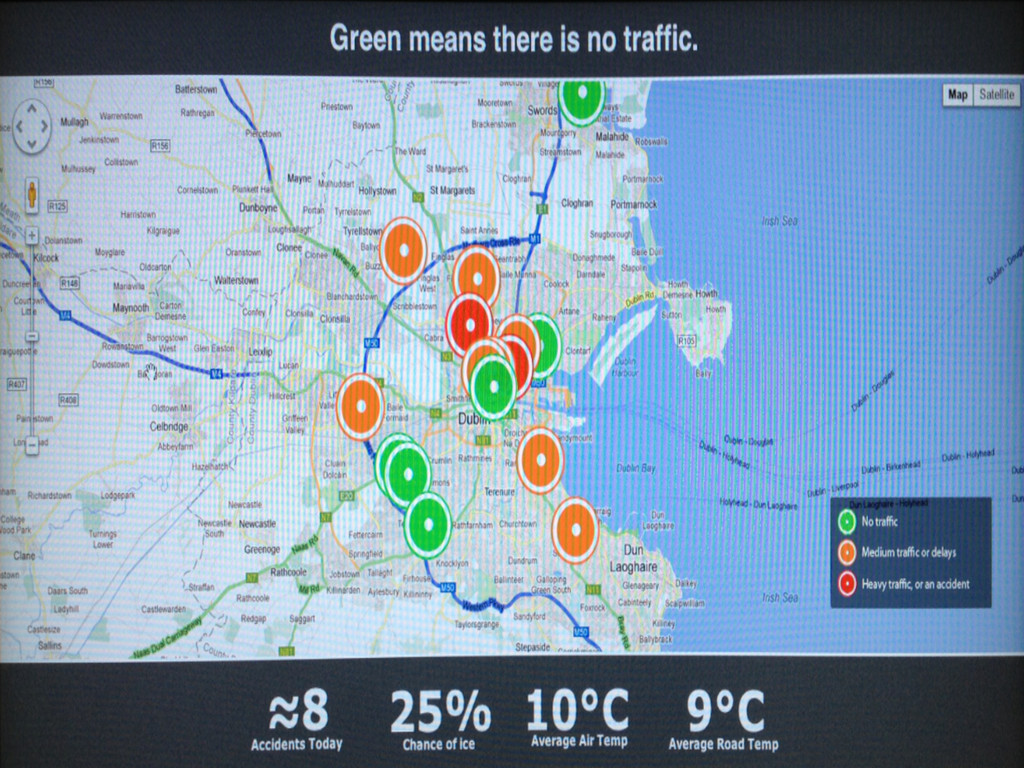
via Twitter Dispensed structured road traffic info via web app Also displayed data about ice levels on roads, average road temperature and air temperture from the national roads authority.
via Twitter Dispensed structured road traffic info via web app Also displayed data about ice levels on roads, average road temperature and air temperture from the national roads authority.
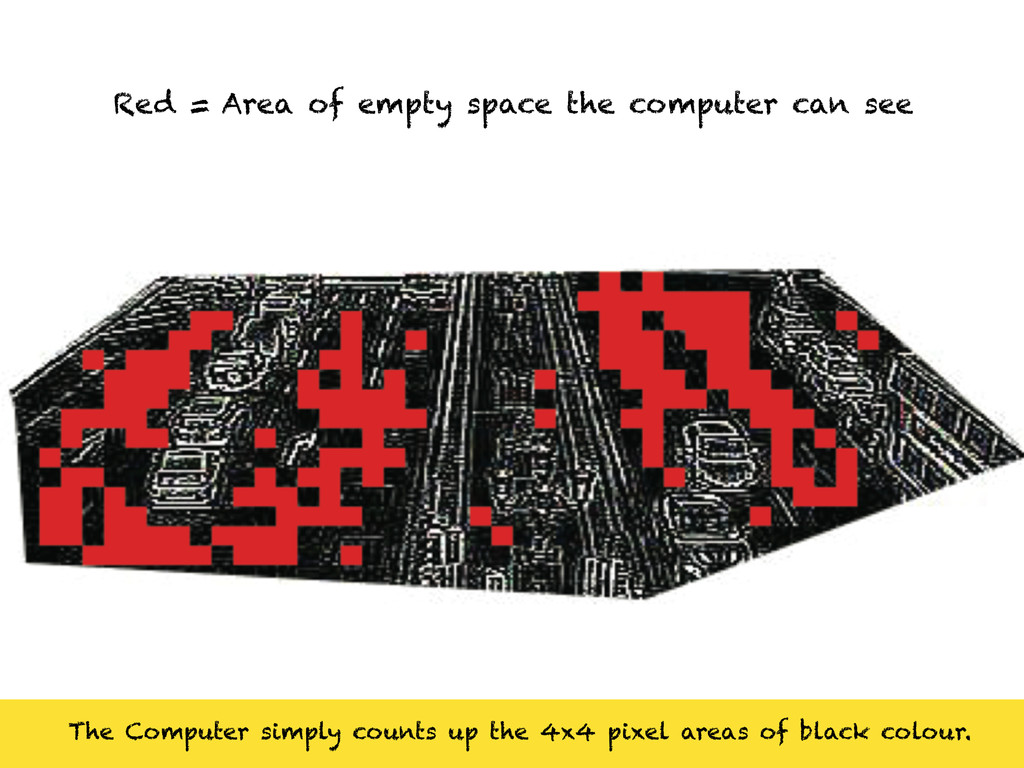
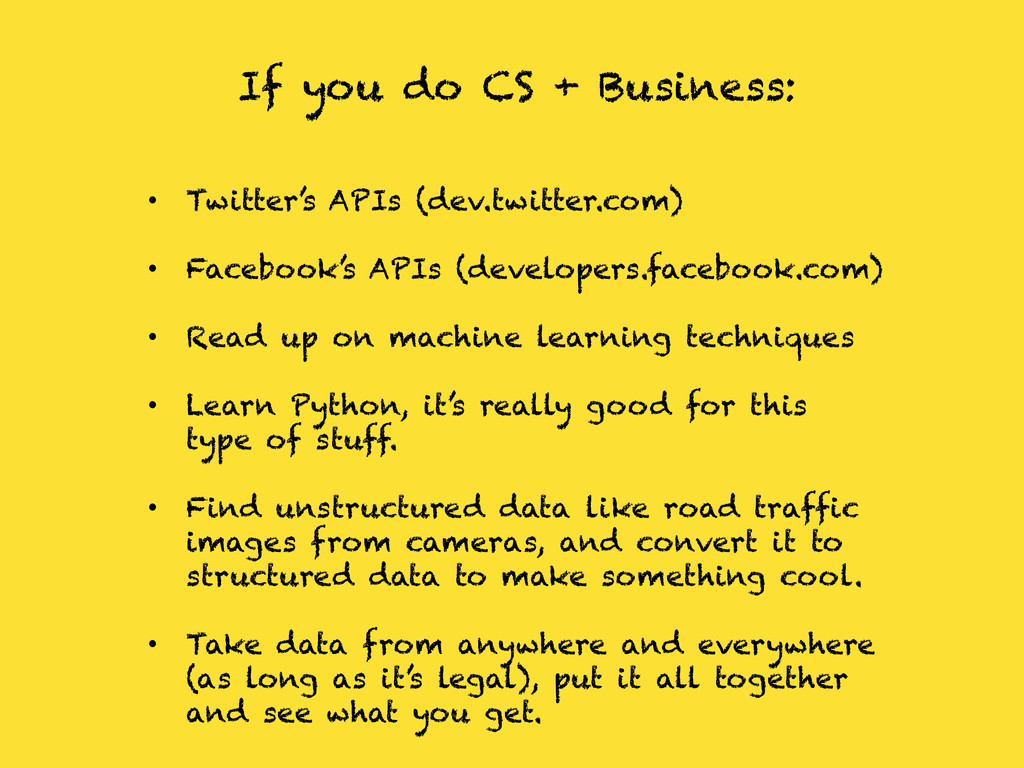
• Facebook’s APIs (developers.facebook.com) • Read up on machine learning techniques • Learn Python, it’s really good for this type of stuff. • Find unstructured data like road traffic images from cameras, and convert it to structured data to make something cool. • Take data from anywhere and everywhere (as long as it’s legal), put it all together and see what you get.