Upgrade to Pro — share decks privately, control downloads, hide ads and more …

X-Ray Diffraction - Master 2 SMNO Nanomat

jelledionot
December 09, 2011

X-Ray Diffraction - Master 2 SMNO Nanomat

jelledionot

December 09, 2011
Tweet

More Decks by jelledionot

Other Decks in Education

Transcript

  1. X-Ray diffraction Report written by Jelle Dionot Practical done with

    Marcel Br¨ andlein under the supervision of Gwenaelle Rousse Universit´ e Pierre et Marie Curie Institut de min´ eralogie et de physique des milieux condens´ es Nanomat Master Program – Group 2 Friday, December 2nd & 9th 2011
  2. Contents Introduction 1 1 Basic principles 1 1.1 Theoretical background:

    X-Ray diffraction . . . . . . . . . . . . . . . . . . 1 1.2 Experimental aspects . . . . . . . . . . . . . . . . . . . . . . . . . . . . . . 2 2 Results an discussions 3 2.1 Debye-Scherrer diffraction . . . . . . . . . . . . . . . . . . . . . . . . . . . 3 2.2 Laue diffraction . . . . . . . . . . . . . . . . . . . . . . . . . . . . . . . . . 5 2.3 Bragg-Brentano diffraction . . . . . . . . . . . . . . . . . . . . . . . . . . . 6 Conclusion 9 Appendix 10
  3. Introduction X-Ray diffraction among all the X-Ray scattering techniques might

    be one of the old- est and yet most widely used technique to investigate the crystallographic structure of crystalline materials. It is originally in 1912 that Max von Laue, as well as William H. and William L. Bragg who were all three awarded a Nobel prize the following years, explained the crystalline structures as based in periodical arrangements of atoms when obtaining diffraction patterns when shining crystals with X-Ray light. After a hundred years of development, X-Ray diffraction became a state-of-the-art technique used to study single-crystals as well as powder of crystallites. After presenting the basic principles of the technique and the various methods used to obtain diffraction patterns, we present our results of diffraction of, on the one hand a grenat Ca3 Al2 (SiO4 )3 single-crystal, and on the other hand Si, InP, BaTiO3 and LiMn2 O4 powder samples, together with descriptions of their crystallographic structures, based on symmetry and group theory for the former and on computer-assisted simulations for the latter more complicated systems. 1 Basic principles 1.1 Theoretical background: X-Ray diffraction In the Bragg formulation of X-Ray diffraction, an incident radiation is reflected from parallel planes of atoms in the crystal. When the reflected waves interfere constructively, a diffracted beam is obtained. For a given wavelength λ and angle of incident light θ, constructive interferences of order n and the subsequent diffracted beams are obtained if the distance d between the parallel planes follows the so called Bragg law: nλ = 2d sin θ (1) This result based on a geometrical construction can be recovered more rigorously thanks to the description of light as propagating waves. An incident plane wave of wavevector ki is scattered by an atom, more specifically by the electron density of an atom and the outgoing wave is collected by a detector as a plane wave of wavevector ks . The scattering is considered to be elastic (zero transfer of energy) and one notes q the scattering vector defined as q = ks − ki . The scattering amplitude of an atom distant of r from another one is therefore proportional to e−iq·r. Considering now the atoms j at the lattice points rj , identified by an atomic form factor fj (q), in a unit cell indicated by position ruc , the scattering contribution of all these atoms in the direction ks reads: A(q) = κ N j fj (q) e−iq(r+ruc+rj) = κ e−iq·r e−iq·ruc N j fj (q) e−iq·rj = κ e−iq·r e−iq·ruc S(q) with S(q) = N j fj (q) e−iq·rj (2) The function S(q) defined in equation 2 is the so-called structure factor. It contains all the phase factors associated with the position j of the atoms in the unit cell, that is all the information about the structure of that unit cell, their position as well as their type given the form factors fj (q). The scattering amplitude of a crystal (or a powder 1
  4. made of crystallites) is the coherent sum of all the

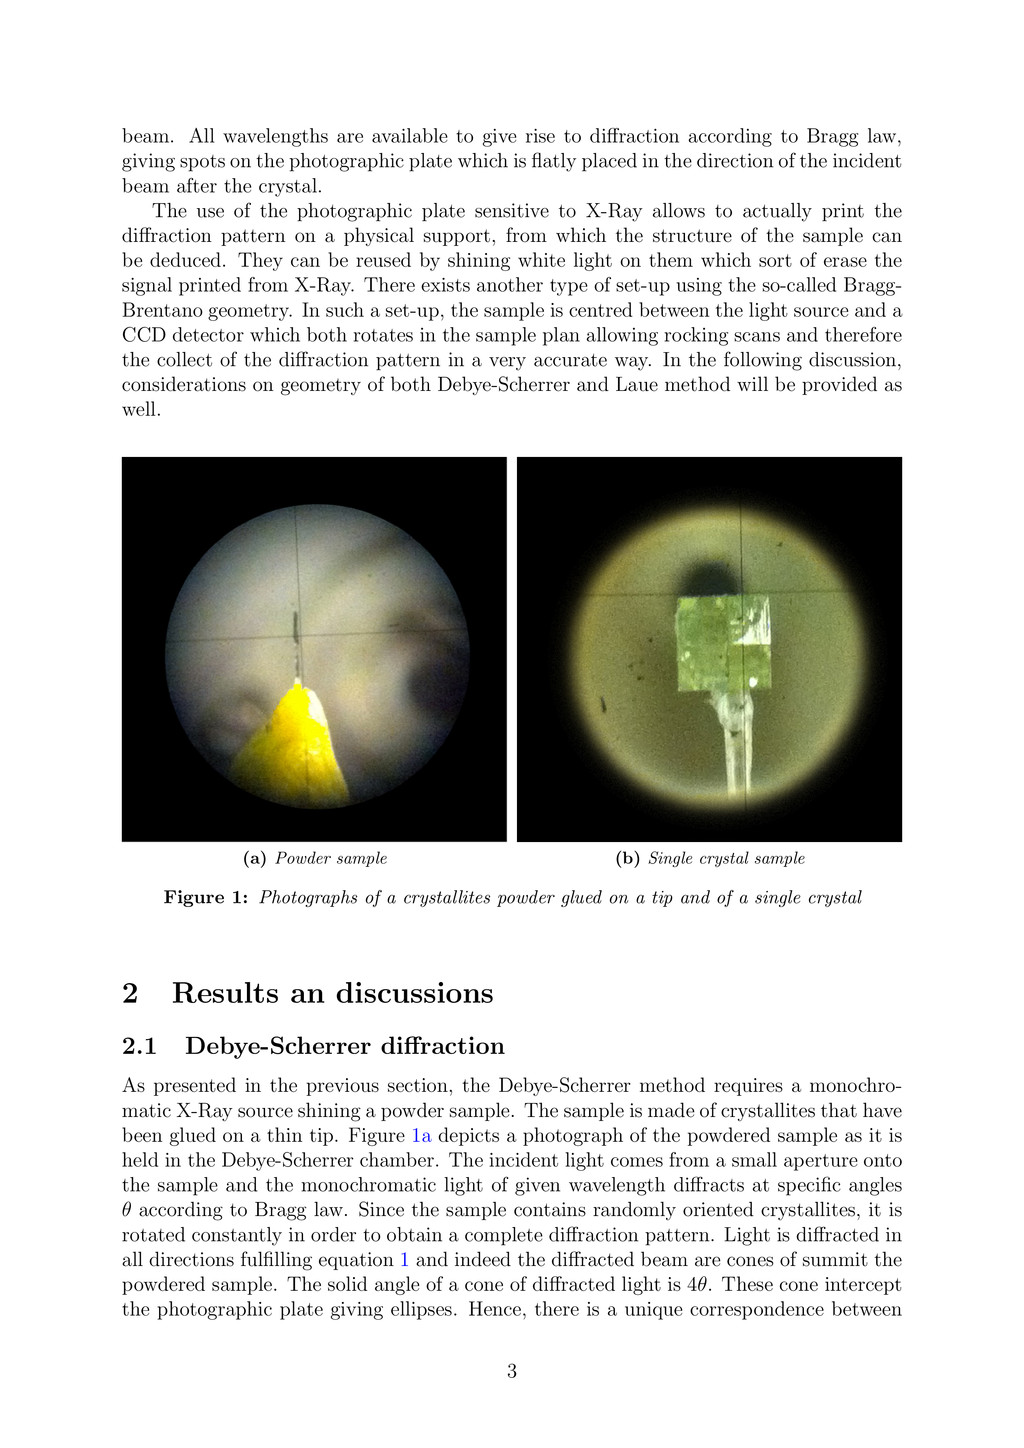
    scattering amplitudes of the unit cells. Therefore, the important varying part of the scattering amplitude is the structure factor S(q). It reaches a maximum for all integer p such that q · rj = 2pπ, which is indeed equivalent to the condition q = G, where G represents any reciprocal lattice vectors. Equivalently, in Fourier space, each of these vectors stands for a family of parallel planes of Miller indices h, k, l in direct space. This result is known as the Laue condition and is indeed equivalent to the Bragg formulation recalled in equation 1. The planes (hkl) reflect an incident beam if λ and θ satisfy the above equation. One briefly recalls that Ghkl is a vector of the reciprocal lattice where h, k and l are its integer coordinates in the reciprocal basis of unit vectors {bi }i=1,2,3 defined as ai · bj = 2πδij where {ai }i=1,2,3 represents the direct lattice basis vectors. Together with the above criteria and definitions, the structure factor can be indexed with the h, k, l indices and now reads: Shkl = j fj e−2iπ(hxj+kyj+lzj) (3) In a diffraction experiment, the complex-valued amplitude A of a scattered wave, as given in equation 2, can not be measured, but only the real-valued intensity I which is defined as the square modulus of the amplitude. Therefore, the intensity is directly related to the structure of the crystal since it is directly proportional to |Shkl |2. 1.2 Experimental aspects The main machinery required to perform X-Ray diffraction consists in an X-Ray source, a sample to be analyse, which is held by a sample holder, and an analyser. A laboratory X-Ray source usually consists in a lamp with a heated tungsten filament which emits electrons onto, usually, copper inducing core-level transitions, namely KLL. The induced emissions are characteristic of the chosen excited metal, here being copper. The discrete Kα and Kβ emission lines can be used, as well as the continuous emission light called bremsstrahlung. This light is then directed to a sample and a diffraction pattern can be collected. Our experiments focus on two types of materials: crystal powders and a single crystal. Both study requires a distinct X-Ray diffraction method. The study of crystal powders uses Debye-Scherrer method while single crystal diffraction is performed by Laue method. In the first case, the discrete emission lines of copper are used as X-Ray source, more precisely the more intense and higher energetic Kα , since the lower energetic one is usually cut thanks to a nickel foil acting as a filter. The powdered sample is rotated in order to not privilege any orientation of the crystallites. In practice, the powdered sample consists in powder glued on a tip bound to a rotative holder, as depicted in figure 1a. It is important for the tip to be aligned with the rotational axis in order to avoid any tilting and thus loosing the focus of the incident beam on the sample. The diffraction beam is collected on a photographic plate. The sample is held in the center of a cylindrical chamber called the Debye-Scherrer chamber, which contains the photographic plate bent along the inner side of the chamber, in the direction of the diffracted beam. The Laue method uses the polychromatic spectrum which contains a continuous set of wavelengths that can fulfil Bragg law as in equation 1 and thus give information on the probed structure. The sample is a monocrystal as shown in figure 1b and its orientation with respect to the incident beam is of primary importance for the obtained diffracted 2
  5. beam. All wavelengths are available to give rise to diffraction

    according to Bragg law, giving spots on the photographic plate which is flatly placed in the direction of the incident beam after the crystal. The use of the photographic plate sensitive to X-Ray allows to actually print the diffraction pattern on a physical support, from which the structure of the sample can be deduced. They can be reused by shining white light on them which sort of erase the signal printed from X-Ray. There exists another type of set-up using the so-called Bragg- Brentano geometry. In such a set-up, the sample is centred between the light source and a CCD detector which both rotates in the sample plan allowing rocking scans and therefore the collect of the diffraction pattern in a very accurate way. In the following discussion, considerations on geometry of both Debye-Scherrer and Laue method will be provided as well. (a) Powder sample (b) Single crystal sample Figure 1: Photographs of a crystallites powder glued on a tip and of a single crystal 2 Results an discussions 2.1 Debye-Scherrer diffraction As presented in the previous section, the Debye-Scherrer method requires a monochro- matic X-Ray source shining a powder sample. The sample is made of crystallites that have been glued on a thin tip. Figure 1a depicts a photograph of the powdered sample as it is held in the Debye-Scherrer chamber. The incident light comes from a small aperture onto the sample and the monochromatic light of given wavelength diffracts at specific angles θ according to Bragg law. Since the sample contains randomly oriented crystallites, it is rotated constantly in order to obtain a complete diffraction pattern. Light is diffracted in all directions fulfilling equation 1 and indeed the diffracted beam are cones of summit the powdered sample. The solid angle of a cone of diffracted light is 4θ. These cone intercept the photographic plate giving ellipses. Hence, there is a unique correspondence between 3
  6. the observed rings and the diffraction angle and therefore the

    diffracting planes indexed hkl. (a) InP powder (b) Silicon powder Figure 2: Photographic plates presenting the diffraction patterns of an InP (2a) and a Si (2b) powdered sample obtained with a Debye-Scherrer set-up. They have been exposed during 20 minutes to diffracted beams, which appear as the bright rings. The black circle in the middle of each photograph corresponds to the beam stop in the direction of the incident light. Figure 2 are scans of the photographic plates which contains to above mentioned rings. We observe also that the overall intensity differs from one plate to the other, suggesting that the amount of crystal powder was different for the two samples, as the diffracted intensity is proportional to the volume of probed matter. Also, around the beam stop image, we can see high intensity which denotes the fact that the incident beam was rather larger than the beam stop, of order of a few centimetres. Analysing the diffraction patterns, one first observes that the two plates shows common rings, but figure 2a of InP presents more rings. Both InP and Si are of cubic symmetry. However, a cubic unit cell can be either primitive (P), or body centred (bcc) or also face centred (fcc). In any case, a cubic system of lattice constant a has a distance dhkl between two crystallographic planes defined as: dhkl = 2π ||Ghkl || = a √ h2 + k2 + l2 (4) The Debye-Scherrer chamber is a cylinder of radius R = 240/2π. The diameter of the rings in the plane of curvature of the cylinder, that is to say along the horizontal direction in the middle of the pictures of figure 2, is given by L = 4Rθ. We can therefore express the interplanar distance as a function of the experimental values: dhkl = nλ 2 sin(L/4R) (5) In practice, one measures the various distances L with the software ImageJ on both Debye-photographs and calculates the corresponding dhkl according to equation 5, at first order, knowing that the Kα emission line has a wavelength λ = 1.5418 ˚ A. Then, in order to calculate the lattice parameter, one needs to know the h, k and l values of the corresponding measured dhkl . For this, one wants to know the Bravais lattice of the sample, either primitive, bcc, fcc or even diamond. The structure factor of cubic lattices can be expressed explicitly from equation 2 as follows: 4
  7. Sbcc hkl = f · 1 + e−iπ(h+k+l) (6) Sfcc

    hkl = f · 1 + e−iπ(k+l) + e−iπ(h+l) + e−iπ(h+k) (7) Sdiamond hkl = Sfcc hkl · 1 + e−i π 2 (h+k+l) (8) One observes that equation 6 cancels if h + k + l is odd. The first Bragg planes are therefore (110), (200), (211), (200). . . Equation 7 cancels if h, k and l are of different parity. This gives the following Bragg reflections for fcc: (111), (200), (220), (311). . . . Equation 8 originates from the fact that the diamond structure is indeed an fcc lattice with an additional basis of atoms at positions (000) and (1 4 1 4 1 4 ). The corresponding structure factor vanishes according to the fcc structure factor but also if and only if h + k + l = 2m for any odd integer m (e.g. 2, 6, 10, 14. . . which implies e−i π 2 (h+k+l) = −1). The expected Bragg planes are therefore (111), (220), (311), (400). . . . Based on the above statements, one can assign a structure to both InP and Si crystal by comparing the measured dhkl and the possible set of Bragg planes compatible with the measurements. On figure 2a, one can see 15 rings for InP. The ratios of two successive dhkl allow to say that it is organized in an fcc structure. The d-values as well as the corre- sponding (hkl) Bragg planes are presented in appendix in table 1. The lattice parameter calculated for each ring according to equation 4 is averaged and equal to aInP = 5.866 ˚ A. For Si, one proceeds likewise and sums up the measurements and calculation in appendix in table 2. One can can say that silicon has diamond structure and he lattice parameter is estimated around aSi = 5.422 ˚ A, which is rather close to literature values1,2 2.2 Laue diffraction Our experiment based on Laue diffraction consists in studying a grenat Ca3 Al2 (SiO4 )3 . The single crystal is depicted on figure 1b. The microscopic arrangement of atoms in periodic lattices impacts the macroscopic shape of a single crystal in such a way that our sample shows analogous symmetry to its crystalline structure. Our sample presents indeed three rotational symmetry axes named A2, A3 and A4 (where the digit stands for the order n of the rotation as in 2π/n). Moreover, there are various mirror planes. In practice, one adjusts the crystal orientation in order to align a symmetry axis with the incident beam. Figure 3 shows two Laue diffractogram obtained with the A2 axis along the incident beam (3a) and with the A4 axis along the beam (3b), both originating from an exposition of 6 minutes under diffracted X-Rays. One can see various spots of varying intensity and obvious symmetry elements. The shape of the spots which are not totally circular can be assigned to both misalignment of the beam with respect to the crystal together with vibrations, and the differences in intensity must be related to the various form factors fj which are contained in the structure factor of the scattering amplitude (equation 2). As already mentioned, the crystal has symmetry axes and mirror planes. In fact, each family of planes (hkl) in the crystal has a symmetrical set of planes with respect to the symmetry elements that are used to define the crystal. Since there is a diffraction spot for each family of planes (Bragg law), the diffraction pattern must exhibit the same symmetry properties as the crystal itself. And this is what can be observed in the Laue diffractograms, where figure 3a shows 180◦ rotational symmetry and figure 3b 1aInP = 5.869 ˚ A http://www.ioffe.ru/SVA/NSM/Semicond/InP/basic.html 2aSi = 5.431 ˚ A http://www.ioffe.ru/SVA/NSM/Semicond/InP/basic.html 5
  8. (a) Incident beam along A2 (b) Incident beam along A4

    Figure 3: Photographic plates of Laue diffraction patterns of Ca3Al2(SiO4)3 with two different orientations with respect to the incident beam, A2 rotational axis for 3a, and A4 for 3b. The black rectangle in the middle of each photograph represents the beam stop in the direction of the beam. Various symmetry elements can be observed and the purple lines depicts some of them, namely rotational and mirror axis: twofold and fourfold symmetry can be observed respectively as expected. depicts 90◦ rotational symmetry. Also, mirror planes can be noticed. Thus, the study of a Laue diffractogram gives great insight on the inherent symmetry properties of the probed crystal. 2.3 Bragg-Brentano diffraction Contrary to the the two methods presented in section 2.1 and 2.2, this last X-Ray diffrac- tion set-up does not generate diffraction patterns on photographic plates. Instead, pow- dered samples are stored as pellets by the machinery which is computer-driven and which consists in two rotating arms with the X-Ray source on the one side and the analyser on the other side, able to do automatized rocking scans. Using this Bragg-Brentano set-up, we have studied five crystalline samples. Firstly, a Silicon powder used as a calibrating sample has been probed, then a crystal belonging to spinel family, namely LiMn2 O4 was used. Afterwards, two BaTiO3 powdered samples made by two distinct operators were used in order to check the reproducibility of the experiment. Finally we performed the diffraction analysis on a mixed powder of LiMn2 O4 and BaTiO3 with the expectation to see both results of the two preceding experiments somehow merged in one diffraction pattern. The following experimental observations are compared to simulations performed with the software Crystal Maker. It allows to generate any willed crystal structures by indicating the corresponding space group and specifying the basis atoms. Computed diffraction patterns of such generated crystals can be obtained and therefore were alike to be compared with our experiments. 6
  9. (1,1,1) (2,2,0) (3,1,1) (4.0.0) (3,3,1) (1,1,1) (3,1,1) (2,2,2) (4,0,0) (3,3,1)

    (5,1,1) (4,4,0) (5,3,1) (5,3,3) (6,2,2) (4,4,4) (7,1,1) (1,0,0) (1,1,0) (1,1,1) (2,0,0) (2,1,0) (2,1,1) (2,2,0) (2,2,1)+(3,0,0) (1,3,0) (1,1,3) (2,2,2) Figure 4: Experimental diffraction patterns obtained in Bragg-Brentano diffraction experiments on Si, LiMn2O4 and BaTiO3. The intensities have been normalized in order to offer comparison between data and simulation. The diffracted peaks have been indexed by their corresponding Miller indices. The black and green lines represent the data and the pink lines headed by circles stand for the simulation results. The insets scheme the corresponding crystal structures. 7
  10. Figure 4 shows both experimental data as diffraction patterns of

    intensity with respect to the diffraction 2θ angle together with the analytical Bragg peaks originating from the simulation. The insets depict the three dimensional structure of the corresponding probed crystals. For Silicon, one can see only the first five Bragg peaks. To refine our previous results obtained after the Debye-Scherrer experiment, one calculates again the lattice parameter of Si based on this novel experiment and finds aSi = 5.436 ˚ A which is closer to the literature value than what had been found earlier and shows the higher accuracy of the current described technique. Another signature of this high accuracy lies in the observed doublet in each diffraction peak, that is shown as an illustration in the magnified inset of the (220) Bragg peak of Si. One can argue at first sight that this may be a systematic error made by the set-up or a calibration issue. But indeed, the emission line of copper used as the main source of X-Ray in this experiment, Kα , presents a doublet. One calculates the difference in energy in the doublet using the previously found lattice parameter, for the two corresponding 2θ values. One finds ∆λ = 3.6 10−3 ˚ A which is rather close to the energy difference between Kα,1 and Kα,2 found in literature3 and shows that the set-up seems to have a very large angular resolution. The results concerning BaTiO3 shows another type of degeneracy shifted in energy, as practically all the diffracted peaks are doubled. Indeed, the shift is much larger than the above mentioned shift for Si which originated from the degeneracy of the Kα line. What we know is that BaTiO3 undergoes a structural phase transition at relatively low temperature (130◦C), changing from cubic to tetragonal with two different lattice constants a and c. Since the difference between a and c are relatively small, the corresponding Bragg peaks coincide pretty much for the two coexisting structures, that is why we can see repeated Bragg peaks. Also, one has superimposed the two obtained diffraction patterns of the two prepared powders of BaTiO3 . After normalization of the intensity, one sees that the peaks are exactly at the same positions, which indicates that the two preparations gives the same qualitative information. The intensity difference may be assigned to the higher or lower amount of powder the two prepared pellets contained. Moreover, on notes that the results of the simulation match really well with the experimental data. The diffraction pattern of the spinel LiMn2 O4 shows qualitative good agreement with the corresponding simulation except that it appears shifted to slight higher values of 2θ, this shift increases with increasing angle. This non-linear disagreement can hardly find an explanation but one may think that either the powder was too compressed giving rise to favoured orientations and altering the diffraction pattern, or something else. The mixing of BaTiO3 with LiMn2 O4 presents the merging of the two former diffraction patterns. However, one can see that the intensity of the spinel Bragg peaks have largely decreased and appear approximately ten times small than for the actual spinel sample. One recalls that when preparing the mixed powder, care has been taken to use very small amount of LiMn2 O4 with respect to barium titanate provided that the former was home- synthesised compared to the latter which can be bought easily. But still, the proportion was certainly not 1:10. It can also be that crystallites of BaTiO3 are also larger than the spinel ones, leading to more intense diffracted intensity. 3∆λ = 3.8 10−3 ˚ A, Lawrence Berkeley National Laboratory X-Ray Data Booklet 8
  11. Conclusion The presented work based on two practicals hopefully shows

    how powerful and essential can be X-Ray diffraction in the characterization as well as in the measurement of physical quantities of structures of patterned samples. The crystalline structure can be resolved ei- ther from single crystals or from powder made of crystallites, using the appropriate set-up and method. The original methods based on photographic plates gave competitive results when compared to the data acquired with a more modern set-up. Also, experimental data could be observed and compared with computational simulations which may be a tool of major interest when studying diffraction of much more complicated structures and molecules. 9
  12. Appendix L(mm) dhkl(˚ A) (hkl) h2 + k2 + l2

    a(˚ A) 35.125 3.383 [1.158] (111) 3 [1.155] 5.860 40.8 2.921 [1.411] (200) 4 [1.414] 5.843 58.3 2.070 [1.171] (220) 8 [1.173] 5.855 68.925 1.768 [1.051] (311) 11 [1.045] 5.865 72.3 1.692 [1.153] (222) 12 [1.155] 5.860 84.5 1.468 [1.089] (400) 16 [1.090] 5.870 93.125 1.347 [1.028] (331) 19 [1.026] 5.870 96.05 1.311 [1.094] (420) 20 [1.095] 5.863 106.775 1.198 [1.061] (422) 24 [1.061] 5.870 114.9 1.129 [1.088] (333),(511) 27 [1.089] 5.864 127.95 1.038 [1.045] (440) 32 [1.046] 5.870 135.825 0.993 [1.015] (531) 35 [1.014] 5.874 138.675 0.978 [1.054] (442),(600) 36 [1.054] 5.869 149.7 0.928 [1.035] (620) 40 [1.037] 5.872 157.925 0.897 (533) 43 5.884 Table 1: The size of the rings are reported together with the corresponding interplanar distance dhkl for the Debye-photograph 2a of InP-powder. The values in square brackets correspond to the ratio dhkl dh k l and h 2+k 2+l 2 h2+k2+l2 supposed to be equal. The lattice parameter is calculated each time according to equation 4 and the average aInP = 5.866 ˚ A is then calculated. L(mm) dhkl(˚ A) (hkl) h2 + k2 + l2 a(˚ A) 38.25 3.111 [1.626] (111) 3 [1.633] 5.388 63.375 1.913 [1.171] (220) 8 [ 1.173] 5.411 75.075 1.634 [1.205] (311) 11 [1.206] 5.419 92.425 1.356 [1.089] (400) 16 [1.090] 5.424 102.05 1.245 [1.124] (331) 19 [1.124] 5.427 117.625 1.108 (422) 24 5.428 Table 2: The size of the rings are reported together with the corresponding interplanar distance dhkl for the Debye-photograph 2b of Si-powder. The values in square brackets correspond to the ratio dhkl dh k l and h 2+k 2+l 2 h2+k2+l2 supposed to be equal. The lattice parameter is calculated each time according to equation 4 and the average aSi = 5.422 ˚ A is then calculated. 10
  13. 2θ(◦) (hkl) dhkl(˚ A) a(˚ A) 28.437 (1,1,1) 3.139 5.436

    47.304 (2,2,0) 1.922 5.435 56.111 (3,1,1) 1.639 5.436 69.112 (4,0,0) 1.359 5.436 76.365 (3,3,1) 1.247 5.436 Table 3: The position of the Bragg peaks within the Bragg-Brentano experiment on Si (figure 4) are presented together with the corresponding interplanar distance and Miller indices. This provides a calculation of the lattice parameter averaged around aSi = 5.436 ˚ A. 2θ(◦) (hkl) dhkl(˚ A) a(˚ A) 18.728 (1,1,1) 4.738 8.207 36.258 (3,1,1) 2.478 8.217 37.929 (2,2,2) 2.372 8.217 44.079 (4,0,0) 2.054 8.217 48.256 (3,3,1) 1.886 8.220 58.317 (5,1,1) 1.582 8.222 64.065 (4,4,0) 1.453 8.222 67.374 (5,3,1) 1.390 8.223 75.880 (5,3,3) 1.254 8.222 76.916 (6,2,2) 1.240 8.222 81.027 (4,4,4) 1.187 8.222 84.069 (7,1,1) 1.151 8.222 Table 4: The position of the Bragg peaks within the Bragg-Brentano experiment on LiMn2O4 (figure 4) are presented together with the corresponding interplanar distance and Miller indices. This provides a calculation of the lattice parameter averaged around aLiMn2O4 = 8.219 ˚ A. 11