Upgrade to Pro — share decks privately, control downloads, hide ads and more …

Molecular Beam Epitaxy and Surface Reconstruction - Master 2 SMNO Nanomat

jelledionot
December 06, 2011

Molecular Beam Epitaxy and Surface Reconstruction - Master 2 SMNO Nanomat

jelledionot

December 06, 2011
Tweet

More Decks by jelledionot

Other Decks in Education

Transcript

  1. Molecular beam epitaxy and surface reconstruction Report written by Marcel

    Br¨ andlein and Jelle Dionot under the supervision of Paola Atkinson Universit´ e Pierre et Marie Curie Institut des Nanosciences de Paris Nanomat Master Program – Group 2 Tuesday, December 6th 2011
  2. Contents 1 Temperature response of the sample 1 2 Measurements

    of surface reconstruction transition 1 3 Measurements of growth rate 2 4 Figures 4
  3. 1 Temperature response of the sample The molecular beam epitaxy

    is performed in ultra-high vacuum conditions, where not only pressure control is of primary importance, but also temperature. For this latter parameter, the set-up uses a Eurotherm supplier which controls, regulates and measures temperature inside the epitaxy chamber, close to the sample under growth or RHEED study. We set the temperature at will and the sample temperature is regulated accordingly. However, the set temperature differs slightly to the actual one applied on the sample. This is mainly due to the fact that temperature changes are induced by a diffuser plate placed behind the sample holder and therefore not perfectly close to the sample. The Eurotherm supplier is a PID-controller based on feedback mechanisms which is not perfectly error-free. To overcome these issues, temperature is measured also by a pyrometer, which provides a complementary reference measurement. We induced temperature ramps to the sample for a surface reconstruction study which is presented in section 2. The ramps basically consisted in heating up or cooling down the sample in approximately 100◦C windows around 500◦C. Both Eurotherm and pyrometer temperatures were measured. Figures 1a and 1b displays the ramps with respect to time for both Eurotherm and pyrometer values. We immediately see that the former are much higher than the latter, with a difference of approximately 100◦C. The pyrometer is an actual measurement of the temperature by a device independent of Eurotherm setting device. We notice the rounded shape of the pyrometer lines after the correspond abrupt changes in the set temperatures. This is assigned to a time lag of the sample whose finite heat capacity implies a certain time for it to heat up or cool down with respect to the willed temperature. Also, we observe that the slopes of the pyrometer lines are smaller than the ones in the Eurotherm lines. This is even truer for a higher ramp rate, as seen in figure 1b. We can hence say that the sample seems to respond better for slower temperature changes than for high ramp rates. For the further considerations, we take the pyrometer measurements as the temperatures reference, based on its more physical meaning even though it might also differ from the actual temperature due to the optical path of the measured radiation. 2 Measurements of surface reconstruction transition We have seen during this practical that the GaAs surface undergoes a reconstruction transition at a certain critical temperature. This can be seen in the RHEED images depicted in figure 2 and 3 which were taken for each reconstruction along three different directions. In the [1¯ 10] direction, when we compare the two reconstructions, we can see that there are more streaks in figure 3c than in 2c. The streaks are more spatially spread in the latter one. Since a RHEED image is a diffraction pattern, it shows the reciprocal space. Hence, in the [1¯ 10] direction in direct space, the lattice periodicity is two times smaller for the surface corresponding to RHEED image 2c. This can be compared with literature1 where the surface structures of both c(4 × 4) and (2 × 4) reconstructions can be found. From this, we can safely conclude that images in figure 2 are RHEED patterns of the c(4 × 4) reconstruction and therefore this reconstruction lies at 422◦C. Likewise, we can observe that in the [010] direction, the RHEED image 3b taken at 496◦C shows only one streak compared to the corresponding one at lower temperature. The latter corresponds to a direction where there is higher symmetry in real space than for the former. Again, this can be compared to already mentioned published structure models where we can see that the [010] direction for the (2 × 4) reconstruction does not coincide with a surface lattice direction, which is another argument to assign the surface reconstruction at higher temperature to be (2 × 4). Finally, we observe that at 422◦C, the [110] and [1¯ 10] direction images shows the same diffraction patterns. Indeed, in direct space, in the c(4 × 4), these two directions show same symmetry in the surface unit cell, as can be seen in page 312 of the mentioned paper. Accord- 1A. Ohtake; Surface Science Reports 63; 295-327 (2008) 1
  4. ingly, images 3a and 3c show periodical streaks in agreement

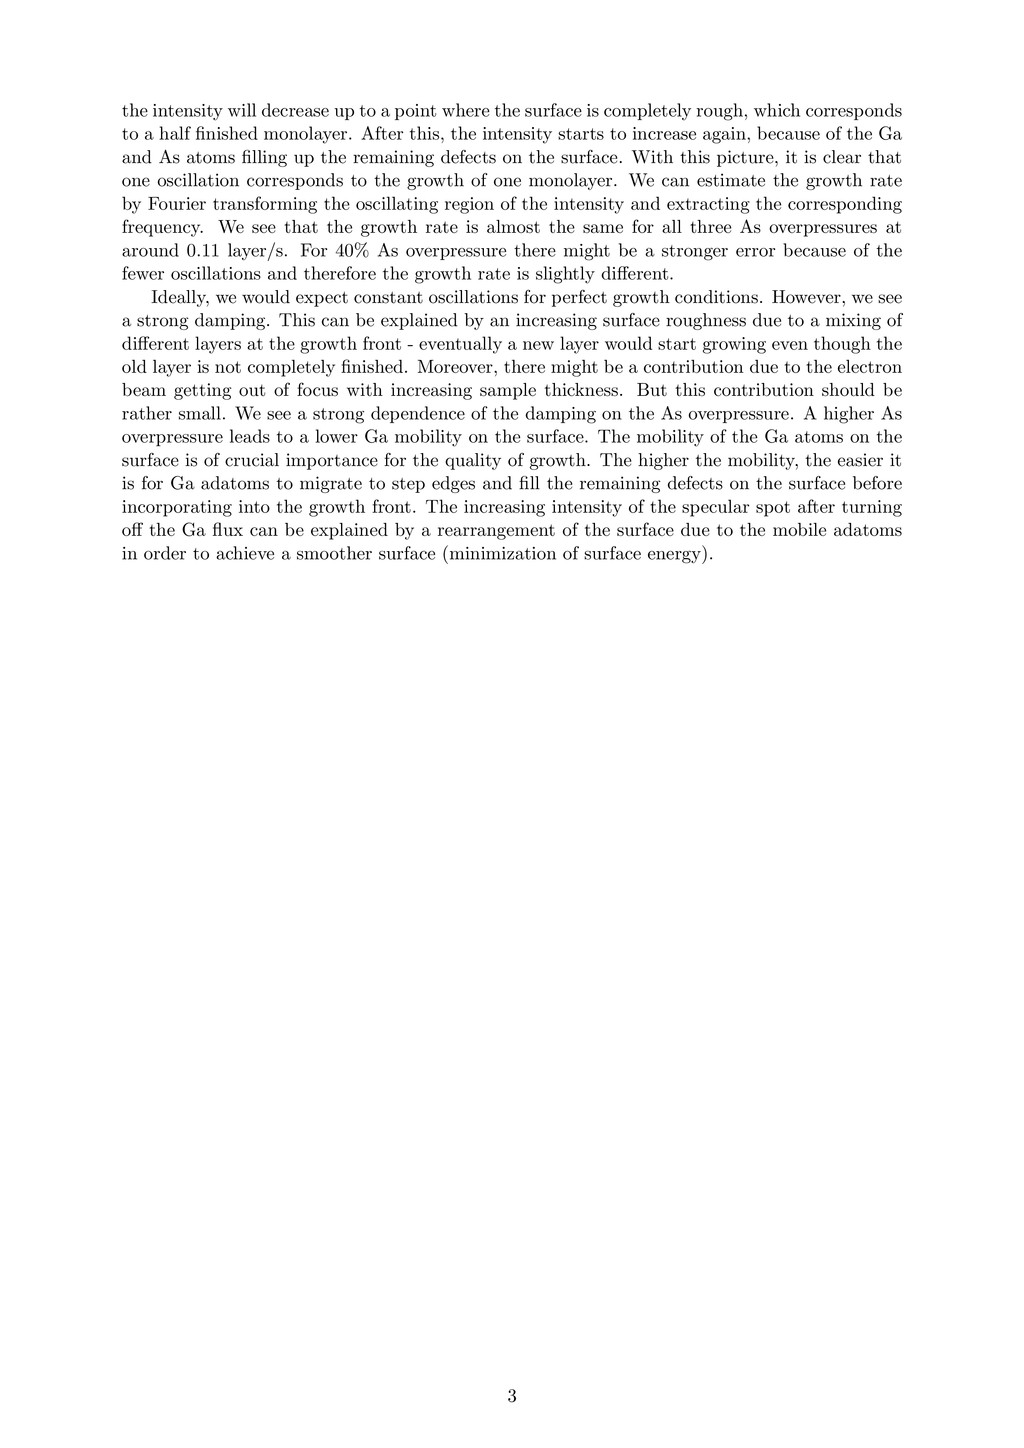
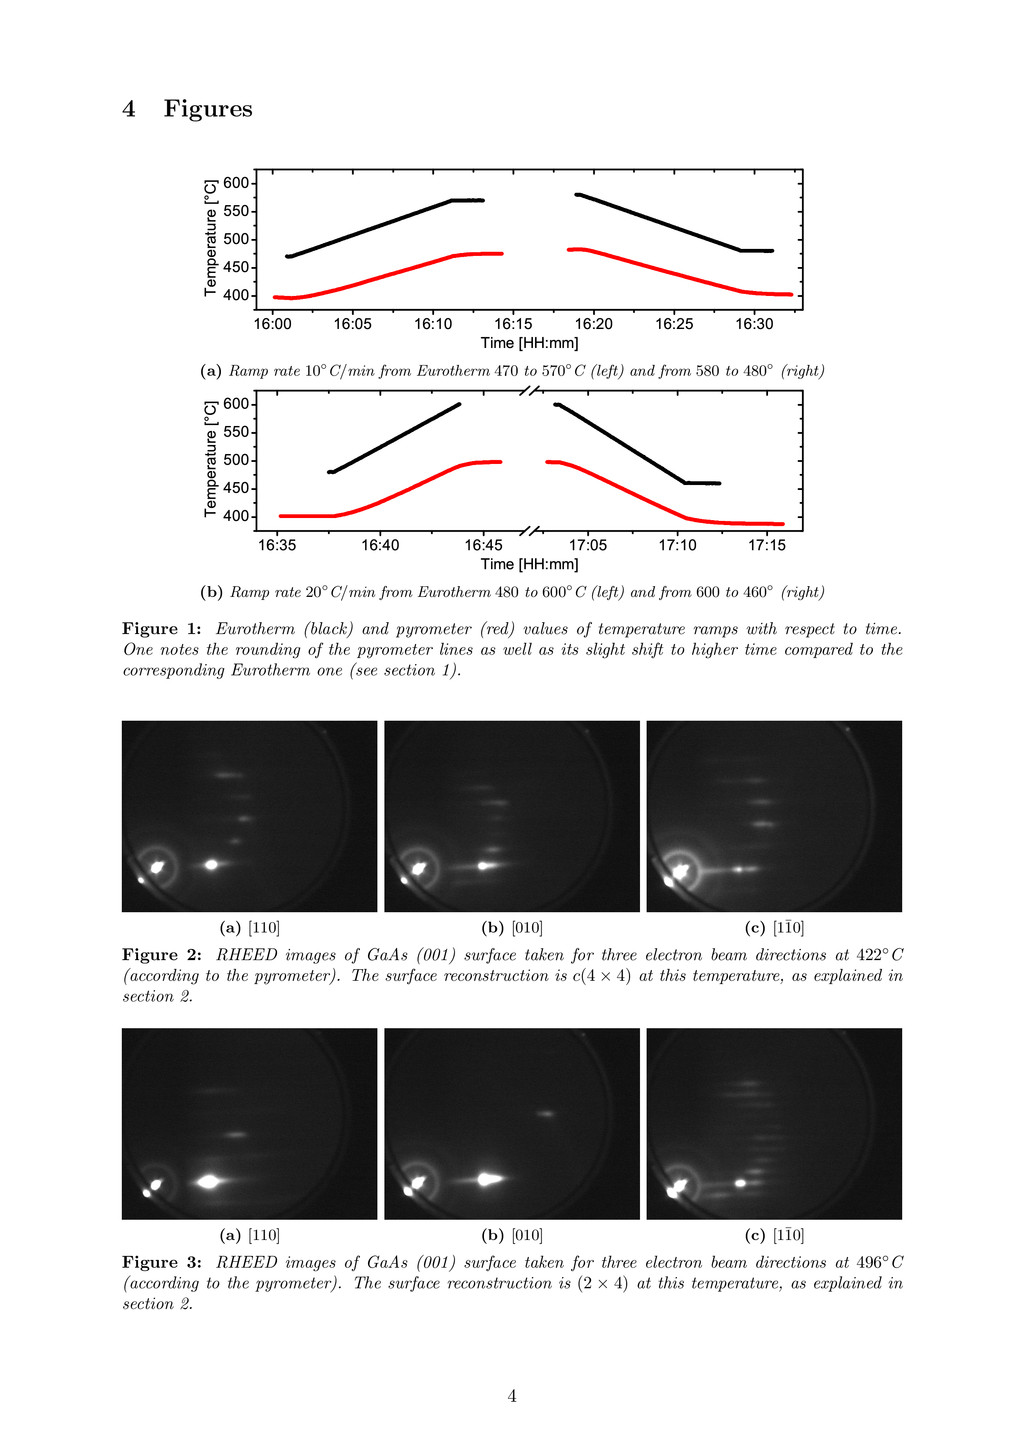
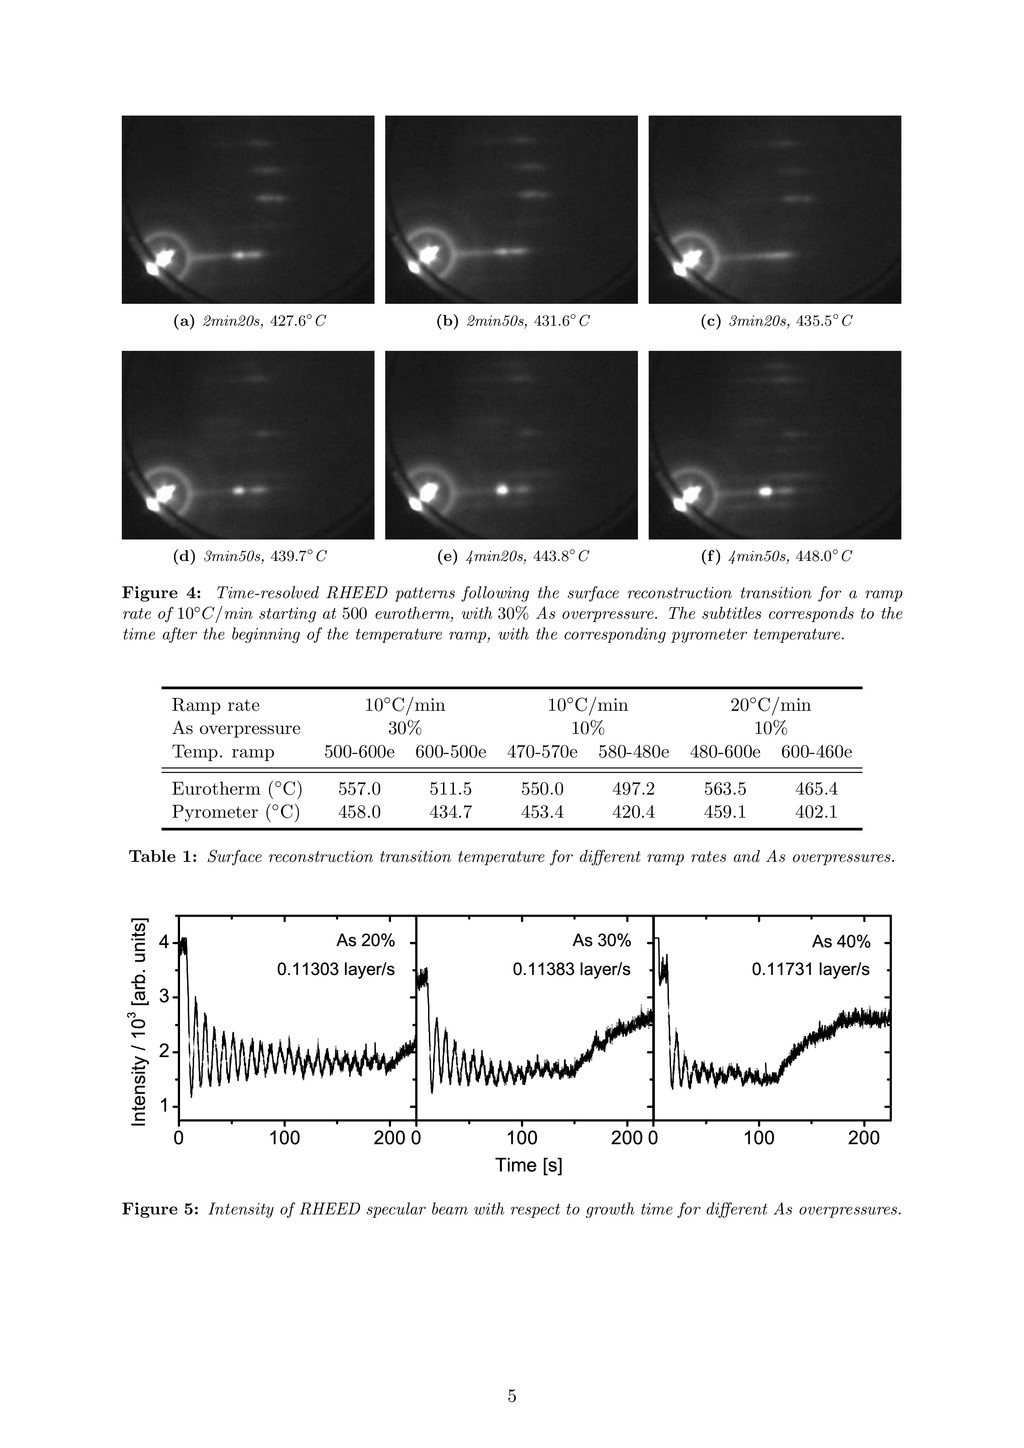
    with the rectangular surface unit cell of the (2 × 4) reconstruction. Added to the static images, we recorded RHEED patterns evolving in time for different temperature ramps. This was performed in order to characterize the reconstruction transition temperature for different ramp rates as well as different As overpressure. Figure 4 illustrates extracted patterns for ascending temperature exposure in increasing time, taken in the [¯ 110] direction. This direction is equivalent to the [1¯ 10] as far as the two reconstructed structures are concerned and therefore the [¯ 110]-RHEED images of the video can be compared to the [1¯ 10]- RHEED images of figures 2 and 3. At first, the pattern displayed in image 4a corresponds to the c(4 × 4) reconstruction as it is shown in figure 2c. After 3min50s, that is after an increase of around 12◦C, new streaks tend to appear, characterizing the reconstructed surface (2 × 4), as it is also illustrated in figure 3a. Intermediate steps are reached with extinction of streaks and appearance of others, characterizing the actual transition. The transition temperature is estimated by finding the image frame in which the RHEED pattern is intermediate between the two reconstructions. We estimated the transition temperature for six different temperature ramps summed up in table 1. The table shows an up ramp and the corresponding down ramp for different ramp rates and As overpressures. First, we observe that the transition temperature for an up ramp differs from the one for a down ramp by approximately 25◦C for a ramp rate of 10◦C/min and 60◦C for 20◦C/min. This resembles a hysteresis, meaning that the transition does depend on the way to ramp (up or down). Changing from one surface reconstruction to another needs some energy. Even though the transition occurs at a specific temperature for an up ramp, the tendency to keep the same surface reconstruction leads to a lower transition temperature for a down ramp (compare supercooling of water). Furthermore, we see a slight decrease in the transition temperature at constant ramp rate for lower As overpressure, which is more clear for the down ramp. We see another feature for a higher ramp rate. Here, the transition temperature for a down ramp is again lower. In total, we can say that the transition temperature for an up ramp does not depend much on the ramp rate and the As overpressure but more variations can be seen for the down ramps. 3 Measurements of growth rate In order to achieve some GaAs growth, which is basically the main purpose of MBE, we need to open the shutter for the Ga K-cell. This allows a constant Ga flux towards the substrate surface. The As overpressure is always higher then the Ga overpressure and thus the growth rate is determined by the latter. For monitoring the quality of growth, we use the insightful information provided by the specular spot of the RHEED-pattern. This is shown in figure 5, where we have depicted the intensity of the specular spot with time for three different As overpressures. For each As overpressure we can see oscillations in the intensity after turning on the Ga flux. These oscillations are rapidly damped and the damping increases with increasing As overpressure. After some time, the oscillations reach some sort of equilibrium and no further damping occurs. At this point we turn of the Ga flux and the intensity of the specular spot increases again. It has been shown that the intensity of this specular spot is related to the step edge density on the surface2. Because of the very short de-Broglie wavelength of high energy electrons of about 0.1 ˚ A, these step edges act as scattering centres. Consequently, a high step edge density leads to a low intensity of the specular spot, since the electron beam is scattered in all directions rather then being reflected by a totally smooth surface. If we consider layer-by-layer growth, the intensity of the specular spot directly reflects the growth. Starting from a perfectly smooth surface with a very low step edge density, i.e. very high intensity of the specular beam, the Ga and As atoms will stick to the surface and create lots of islands and new step edges. Therefore, 2P.J. Dobson, B.A. Joyce, J.H. Neave and J. Zhang; Journal of Crystal Growth 81; 1-8 (1987) 2
  5. the intensity will decrease up to a point where the

    surface is completely rough, which corresponds to a half finished monolayer. After this, the intensity starts to increase again, because of the Ga and As atoms filling up the remaining defects on the surface. With this picture, it is clear that one oscillation corresponds to the growth of one monolayer. We can estimate the growth rate by Fourier transforming the oscillating region of the intensity and extracting the corresponding frequency. We see that the growth rate is almost the same for all three As overpressures at around 0.11 layer/s. For 40% As overpressure there might be a stronger error because of the fewer oscillations and therefore the growth rate is slightly different. Ideally, we would expect constant oscillations for perfect growth conditions. However, we see a strong damping. This can be explained by an increasing surface roughness due to a mixing of different layers at the growth front - eventually a new layer would start growing even though the old layer is not completely finished. Moreover, there might be a contribution due to the electron beam getting out of focus with increasing sample thickness. But this contribution should be rather small. We see a strong dependence of the damping on the As overpressure. A higher As overpressure leads to a lower Ga mobility on the surface. The mobility of the Ga atoms on the surface is of crucial importance for the quality of growth. The higher the mobility, the easier it is for Ga adatoms to migrate to step edges and fill the remaining defects on the surface before incorporating into the growth front. The increasing intensity of the specular spot after turning off the Ga flux can be explained by a rearrangement of the surface due to the mobile adatoms in order to achieve a smoother surface (minimization of surface energy). 3
  6. 4 Figures 16:00 16:05 16:10 16:15 16:20 16:25 16:30 400

    450 500 550 600 Temperature [°C] Time [HH:mm] (a) Ramp rate 10◦C/min from Eurotherm 470 to 570◦C (left) and from 580 to 480◦ (right) 16:35 16:40 16:45 17:05 17:10 17:15 400 450 500 550 600 Temperature [°C] Time [HH:mm] (b) Ramp rate 20◦C/min from Eurotherm 480 to 600◦C (left) and from 600 to 460◦ (right) Figure 1: Eurotherm (black) and pyrometer (red) values of temperature ramps with respect to time. One notes the rounding of the pyrometer lines as well as its slight shift to higher time compared to the corresponding Eurotherm one (see section 1). (a) [110] (b) [010] (c) [1¯ 10] Figure 2: RHEED images of GaAs (001) surface taken for three electron beam directions at 422◦C (according to the pyrometer). The surface reconstruction is c(4 × 4) at this temperature, as explained in section 2. (a) [110] (b) [010] (c) [1¯ 10] Figure 3: RHEED images of GaAs (001) surface taken for three electron beam directions at 496◦C (according to the pyrometer). The surface reconstruction is (2 × 4) at this temperature, as explained in section 2. 4
  7. (a) 2min20s, 427.6◦C (b) 2min50s, 431.6◦C (c) 3min20s, 435.5◦C (d)

    3min50s, 439.7◦C (e) 4min20s, 443.8◦C (f) 4min50s, 448.0◦C Figure 4: Time-resolved RHEED patterns following the surface reconstruction transition for a ramp rate of 10◦C/min starting at 500 eurotherm, with 30% As overpressure. The subtitles corresponds to the time after the beginning of the temperature ramp, with the corresponding pyrometer temperature. Ramp rate 10◦C/min 10◦C/min 20◦C/min As overpressure 30% 10% 10% Temp. ramp 500-600e 600-500e 470-570e 580-480e 480-600e 600-460e Eurotherm (◦C) 557.0 511.5 550.0 497.2 563.5 465.4 Pyrometer (◦C) 458.0 434.7 453.4 420.4 459.1 402.1 Table 1: Surface reconstruction transition temperature for different ramp rates and As overpressures. 0 100 200 1 2 3 4 0 100 200 0 100 200 0.11731 layer/s 0.11383 layer/s As 40% As 30% Intensity / 10 3 [arb. units] As 20% 0.11303 layer/s Time [s] Figure 5: Intensity of RHEED specular beam with respect to growth time for different As overpressures. 5