Upgrade to Pro — share decks privately, control downloads, hide ads and more …

Polarized Raman spectra of quartz alpha

jelledionot
November 15, 2011

Polarized Raman spectra of quartz alpha

jelledionot

November 15, 2011
Tweet

More Decks by jelledionot

Other Decks in Education

Transcript

  1. Polarized Raman spectra of α-quartz Universit´ e Pierre et Marie

    Curie Institut de min´ eralogie et de physique des milieux condens´ es Nanomat Master Program – Group 2 Tuesday, November 15th 2011 Report by Jelle Dionot With Marcel Br¨ andlein, under the supervision of Pr. Fr´ ed´ eric Datchi
  2. Contents Introduction 1 1 Principles of Raman spectroscopy 1 1.1

    Raman scattering and polarizability . . . . . . . . . . . . . . . . . . . . . . 1 1.2 Set-up and importance of directions . . . . . . . . . . . . . . . . . . . . . . 2 2 Results and discussion 4 Conclusion 7 1
  3. Introduction Among all the available spectroscopic methods to investigate vibrational

    modes in solid state, X-ray or neutrons scattering are techniques of great interest but don’t appear to be the most adjusted ones. Indeed, the heavy machinery they represent with respect to the amount of information they give can look disproportioned when compared to laboratory size spectroscopy such as Raman which is based on the interaction between the oscillating electric field of scattered radiation and the polarizability of the material, following specific selection rules. After presenting some of the basic principles of Raman scattering, we propose in this work a set of measurements of phonons in a single crystal of α-quartz at room temperature, along with some considerations on the very complementary technique of infrared spectroscopy. 1 Principles of Raman spectroscopy 1.1 Raman scattering and polarizability Raman spectroscopy relies on inelastic scattering of monochromatic light. Incident pho- tons of given energy are absorbed, exciting particles or quasiparticles which relaxes by emitting photons of different energy. In the case of solid state and crystalline structure as described by quantum mechanics, light can interact with quasiparticles describing the lattice vibrations which are the phonons. The interaction of light with vibrations origi- nates from the coupling of two quantities: the polarization and the electric field of the scattered light. The incident light is characterized by its direction of propagation ki and the direction of oscillations of the electric field Ei which defines the polarization direction. This electromagnetic field propagating in matter induces changes in the distributions of electrons around the atoms (i.e. distortion of electric clouds because of changes in the atomic orbitals) which induces a dipole moment p. This response to the incident electric field varies with the properties of the materials, such as its structure and the nature of its elements. The measure of the change in charge distribution is given by the stress tensor α called the polarizability which allows to write the induced polarization as: p = p0 + αEi (1) where the polarizability is a symmetrical tensor of rank 2 (whose frame of reference will be defined later on) which explicitly reads: α = α0 ij + n qn ∂αij ∂qn (2) From the above equations, it shows that the induced polarization takes into account the variations of the polarizability imposed by the lattice dynamics. In fact, phonons of wavevector qn originating from atomic displacements due to thermal excitation induce fluctuations of the atomic susceptibility and therefore of the polarizability as described in equation 2. The so-called Raman tensor describes this phenomenon since it is defined as the derivative of the polarizability with respect to the normal coordinate of vibrational mode n and is noted αij . This implies that the polarizability α contains information relative to the lattice dynamics, and therefore to the symmetry knowing that the phonon vibrations obey rules of symmetry and group theory. 1
  4. As The Hamiltonian of interaction underlying the Raman effect can

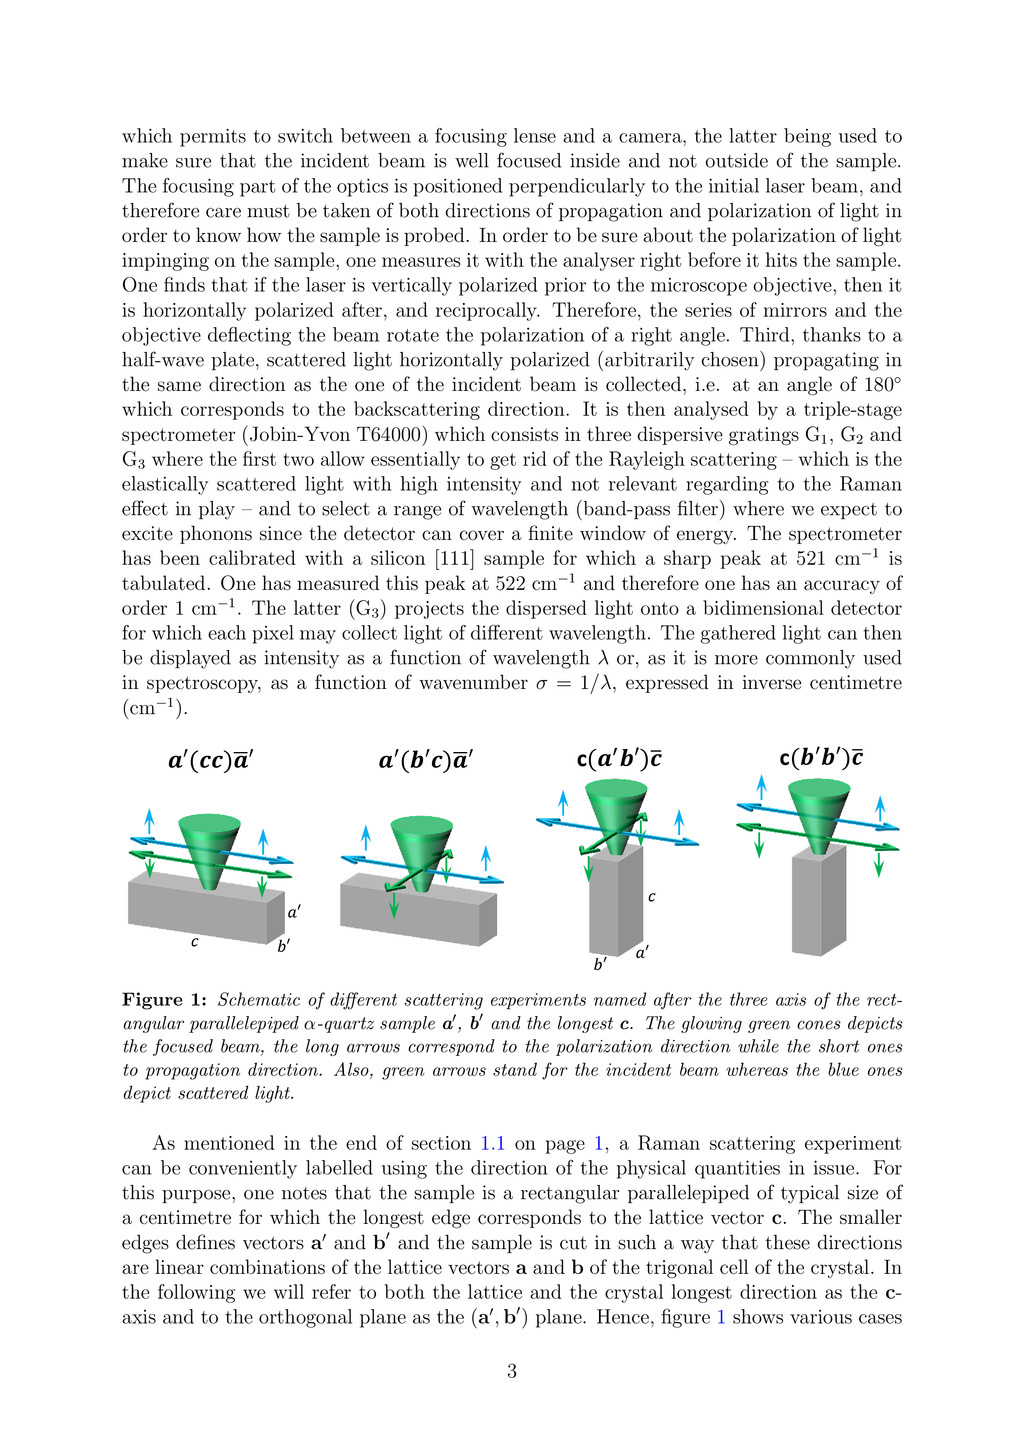
    be written Hint = −p · Es, where Es is the electric field of the scattered light, it ends that, according to equation 1 and the presence of the incident electric field Ei, a Raman scattering experi- ment can be described by both incident and scattered electric field’s direction and by their respective direction of propagation. A t(uv)w scattering experiment thus corresponds to probing the sample with an incident light propagating in t-direction and polarized along the u-direction leading to a scattering process for which the scattered light is polarized along the v-direction and propagating in w-direction, with respect to a given 3-dimensional basis usually taken as the crystal lattice vectors (a, b, c) as we will discuss later on. In our experiment, we measure the optical phonons of α-quartz. It is made of SiO2 with nine atoms in its unit cell. This crystal belongs to the point group D3 which has three irreducible representations A1 , A2 and E. Each of them corresponds to a specific type of symmetry and therefore to given family of vibrational modes. There are N = 9 atoms in the unit cell and therefore 3 × N = 27 phonon modes, from which 3 are acoustic ones (translational) of symmetry A1 + 2E and 24 are of optical type, with 4A1 + 4A2 + 16E symmetry. The E optical modes are doubly degenerate, with both transverse and longitudinal phonons, so only half of them can be resolved. Amongst the scattering and group theory selection rules, the Raman tensor αij gives full information on which modes are available to excitation and which are not, according to the following correspondence between symmetry representation and non-zero val- ues of αij : A1 : αzz and αxx = αyy A2 : none (3) E : αxx = −αyy = |αxy | and α 2 xz = α 2 yz Only A1 and E modes can be probed by Raman spectroscopy since every component of the Raman tensor are zero for A2 symmetry. Thus one sees that this technique is rather complementary to infrared spectroscopy for which selection rules allow to probe A2 and E modes. Hence, for both known incident and scattered beam direction and polarization direc- tion, one can deduce the excited modes according to the above correspondence. 1.2 Set-up and importance of directions The experimental set-up for Raman spectroscopy consists in an Argon laser tuned at the wavelength 514.5 nm as the incident monochromatic source, focused on a sample from which scattered light is analysed by a triple-stage dispersive spectrometer and displayed in terms of light intensity as a function of energy. First, the laser is set at a power of hundreds of mW which requires caution since this is hundreds times stronger than the sun’s direct light. This highly coherent light is polarized linearly in a plane orthogonal to the direction of propagation. The linear polarization of the laser is set as vertical, i.e. perpendicular to the optical table, thanks to the use of a polarization rotator coupled with an analyser. Vertical polarization of the incident light is obtained for an rotator angle of 220◦ whereas horizotal polarization is set for a rotator at the angle 130◦ (as 220◦ − 130◦ = 90◦). Second, the beam of controlled polarization is directed by a set of optics and focused onto the sample by a microscope. The microscope has a rotatable stage 2
  5. which permits to switch between a focusing lense and a

    camera, the latter being used to make sure that the incident beam is well focused inside and not outside of the sample. The focusing part of the optics is positioned perpendicularly to the initial laser beam, and therefore care must be taken of both directions of propagation and polarization of light in order to know how the sample is probed. In order to be sure about the polarization of light impinging on the sample, one measures it with the analyser right before it hits the sample. One finds that if the laser is vertically polarized prior to the microscope objective, then it is horizontally polarized after, and reciprocally. Therefore, the series of mirrors and the objective deflecting the beam rotate the polarization of a right angle. Third, thanks to a half-wave plate, scattered light horizontally polarized (arbitrarily chosen) propagating in the same direction as the one of the incident beam is collected, i.e. at an angle of 180◦ which corresponds to the backscattering direction. It is then analysed by a triple-stage spectrometer (Jobin-Yvon T64000) which consists in three dispersive gratings G1 , G2 and G3 where the first two allow essentially to get rid of the Rayleigh scattering – which is the elastically scattered light with high intensity and not relevant regarding to the Raman effect in play – and to select a range of wavelength (band-pass filter) where we expect to excite phonons since the detector can cover a finite window of energy. The spectrometer has been calibrated with a silicon [111] sample for which a sharp peak at 521 cm−1 is tabulated. One has measured this peak at 522 cm−1 and therefore one has an accuracy of order 1 cm−1. The latter (G3 ) projects the dispersed light onto a bidimensional detector for which each pixel may collect light of different wavelength. The gathered light can then be displayed as intensity as a function of wavelength λ or, as it is more commonly used in spectroscopy, as a function of wavenumber σ = 1/λ, expressed in inverse centimetre (cm−1). x ′() ′ ′(′) ′ c(′′) c(′′) ′ ′ ′ ′ Figure 1: Schematic of different scattering experiments named after the three axis of the rect- angular parallelepiped α-quartz sample a , b and the longest c. The glowing green cones depicts the focused beam, the long arrows correspond to the polarization direction while the short ones to propagation direction. Also, green arrows stand for the incident beam whereas the blue ones depict scattered light. As mentioned in the end of section 1.1 on page 1, a Raman scattering experiment can be conveniently labelled using the direction of the physical quantities in issue. For this purpose, one notes that the sample is a rectangular parallelepiped of typical size of a centimetre for which the longest edge corresponds to the lattice vector c. The smaller edges defines vectors a and b and the sample is cut in such a way that these directions are linear combinations of the lattice vectors a and b of the trigonal cell of the crystal. In the following we will refer to both the lattice and the crystal longest direction as the c- axis and to the orthogonal plane as the (a , b ) plane. Hence, figure 1 shows various cases 3
  6. corresponding to different scattering experiments which all probe different vibrational

    modes according to the correspondence stated in equations 3. As a consequence, knowing the polarization of the incoming and scattered light, the orientation of the crystal sample with respect to the focused light is the key parameter for probing the vibrational modes of our choice. In the case of our experiment, the Cartesian basis (x, y, z) is taken to be equivalent to the sample basis (a , b , c) (and therefore can vary according to how the sample is probed) so that the probed matrix elements αij of the Raman tensor α coincide with the terms in parenthesis in the label of the corresponding scattering experiment. 2 Results and discussion W a v e n u m b e r [ c m - 1 ] 5 0 3 5 0 6 5 0 9 5 0 1 2 5 0 0 . 0 0 . 5 1 . 0 1 . 5 I n t e n s i t y / 1 0 3 [ a r b . u n i t s ] 7 0 0 8 0 0 9 0 0 1 0 0 0 1 1 0 0 0 . 0 0 0 0 . 0 2 5 0 . 0 5 0 0 . 0 7 5 4 3 5 4 5 5 4 7 5 0 . 0 0 . 1 0 . 2 2 0 0 2 5 0 3 0 0 3 5 0 0 . 0 0 0 . 0 5 0 . 1 0 Figure 2: Spectrum of z(xy)z scattering experiment (i.e. probing αxy Raman tensor element) within the energy window 50 to 1250 cm−1. The data are presented with the calculated fitting curve which shows a very satisfactory matching. Enlargements are displayed since the majority of the peaks are about 30 times less intense than the main one at lowest energy. The first set of scattering experiment was performed placing the crystal with its c- axis aligned with to direction of propagation of both incident and backscattered beam (c(a b )¯ c or equivalently z(xy)¯ z experiment and the one permuting a and b or equiva- lently permuting x and y since one can only consider (a , b ) plane or equivalently (x, y) plane). Vibrational modes were probed from 50 to 1250 cm−1 with power 1 W for 120 s of acquisition. Two acquisitions were performed from which the average has been calcu- lated. Figure 2 depicts the experimental data together with a fitting profile of the line using pseudo-Voigt functions, showing very good agreement with data. One counts a total of eleven peaks. According to the selection rules 3, and given the Raman experiment in play, one should have probed E modes only, therefore expecting 8 peaks for the 16 doubly 4
  7. degenerated modes (transverse and longitudinal optical modes of E symmetry).

    Instead, although they are in principle forbidden, one actually probes the modes of A1 symmetry. The reason for this is that, as mentioned at the end of section 1.2, the lattice vectors are not aligned with the sample edges. Hence, even though we know that light polarization is in the (x, y) plane, it turns out that it is neither along x or y but defined as a linear combination of x and y. Modes corresponding to αxx and αyy can therefore be excited as well. Still one should then observe twelve peaks (4A1 and 8E). Further experiments gave insightful complementary information towards this point. 0.00 0.15 0.30 50 350 650 950 1250 0.00 0.15 0.30 0.00 0.15 0.30 0.00 0.15 0.30 α' zz Wavenumber [cm-1] α' yz Intensity / 103 [arb.units] α' xy α' yy Figure 3: Spectra of the Raman experiment indicated as annotation in the corresponding plot. Light was acquired for 120 s, except for αzz for which the acquisition time was twice as small but for which intensity has been multiplied by two (hence the larger noise). All graphs are aligned and scaled identically and the intensities are normalized with respect to the maximum of each spectrum in order to provide direct comparison between the relative intensity of relevant comparable peaks. The data are displayed together with the computed fitting curve which both show remarkable agreement. By changing the orientation of the crystal on its holder and therefore the relative direction of polarization with respect to its axis, one covers three other Raman experi- ments, probing αzz , αyy and αyz , which are all shown in figure 3. The intensities have been normalized to the highest peak for each spectrum in order to provide a comparative 5
  8. discussion on the observed modes for the different orientations. Wavenumber

    cm-1 Maximum Intensity [arb.units] Literature1 αzz αyy αxy αyz A1 modes 206 209.5 (1044) 209.8 (944) 209.3 (109) 209.9 (43) 355 357.5 (492) 357.4 (474) 357.1 (59) 357.2 (27) 464.5 466.3 (8166) 466.7 (10609) 466.5 (653) 466.6 (214) 1082 1083.2 (194) 1081.9 (35) Degenerate E modes (El + Et) 128 131.2 (890) 131.1 (1691) 131.0 (746) 264.5 266.1 (46) 267.4 (405) 696 698.4 (57) 698.6 (76) 700.4 (33) 1159 1162.2 (170) 1162.1 (280) 1159.1 (70) Nondegenerate E modes (doublets Et < El) 394 395.9 (353) 395.8 (728) 403.5 404.9 (160) 450 451.5 (38) 508.5 510.7 (329) 796 799.9 (25) 798.9 (34) 809 811.3 (287) 1067 1066.9 (31) 1067.4 (33) 1230 1230.2 (20) Table 1: Fundamental vibrational modes of α-quartz for different scattering geometries obtained from the measurements according to figure 3 in comparison to literature values. The intensities are given in parentheses for each mode. For α’ zz only A1 modes can be seen. The other three Raman tensor elements give additional E mode peaks and the A1 are suppressed for α’ xy and α’ yz . The yy- and xy-component probe transverse vibrational modes, whereas the yz-component probes longitudinal modes. First, let’s see why one of the A1 mode did not show up in the first measurement. The αzz experiment should only probe A1 modes and hence 4 peaks are expected. We perfectly see them at various positions and one denotes a tremendous difference in intensity for these 4 peaks compared to the same ones in the αxy experiment: the number of counts is approximately 10 times higher for the αzz experiment, and the intensity ratio between the peaks at 209 cm−1 and 1083 cm−1 is around 5. This reasoning applied to the data of αxy , it turns out that the expected peak at 1083 cm−1 lies in the noise with a supposed intensity not higher than 0.02 · 103. The measurement of αyy , as expected according to the selection rules on the Raman tensor, exhibits A1 and E modes. Similarly to the already mentioned αzz experiment, the main peaks are those of A1 vibrational modes, although globally less intense, with a prominent one at 466 cm−1. This peak is so intense and broad that it prevents from seeing the line of the degenerate E modes expected at 264.5 cm−1 and the E mode at 450 cm−1. The relative variations of intensity are not explained by the matrix elements’ selection 1J. D. Masso, C. Y. She, D. F. Edwards, Phys. Rev. B 1, 4179 (1970) 6
  9. rules. Effects on Raman cross-section, birefringence and other electric interactions

    should give insight to this but are not covered within this work. In principle, αxy and αyz spectra should display the same vibrational modes with maybe different intensity. They end up to be actually quite alike, though four E modes are shifted towards higher energy. J. F. Scott and S. P. S. Porto showed2 that the energy of transverse phonons is lower than the energy of the longitudinal ones. One concludes that αyz Raman tensor element probes longitudinal non degenerate phonons while αyz gives insight to transverse ones. All observed vibrational modes are gathered into table 1 which gives a great overview of what has been probed for the different orientations. The αzz element probes only A1 modes, whereas αyy together with αxy exhibit A1 , degenerated E modes and transverse non-degenerate E modes while finally αyz shows the same except that the non-degenerate E modes are the longitudinal ones. Clearly, given the symmetry of the vibrations, A2 modes would have been probed by infrared spectroscopy. Also, the distinction between transverse and longitudinal modes could have been done with infrared spectroscopy since only transverse components are infrared active. Conclusion Raman spectroscopy is a very powerful tool to investigate phonons in a crystal based on symmetry and orientation considerations. It is qualitatively very rich and informative but requires some more caution and theoretical refinement in order to be more quantitative, in terms of intensity of the spectra. One could have used the half-wave plate to analyse vertically polarized scattered light to improve the overall picture. Despite all this, some drawbacks remains such as the importance to work with purely and well defined as well as oriented crystalline samples, which can not be crystallites in powder. However, together with infrared spectroscopy, one has been able to have a full profile of lattice vibrations and therefore to see how reliable and essential in terms of chemical analysis these techniques are. 2J. F. Scott, S. P. S. Porto, Phys. Rev. 161, 903–910 (1967) 7