Upgrade to Pro — share decks privately, control downloads, hide ads and more …

Infrared Spectroscopy - Master 2 SMNO Nanomat

jelledionot
November 16, 2011

Infrared Spectroscopy - Master 2 SMNO Nanomat

jelledionot

November 16, 2011
Tweet

More Decks by jelledionot

Other Decks in Education

Transcript

  1. Infrared Spectroscopy Universit´ e Pierre et Marie Curie Institut de

    min´ eralogie et de physique des milieux condens´ es Nanomat Master Program – Group 2 Wednesday, November 16th 2011 Report by Jelle Dionot With Marcel Br¨ andlein, under the supervision of Pr. Paola Giura
  2. Contents Introduction 1 1 Theoretical background on infrared spectroscopy 1

    1.1 Absorption and vibrational modes . . . . . . . . . . . . . . . . . . . . . . . 1 1.2 Optical conductivity through optical density . . . . . . . . . . . . . . . . . 2 1.3 Set-up: Fourier Transform Infrared Spectrometer FTIR . . . . . . . . . . . 3 2 Experiment and data 5 2.1 Background measurements and use of vacuum . . . . . . . . . . . . . . . . 5 2.2 Polystyrene versus CsI. A neutral matrix for powder pellet samples . . . . 6 2.3 Phonon excitations in α-quartz from far to mid infrared . . . . . . . . . . . 9 Conclusion 10 1
  3. Introduction The interaction of light with matter and the numerous

    associated spectroscopy tech- niques are the predominant ways to learn and understand solid state, given the time and space scales at issue, when simulation and ab-initio calculations as well advanced as they are, face some limits in terms of efficiency. Besides electronic structures, vibrations of molecules in gases or liquid and phonons in solids are great center of interest for un- derstanding macroscopic behaviour of matter. They can be described theoretically by Quantum Mechanics and Group Theory which both allow to classify matter thanks to its symmetries. But the vibrations can be experimentally probed, notably thanks to infrared spectroscopy. In this work, one will present the basic principles of this technique and the use of the Fourier transform infrared spectrometer for vibrations identifications and implied chemical characterizations. 1 Theoretical background on infrared spectroscopy 1.1 Absorption and vibrational modes A molecule is an electrically neutral set of atoms which are strongly linked together through the covalent chemical bonds involving electrons. The atoms and their valence electrons follow particular symmetry so that a molecule of N atoms has a specific 3- dimensional symmetry. The molecules are not rigid and the covalent bond can be modelled as a spring with force constant f, between two masses m1 and m2 . This system of reduced mass µ = m1 m2 /(m1 + m2 ) can vibrate in various ways in space. Not including the 3 translational and 3 rotational degrees of freedom in 3-dimensional space, the complex vibrations of a non-linear molecule of N atoms can be described by 3 × N − 6 vibrational modes, called normal modes, which correspond to either stretching or bending motions. The vibration frequency is expressed in wavenumber ν as follows: ¯ ν = 1 2πc f µ (1) These vibrations change the relative positions of the atoms with respect to each other so that the barycentre of the partially positive and partially negative atoms does no longer coincide with the center of symmetry of the molecule. As a matter of fact, the covalent chemical bond consists in sharing of pairs of electrons between atoms but the charge carriers are not symmetrically distributed between atoms and therefore the latter become partially charged. Hence, the dipole moment changes and varies with the deformation vibrations. Infrared (IR) spectroscopy consists in radiating molecules with light of wavelength ranging from 0.8 to 1000 µm in order to induce vibrational transitions and collect the transmitted light which has not been absorbed by the targeted sample. One of the se- lection rules of absorption of a radiation by a molecule is that the dipole moment has to be non zero. Therefore, linear molecules which have no out-of-plane vibrational modes, in other words which are only able to in-axis stretching deformation vibrations such as for example oxygen O2 , are called infrared inactive since they can not be revealed by IR spectroscopy. 1
  4. An absorption spectrum consist in showing the portions of light

    that have excited vibrational modes of the sample. Vibrational spectroscopy usually refers to excited modes as the wavenumber of the absorbed light. Transmitted light is measured and represented as a function of wavenumber (equation 1). This quantity, expressed in cm−1, is directly proportional to the energy of the corresponding exicted vibrational modes. 1.2 Optical conductivity through optical density Contrary to gas in which at low density molecules can be taken individually, molecules in solid state matter are bond all together. Vibrations can no longer be conceived as single molecule motions. The atoms form long chains and the vibrations are propagating waves due to relative displacement of atoms. Quantum mechanics describe these vibrations as the motion of quasi-particles called phonons. Light (photons) as an propagating electro- magnetic field can interact with matter through scattering with electrons and phonons. Therefore transmission of light is directly linked the the inherent properties of the sample, measured by the following quantities:    ˜ n(ω) = n(ω) + iκ(ω), the refractive index ˜ σ(ω) = σ1 (ω) + iσ2 (ω), the optical conductivity ˜ ε(ω) = ε1 (ω) + iε2 (ω), the dielectric function (2) which are linked together through the dielectric function by: ε1 (ω) = n2 − κ2 = 1 − 4π ω σ2 (ω) (3a) ε2 (ω) = 2nκ = 4π ω σ1 (ω) (3b) Our measurements are done in transmission. For an incident beam I0 (ω) and a trans- mitted one It (ω) with respect to a sample, the remaining fraction of light neither absorbed nor reflected is called the transmittance and is defined as: T(ω) = It (ω) I0 (ω) (4) It is related to the reflected R(ω) and absorbed D(ω) part by the following expression: T(ω) = [1 − R(ω)]2 D(ω) 1 − R(ω)2D(ω)2 where    R(ω) = (n−1)2+κ2 (n+1)2+κ2 D(ω) = e−α(ω)d (5) The absorption coefficient α(ω) appearing above depends on the material and thus on the quantities displayed in the set of equations 2. It can be written as: α(ω) = ωε2 (ω) c0 n(ω) (6) A commonly used quantity derived from T is the so called optical density Od (ω), which reads: 2
  5. Od (ω) = −ln[T(ω)] (7) Equation 5 together with equation

    7 taken for negligible reflectivity (i.e., R(ω) 1) allows to approach the optical density such that, using the properties of the logarithm, it comes: Od (ω) = ln (1 − R(ω))(1 + R(ω)D(ω)) [1 − R(ω)]2D(ω) R 1 −ln [D(ω)] (8) Finally, using the definition of the absorption D in equation 5, the related coefficient α in equation 6 and the above result (equation 8), one obtains that the optical density Od is proportional to the imaginary part ε2 of the dielectric function ε, or equivalently, as shown in equation 3b, to the real part σ1 of the optical conductivity σ. Therefore, a measurement in transmission can give insight to the optical conductivity of a material. 1.3 Set-up: Fourier Transform Infrared Spectrometer FTIR Light source He-Ne gas laser Movable mirror Beam Splitter Sample chamber Detector DLATGS Fixed mirror Interferometer (ceramic) Figure 1: Scheme of the optics of the Fourier Transform Infrared Spectrometer (FTIR) showing the optical path which is modulated by a movable mirror (whose modulations are monitored by a highly coherent He-Ne laser) leading to the merging of two beams with phase modulation called the interferogram. This interfering beam is focused on the sample which absorbs parts of the beam. The transmitted interferogram beam is then collected by a DLATGS (KBr) detector. The whole set-up is driven by a software which computes a the Fourier transform of the gathered interferogram leading to a spectrum of measured light intensity with respect to the wavenumber ¯ ν characteristic of the transmitted energy and thus to the absorbed frequencies. The light source is a Silicon carbide electrically heated up (globar) whose emission is based on the black body radiation, governed by the Planck’s law (equation 9) which gives the amount of energy emitted by a black body in radiation of a certain wavelength, or equivalently wavenumber ¯ ν. B¯ ν (T) = 2hc2¯ ν 1 e hc¯ ν kBT − 1 (9) 3
  6. The incident light onto the sample does not directly come

    from the source. Firstly, the beam passes through a Michelson interferometer. A beamsplitter directs ideally half of the beam on a flat stationary mirror while the second part is reflected by a moving mirror. The latter is maintained in back and forth movement at a constant velocity, inducing variable optical path and thus variable phase shift for this part of the beam. As the emitted light is poorly coherent, the interferometer is monitored by a He- Ne laser, highly coherent light, very sensitive to the displacement of the mirror and the optical path shift it induces. Then, the two beams are reflected back and recombined by the beamsplitter where they interfere constructively and destructively, forming an interferogram. From then on, this beam (of approximately 50% of intensity with respect to the radiating source lamp) is focused on a sample, exciting available vibrational modes through absorption processes in order to be finally collected (as a transmitted beam) by a detector and sent to a computer-driven analysis software. The interferogram, modulated by the variation of optical path (length) in the interfer- ometer, is lacking of components that are related to the absorbed energy by the excitation of vibrational modes. It is numerically treated through Fast Fourier Transform giving in output a spectrum as a function of wavenumber (reciprocal length). The excited vibra- tional modes are then deduced, giving a precise insight into the molecules in the sample as well as in the chambers of the spectrometer. 4
  7. 2 Experiment and data 2.1 Background measurements and use of

    vacuum Transmission measurements requires the precise knowledge of both incident and transmit- ted beams with respect to the probed sample (equation 4). For each set-up and optical configuration, we need to know the absorption in background which may alter I0 and It . The whole set-up can work in vacuum thanks to pumps that evacuate the chambers from ambient gases. Figure 2 depicts the incident intensity in air (blue) or in vacuum (black). One sees immediately that some frequencies are absorbed when in air whereas they remain when in condition of low pressure. Therefore the ambient gases present before pumping has absorbed part of the incident beam. Air is composed of around 78% of nitrogen N2 , 21% of oxygen O2 and 1% of other gases such as, besides monoatomic rare gases, mainly the mentioned CO2 and H2 O. The measurements are very sensitive to the presence of gases such as these two whose symmetry and vibrational modes induce changes in dipole moment. As mentioned in section 1.1 on page 1, molecules with no dipole moments do not interact with light. Therefore, symmetrical and linear molecules like N2 and O2 (or any diatomic molecules of the same chemical element) can stretch along their bond axis, keeping a zero dipole moment. 100 99 RATIO (%) 0.4 0.3 0.2 0.1 INTENSITY (arb. units) 7000 6000 5000 4000 3000 2000 1000 WAVENUMBER (cm-1 ) air vacuum fit (Planck's law) stretching bending stretching bending CO2 H2 O(g) H2 O(l) stretching overtone combination H2 O(l) Figure 2: Spectra of the black body emission radiation of the source lamp XXX. The blue line correspond to a measurement performed when the spectrometer was still filled with air, whereas the black line shows the same reference measurement but in vacuum. The red line is a fit of the black line and gives insight of the temperature of the emitting source, which has been evaluated at T = 1164 K. The topmost plot represents the ratio between two measurements done in vacuum separated by a few minutes. 5
  8. On the topmost part of figure 2, the ratio between

    two successive measurements done in vacuum is displayed and is equal to 100 ± 0.5%. This shows great reproducibility of the measurements in the range of interest. The drops at various ¯ ν values in the vacuum spectrum with respect to the Planck’s law of black body radiation (equation 9) may originate for a large part from the optics placed into the beam path before the detector and for a smaller part from remaining gas or liquid species. The spectrum of air (blue) shows strong absorption at 667.26 cm−1 and at 2360 cm−1 which corresponds to bending and stretching of CO2 molecules respectively. The doublet shape centred at 2349 cm−1 corresponds to the Stokes- and anti-Stokes-shifts which comes from the fact that the excited mode originate from photons which has lost or gained energy from previous interaction. To take it as an example, carbon dioxide is a linear molecule composed of three atoms (two oxygen atoms each doubly bond to one central carbon atom). It presents 3×3−5 = 4 different vibrational modes which are schemed in figure 3. Only the modes illustrated in figures 3b, 3c and 3d are infrared active since they induce changes in the dipole momentum of the molecule. The latter two are degenerated and have the vibration energy 667.26 cm−1. (a) Symmetric stretching (b) Asymmetric stretching (c) In-plane bending (d) Out-of-plane bending Figure 3: Vibrational modes of carbon dioxide CO2 composed of two stretching modes and two bending modes defined as in-plane and out-of-plane scissoring. Full circles are carbon atoms and empty ones depicts oxygen atoms. The irregular groups of lines approximately ranging from 1250 cm−1 to 2100 cm−1 and from 3400 cm−1 to 4000 cm−1 correspond to the absorption of vibrational modes of water H2 O, bending (lower energy demanding) and stretching (higher energy demand- ing)respectively. The signal at around 5300 cm−1 seem to be tabulated as a combination of vibrational modes from, as linear combinations of the three previously mentioned modes1 2.2 Polystyrene versus CsI. A neutral matrix for powder pellet samples Vibrational modes of three samples are proposed to be investigated: a polystyrene thin film, a pellet of pure CsI and one with powder of α-quartz embedded. In order to ex- press the transmittance of the samples, measurements of the background with the set-up 1London South Bank University, The vibrational spectra of liquid water (http://www.lsbu.ac.uk/ water/vibrat.html) 6
  9. 100 80 60 40 20 0 TRANSMITTANCE (%) 4000 3500

    3000 2500 2000 1500 1000 WAVENUMBER (cm-1 ) C-H stretching of a benzene ring harmonics and overtone combinations of deformation vibrations skeletal vibrations of benzene rings C-H out-of-plane deformation vibrations Figure 4: Spectrum of containing only the convenient sample holder (i.e., without the polystyrene film or any pellet) are done prior to the actual transmission measurements. The polystyrene film is used for calibration purposes since it is well known either in its conception or in terms of absorption. Polystyrene is an organic polymer consisting in an alkane −(CH2 )−n chain on which every other carbon atom is bond to a benzene ring. Figure 4 shows the transmittance (defined as in equation 4 as the ratio in percent of intensities) of the polystyrene film in the interval of energy 550 cm−1 to 4000 cm−1. Starting from high energy to low energy, the spectrum gets richer in absorption lines. The peak at around 3000 cm−1 is assigned to C-H stretching of a benzene ring. Again we can see the Stokes and anti-Stokes lines. The strong oscillations from 1700 cm−1 to 2000 cm−1 correspond to harmonics and overtone combinations of deformation vibrations. A clear peak at 1600 cm−1 comes from skeletal vibrations of the benzene rings, that is to say a fundamental vibrational mode, where all C-C stretching modes of a benzene ring contribute. The oncoming peaks at lower energy may also be assigned to these skeletal vibrations. And finally the big absorption doublet at around 520 cm−1 corresponds to C-H out of plane deformation vibrations. The second sample consists in powder of CsI which has been compressed into a circular pellet of diameter around 1 cm and of thickness d, a fraction of millimetre. It is held on a metallic sample holder which again gave rise to reference measurement (background) when installed. Figure 5 depicts the calculated spectra within far infrared (figure 5a) and infrared (figure 5b) range together giving the absorption of CsI from 50 to 7000 cm−1. First, one observes that the transmitted intensity ICsI is approximately 20% smaller than the incident light. This originates from the dissipated energy within the sample in terms of absorption and scattering. Also, the transmittance decreases with increasing energy because of elastic scattering which scatters light out of the incident direction. Even though light apparently interacts with the CsI molecules, the main piece of information that comes out of these measurements is that within this spectra region, the interaction 7
  10. 2.0 1.5 1.0 0.5 0.0 INTENSITY (arb. units) 700 600

    500 400 300 200 100 WAVENUMBER (cm-1 ) 100 80 60 40 20 0 TRANSMITTANCE T (%) I0 ICsI T = ICsI / I0 FIR (a) Far infrared 0.4 0.3 0.2 0.1 INTENSITY (arb. units) 7000 6000 5000 4000 3000 2000 1000 WAVENUMBER (cm-1 ) 100 80 60 40 20 0 TRANSMITTANCE T (%) I0 ICsI T = ICsI / I0 IR (b) Mid infrared Figure 5: Spectra of the unaltered (I0) and transmitted (ICsI) beam before and after absorption by the CsI pellet in the energy range from 550 cm−1 to 7000 cm−1. The transmittance shows just a continuous decrease of intensity due to granular CsI and an overall offset due to finite sample thickness. The high absorbance at very low wavenumbers corresponds to massive vibrational modes from the heavy CsI ions. The sudden drop to the very right of the FIR range corresponds to the limit of the detector. The red line depicts the transmittance of the CsI pellet TCsI(¯ ν), showing an relatively homogeneous transmission with increasing wavenumber. 8
  11. is somewhat homogeneous: the transmittance T(¯ ν) is linear in

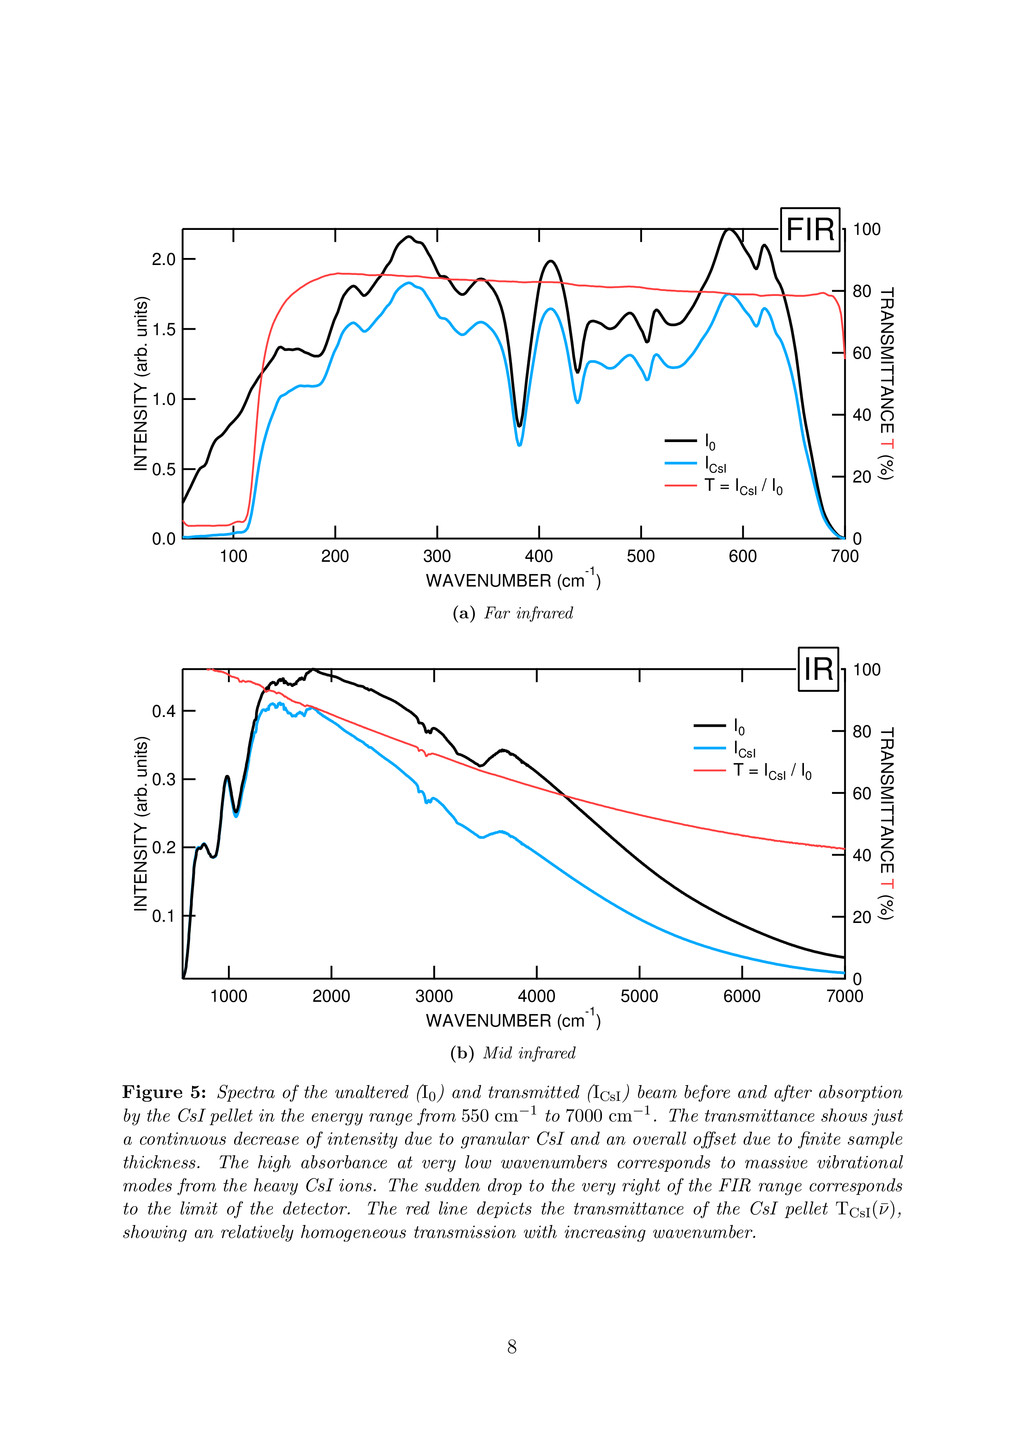
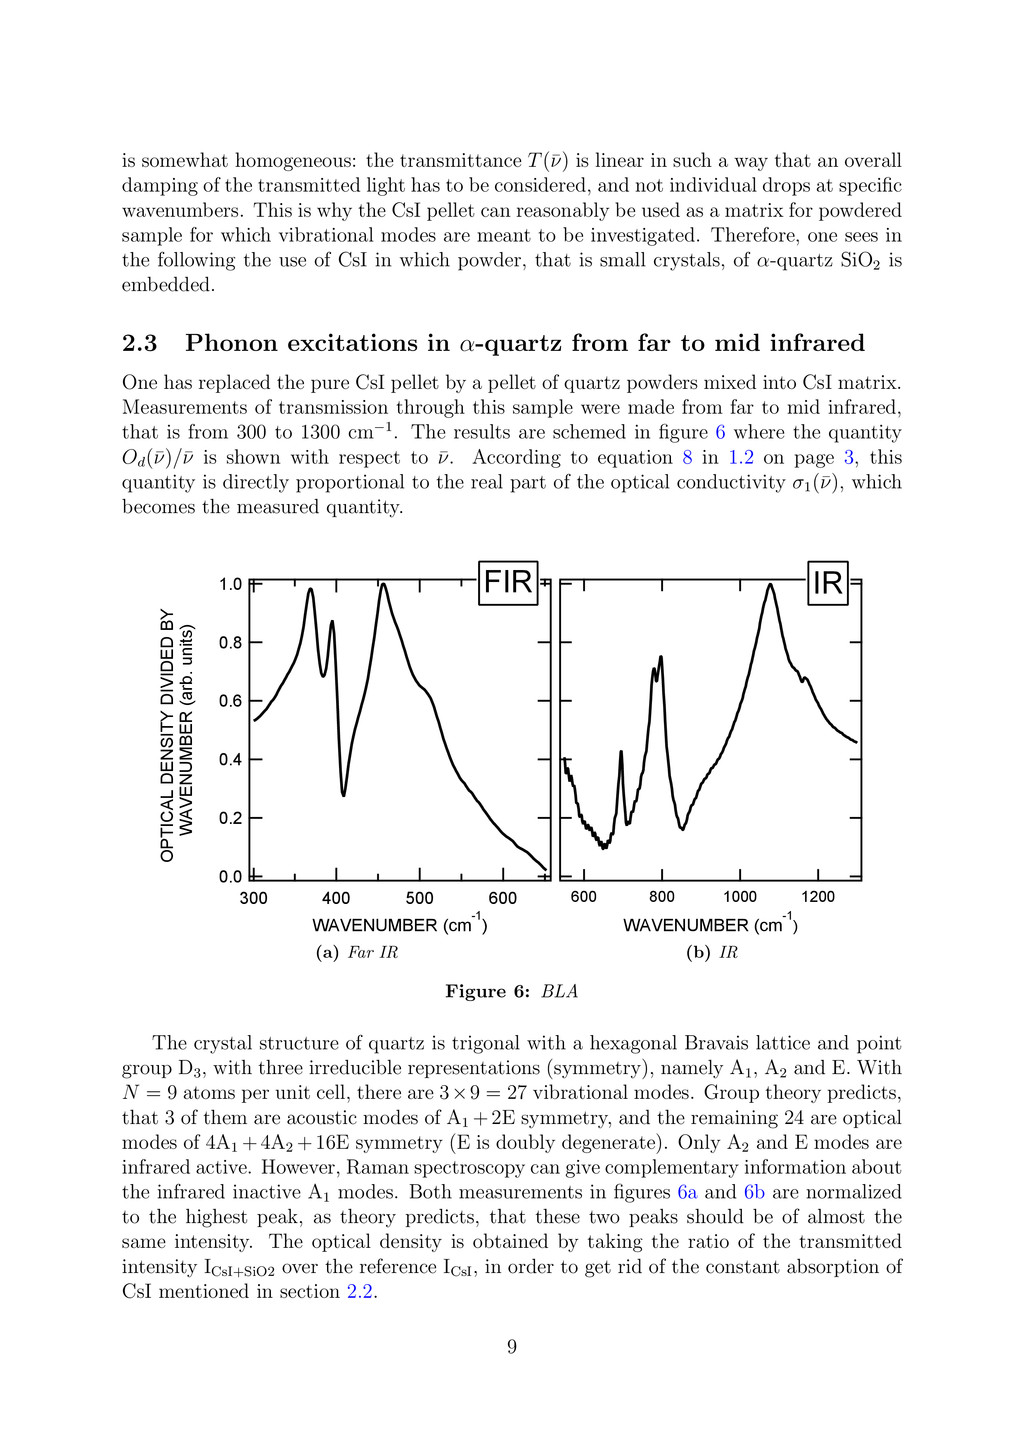
    such a way that an overall damping of the transmitted light has to be considered, and not individual drops at specific wavenumbers. This is why the CsI pellet can reasonably be used as a matrix for powdered sample for which vibrational modes are meant to be investigated. Therefore, one sees in the following the use of CsI in which powder, that is small crystals, of α-quartz SiO2 is embedded. 2.3 Phonon excitations in α-quartz from far to mid infrared One has replaced the pure CsI pellet by a pellet of quartz powders mixed into CsI matrix. Measurements of transmission through this sample were made from far to mid infrared, that is from 300 to 1300 cm−1. The results are schemed in figure 6 where the quantity Od (¯ ν)/¯ ν is shown with respect to ¯ ν. According to equation 8 in 1.2 on page 3, this quantity is directly proportional to the real part of the optical conductivity σ1 (¯ ν), which becomes the measured quantity. 1.0 0.8 0.6 0.4 0.2 0.0 OPTICAL DENSITY DIVIDED BY WAVENUMBER (arb. units) 600 500 400 300 WAVENUMBER (cm-1 ) FIR (a) Far IR 1200 1000 800 600 WAVENUMBER (cm-1 ) IR (b) IR Figure 6: BLA The crystal structure of quartz is trigonal with a hexagonal Bravais lattice and point group D3 , with three irreducible representations (symmetry), namely A1 , A2 and E. With N = 9 atoms per unit cell, there are 3×9 = 27 vibrational modes. Group theory predicts, that 3 of them are acoustic modes of A1 +2E symmetry, and the remaining 24 are optical modes of 4A1 +4A2 +16E symmetry (E is doubly degenerate). Only A2 and E modes are infrared active. However, Raman spectroscopy can give complementary information about the infrared inactive A1 modes. Both measurements in figures 6a and 6b are normalized to the highest peak, as theory predicts, that these two peaks should be of almost the same intensity. The optical density is obtained by taking the ratio of the transmitted intensity ICsI+SiO2 over the reference ICsI , in order to get rid of the constant absorption of CsI mentioned in section 2.2. 9
  12. The results are meant to be compared to the reflectivity

    measurements by F. Gervais and B. Piriou, since our displayed quantity is proportional to the imaginary part of the dielectric function ε2 . However, this only gives insight to the transverse optical phonons, which corresponds to the onset of the reflectivity. In a single crystal, the selection rules depend on the orientation of the crystal towards the incident beam. Therefore, Gervais and Piriou were able to distinguish between A2 and E modes. In total, they were able to associate 10 transverse and 10 longitudinal optical phonons. Since we are in presence of powder of quartz, the orientation of the crystals is random and therefore we have access to both A2 and E modes without real distinction. Wavenumber (cm−1) (Literature values2) A2-modes E-modes 368 (363.5) 395 (393.5) [ 1078 (1065) ] 501 (495) 457 (450) 1165 (1158) 779 (777) 696 (695) [ 1078 (1071) ] 796 (797) Table 1: Transverse optical phonons of α-quartz according to experimental data shown in figures 6a and 6b. Literature values are given in parentheses. For powder SiO2, both A2- and E-modes are seen. The value in square brackets can not be associated to either A2 or E, since the two modes are to close in energy and cannot be resolved with this measurement. The energy of the corresponding modes are depicted in table 1 which shows quite good agreement with the published results. Only the peak at 1078 cm−1 can not be associated to either A2 or E symmetry, as they lie so close that they can not be resolved with this experiment. We can also note that we obtain similar intensities of the peaks. Conclusion Together with the development of fast calculation algorithm such as the Fast Fourier Transform (FFT) and higly accurate interferometers, the old dispersive infrared spec- trometer underwent notable modifications from which arose the Fourier transform infrared spectroscopy. It is a fast and accurate technique that allow to obtain detailed information on the vibrational modes in molecules and on phonons in solids. This makes this technique at least qualitatively chemically specific, as we have seen for our background characteri- zations and for our probed samples. The selection rules of infrared spectroscopy, mainly the necessity of changes in dipole moment makes this technique well completed with Ra- man spectroscopy which can therefore give complementary information to characterize all optical phonons and vibrations. 10