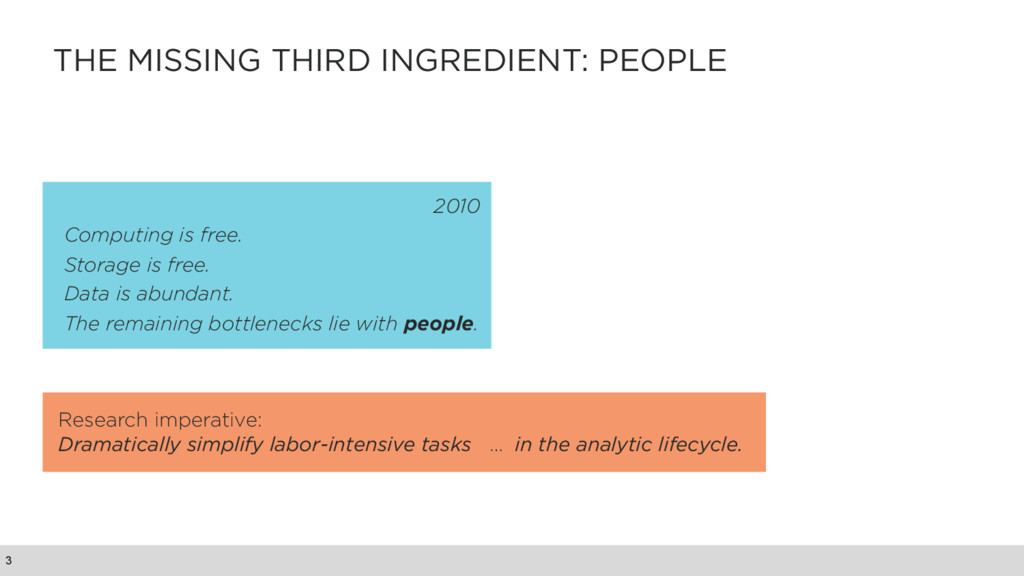
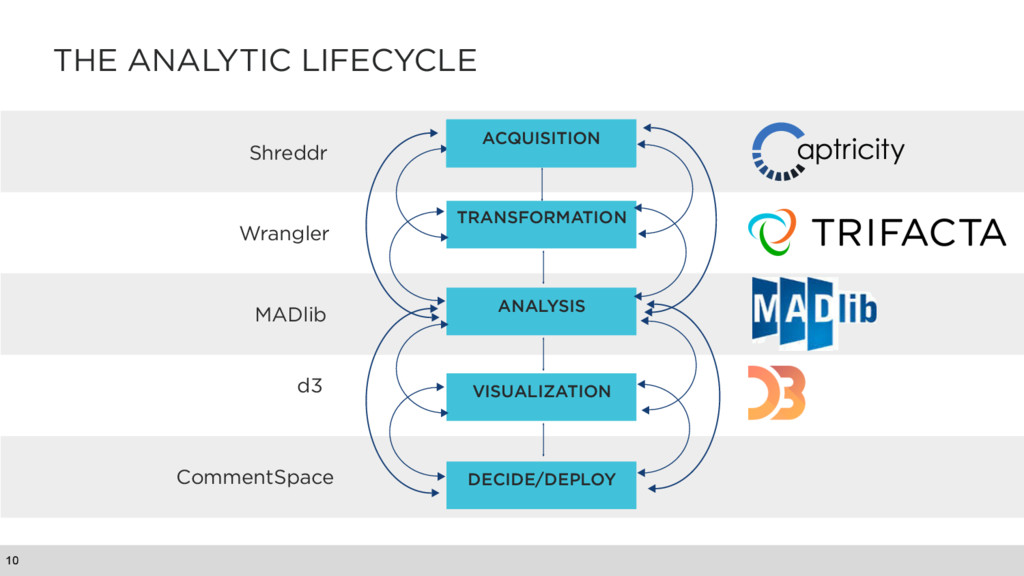
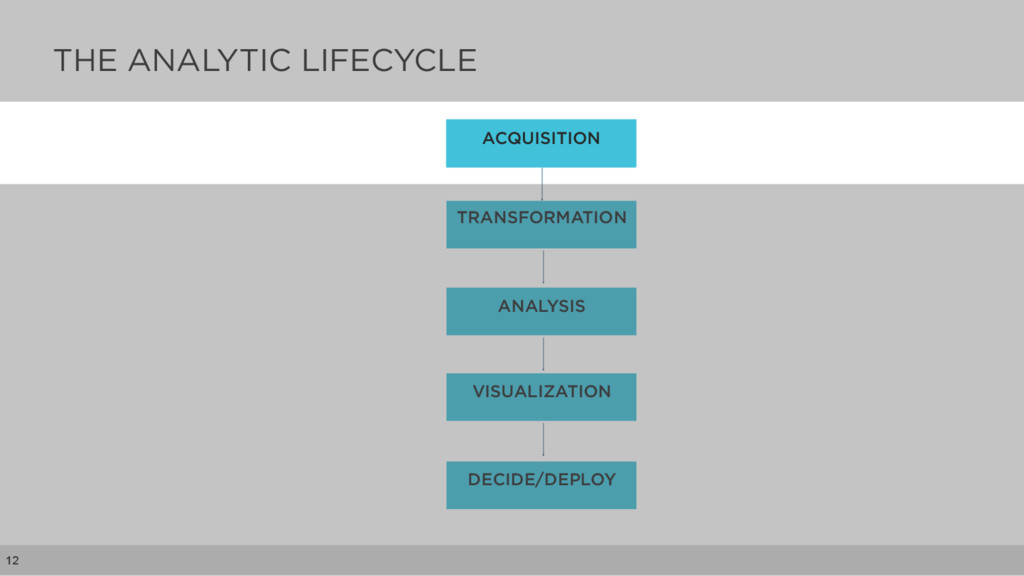
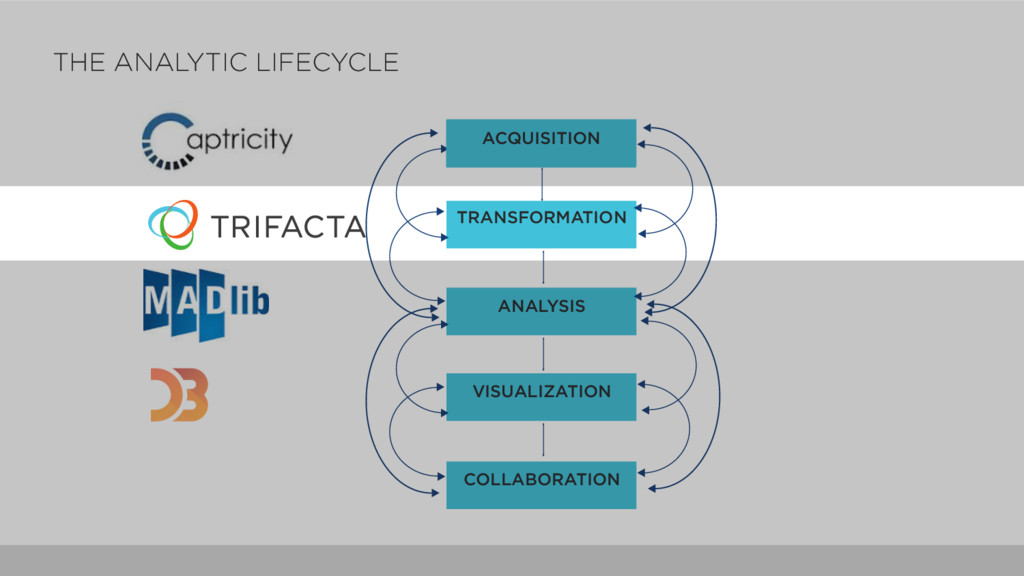
simplify labor-intensive tasks … in the analytic lifecycle. 2010 Computing is free. Storage is free. Data is abundant. The remaining bottlenecks lie with people.
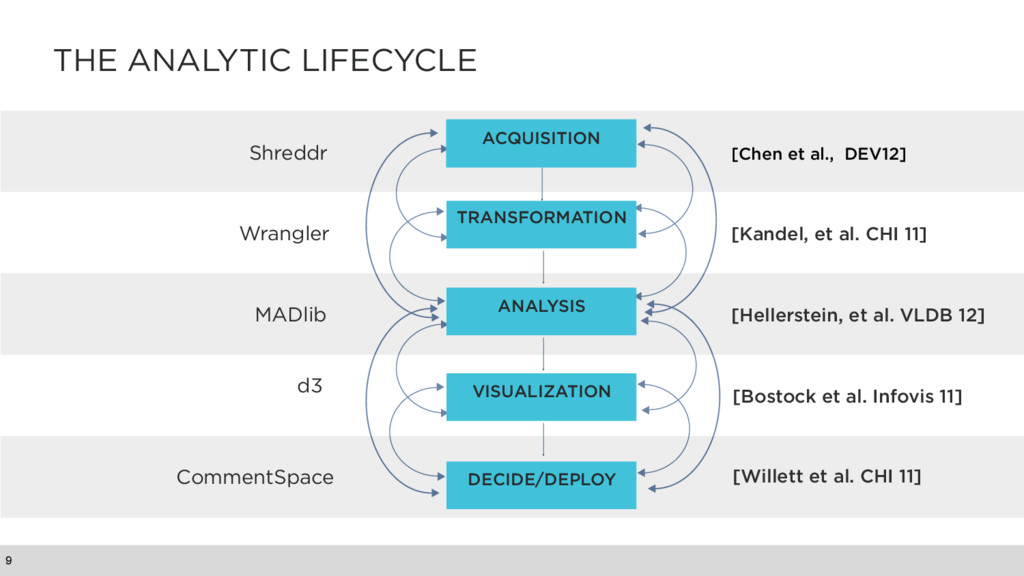
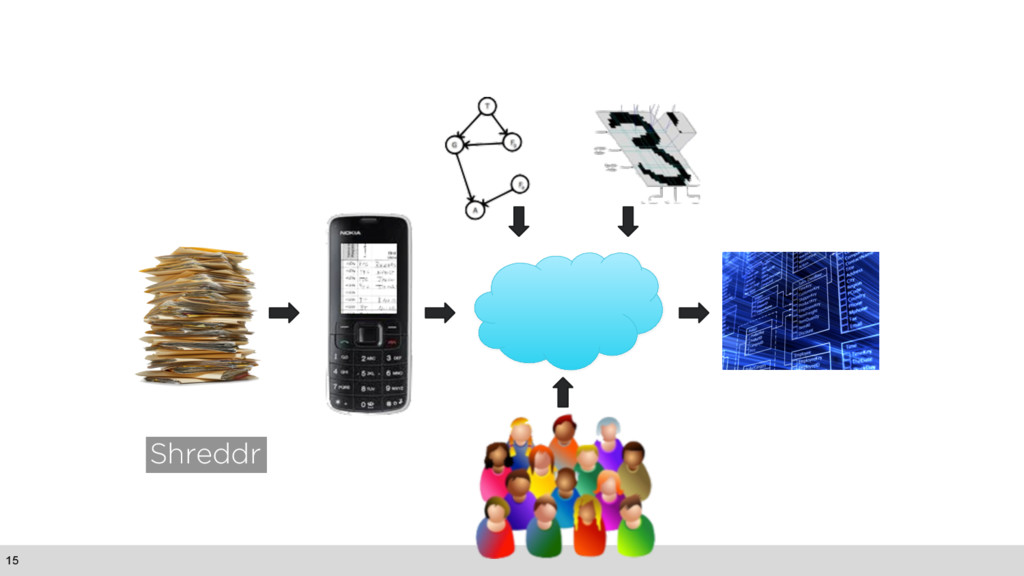
Shreddr Wrangler MADlib d3 [Chen et al., DEV12] [Kandel, et al. CHI 11] [Hellerstein, et al. VLDB 12] [Bostock et al. Infovis 11] CommentSpace [Willett et al. CHI 11]
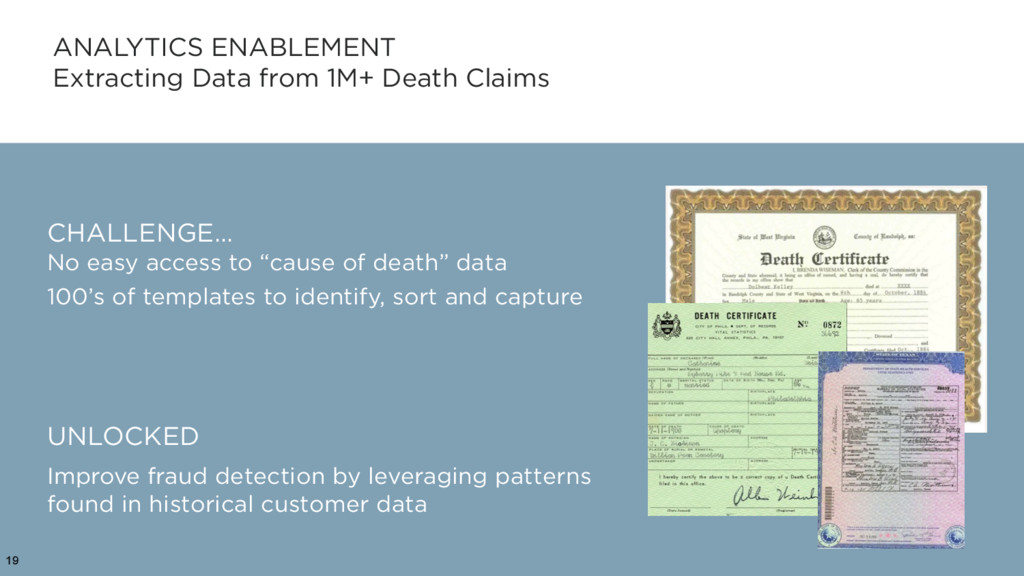
No easy access to “cause of death” data 100’s of templates to identify, sort and capture UNLOCKED Improve fraud detection by leveraging patterns found in historical customer data
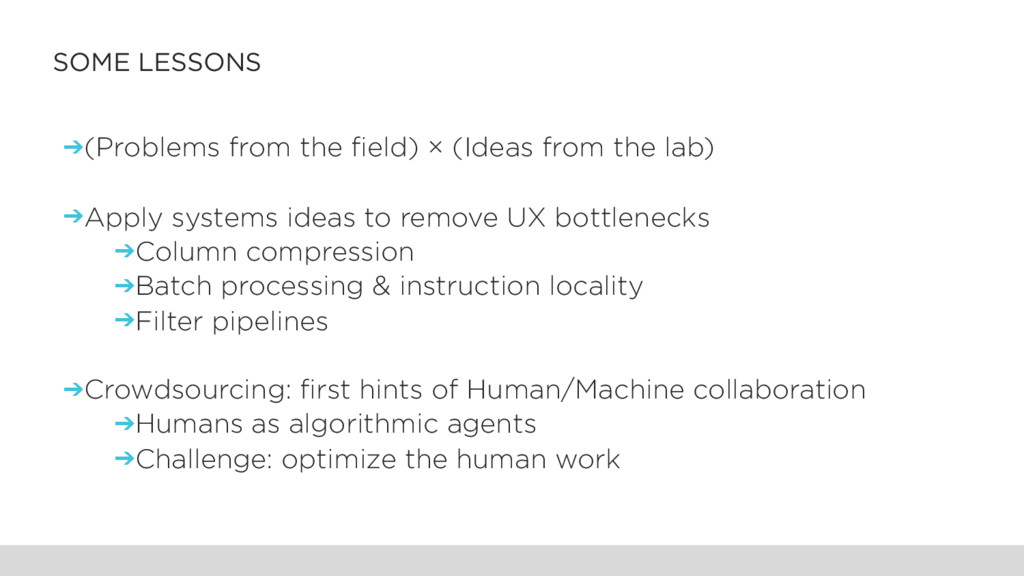
lab) ➔Apply systems ideas to remove UX bottlenecks ➔Column compression ➔Batch processing & instruction locality ➔Filter pipelines ➔Crowdsourcing: first hints of Human/Machine collaboration ➔Humans as algorithmic agents ➔Challenge: optimize the human work
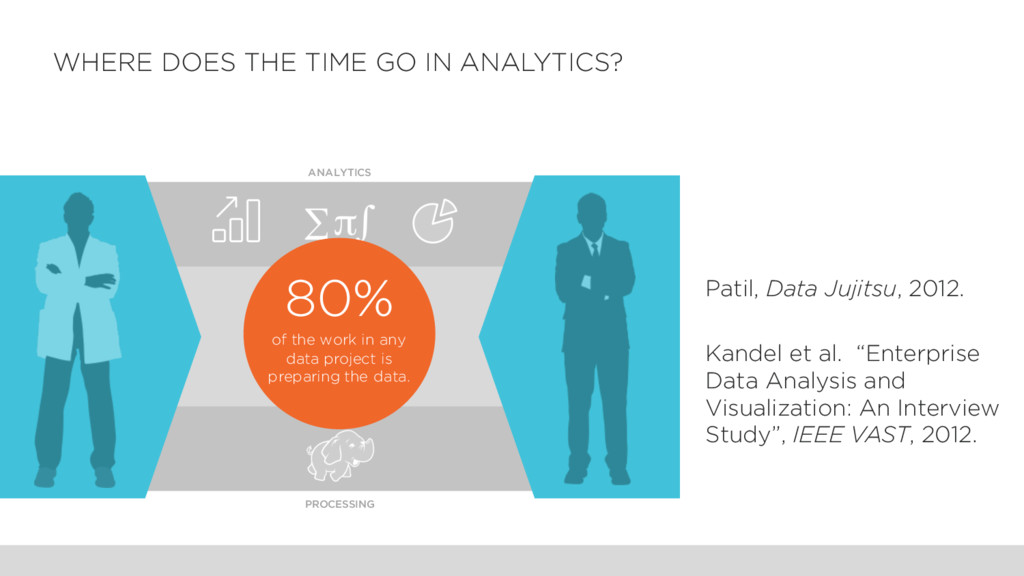
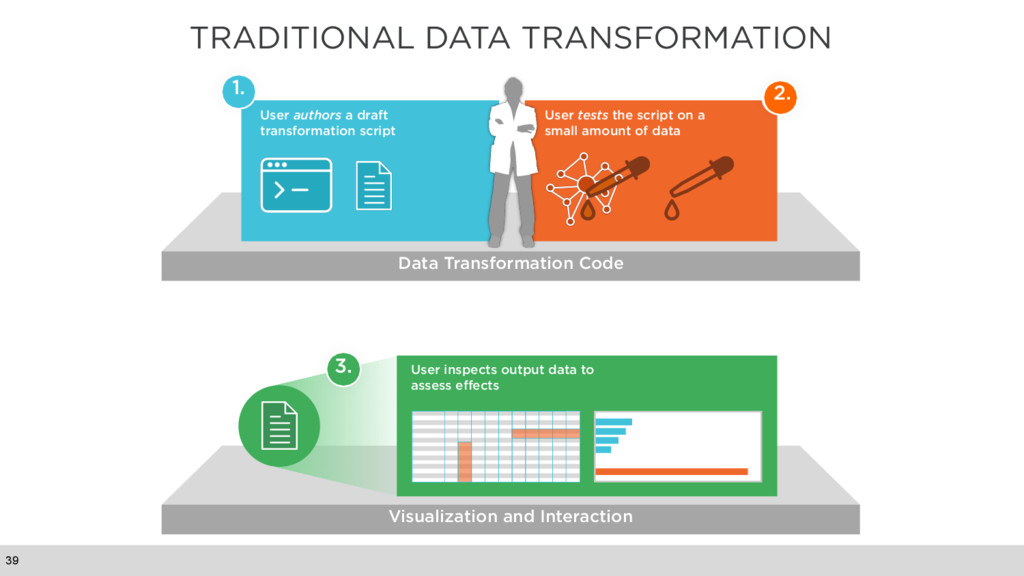
of the work in any data project is preparing the data. Patil, Data Jujitsu, 2012. Kandel et al. “Enterprise Data Analysis and Visualization: An Interview Study”, IEEE VAST, 2012.
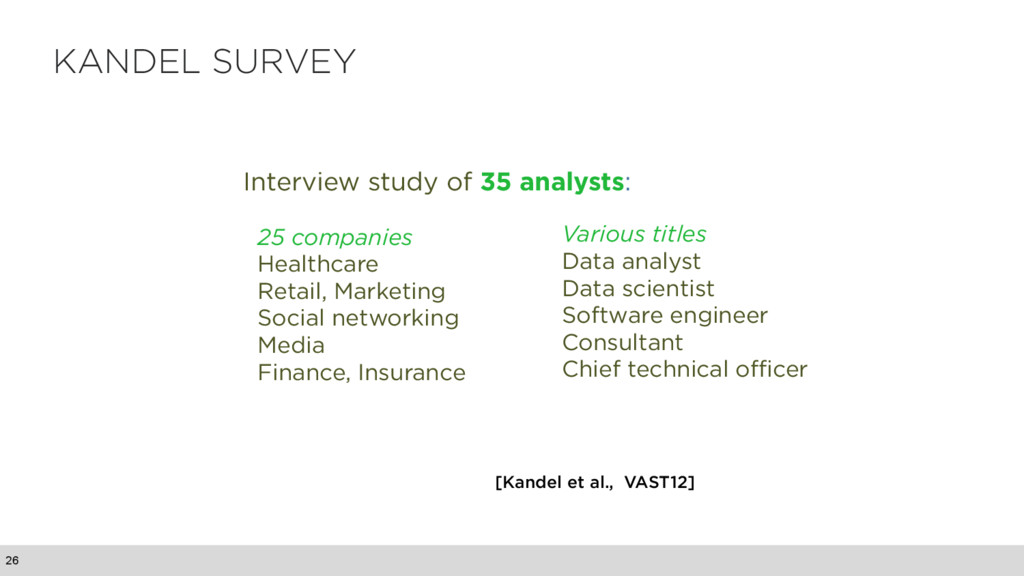
Social networking Media Finance, Insurance Various titles Data analyst Data scientist Software engineer Consultant Chief technical officer [Kandel et al., VAST12] KANDEL SURVEY 26
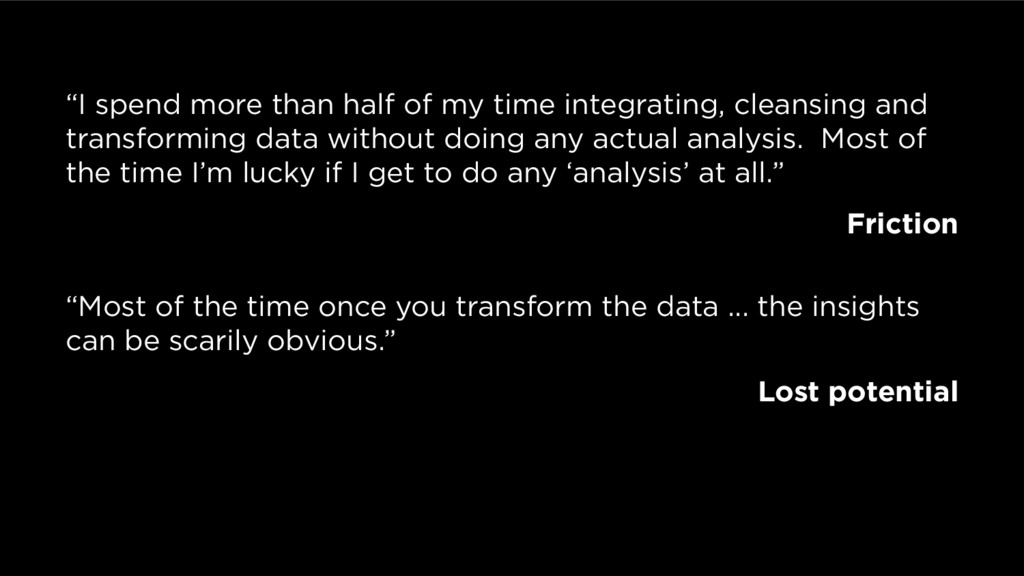
and transforming data without doing any actual analysis. Most of the time I’m lucky if I get to do any ‘analysis’ at all.” Friction “Most of the time once you transform the data ... the insights can be scarily obvious.” Lost potential
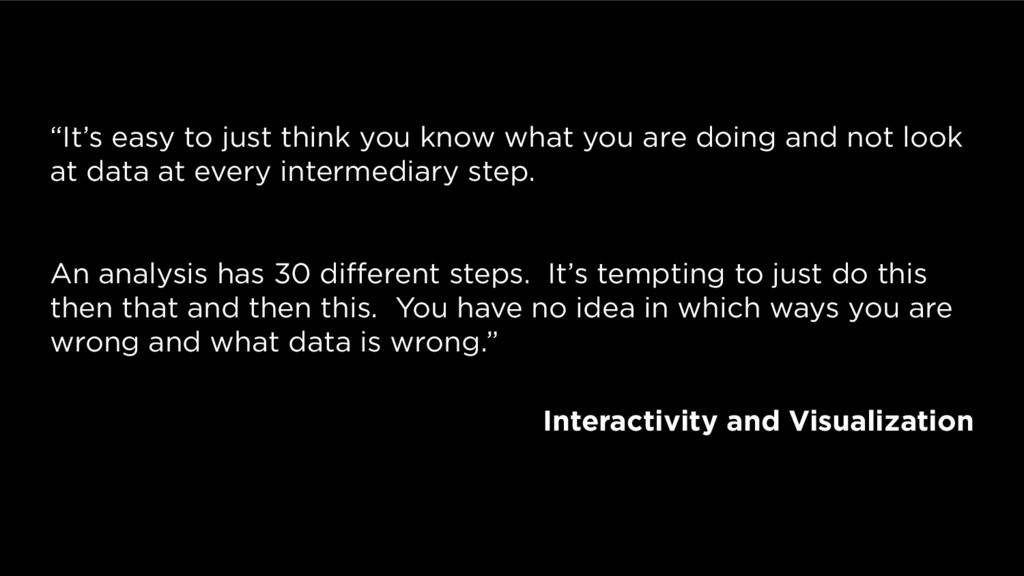
doing and not look at data at every intermediary step. An analysis has 30 different steps. It’s tempting to just do this then that and then this. You have no idea in which ways you are wrong and what data is wrong.” Interactivity and Visualization
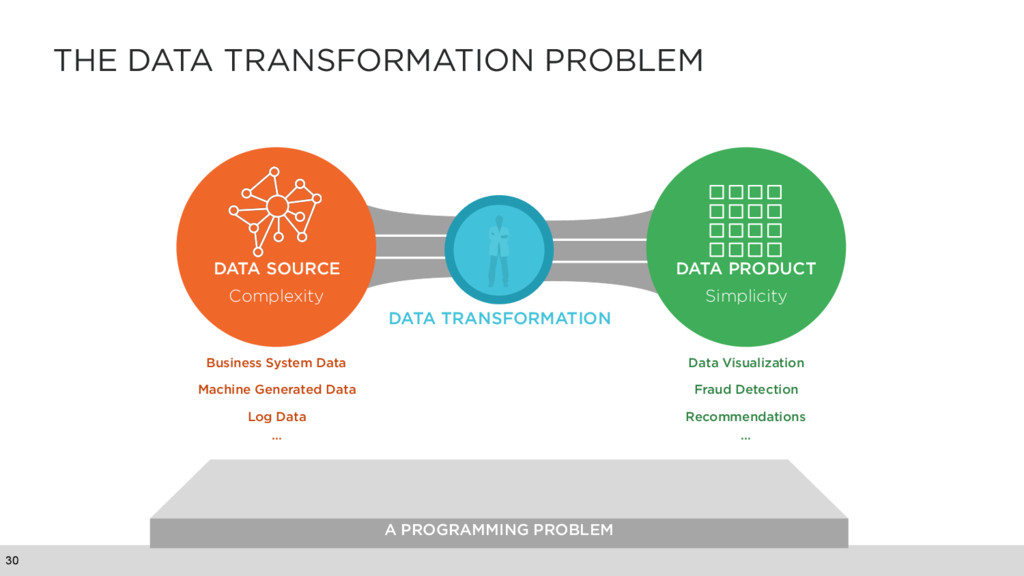
Business System Data Machine Generated Data Log Data Data Visualization Fraud Detection Recommendations DATA SOURCE Complexity DATA PRODUCT Simplicity … …
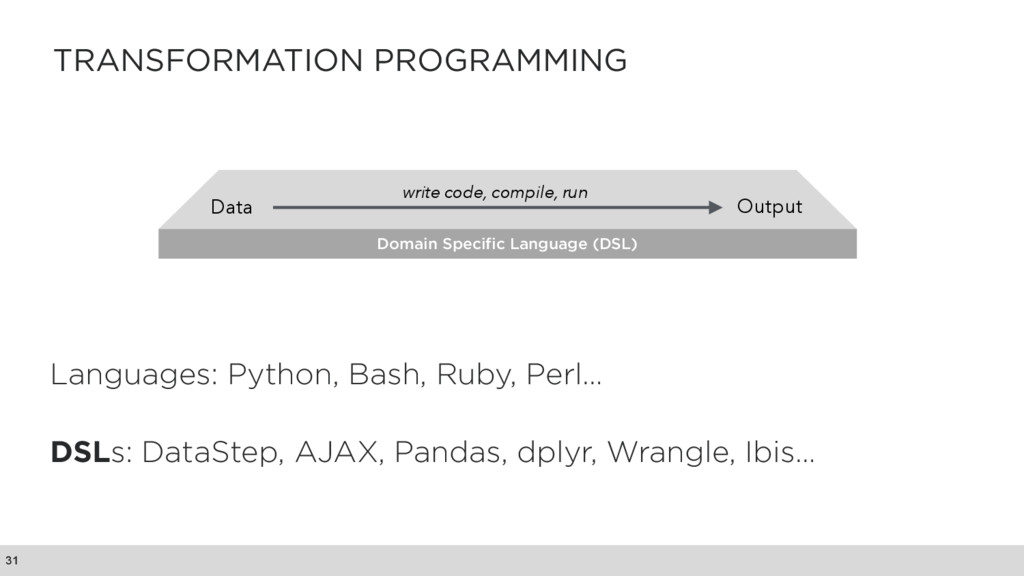
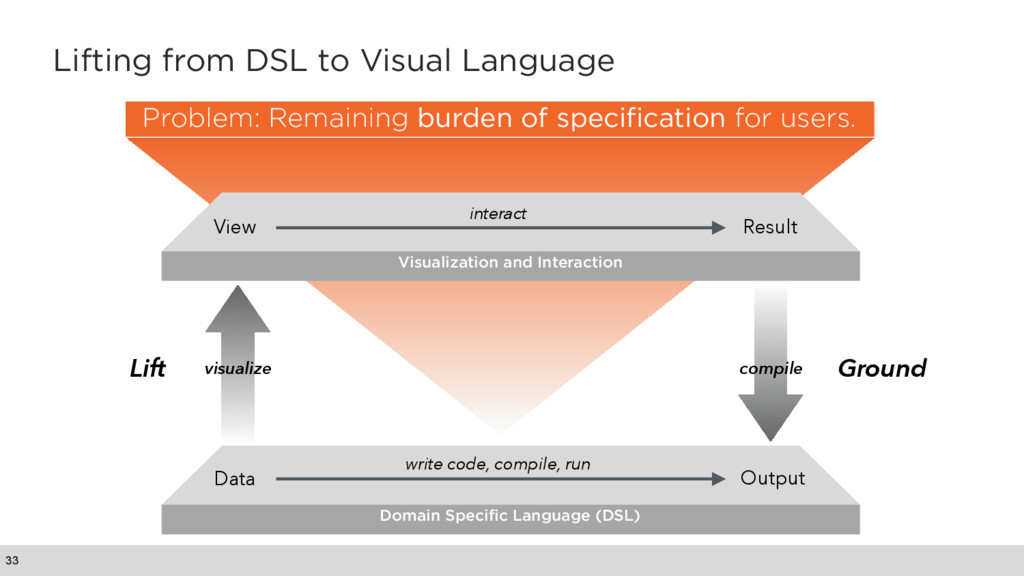
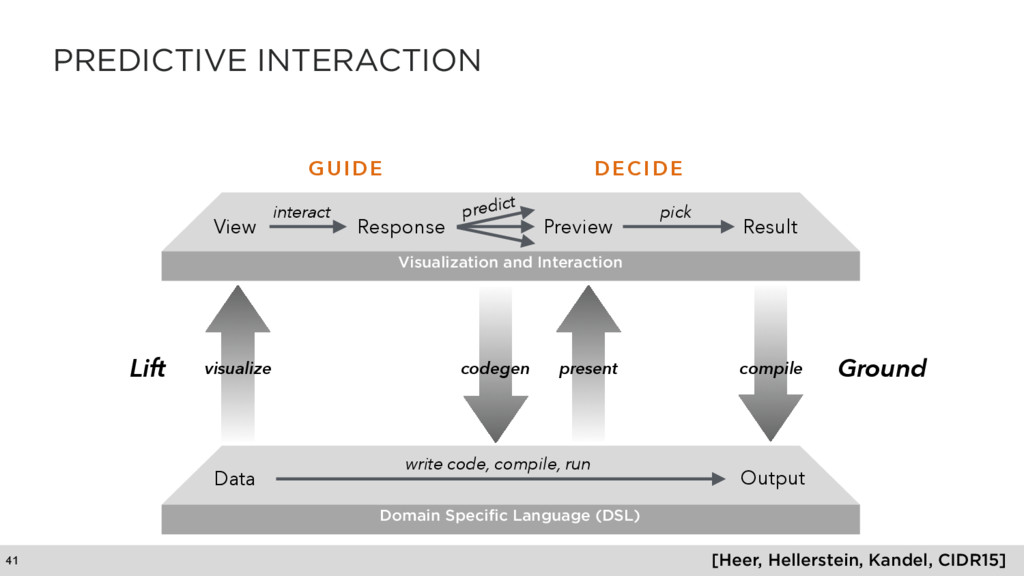
(DSL) Data Output write code, compile, run Visualization and Interaction View Result visualize interact Lift Ground compile Problem: Remaining burden of specification for users.
[Guo, et al. UIST11] ➔ Automatic inference of transforms ➔ Predictive preview of results ➔ Interactive history ➔ User Studies http://vis.stanford.edu/wrangler
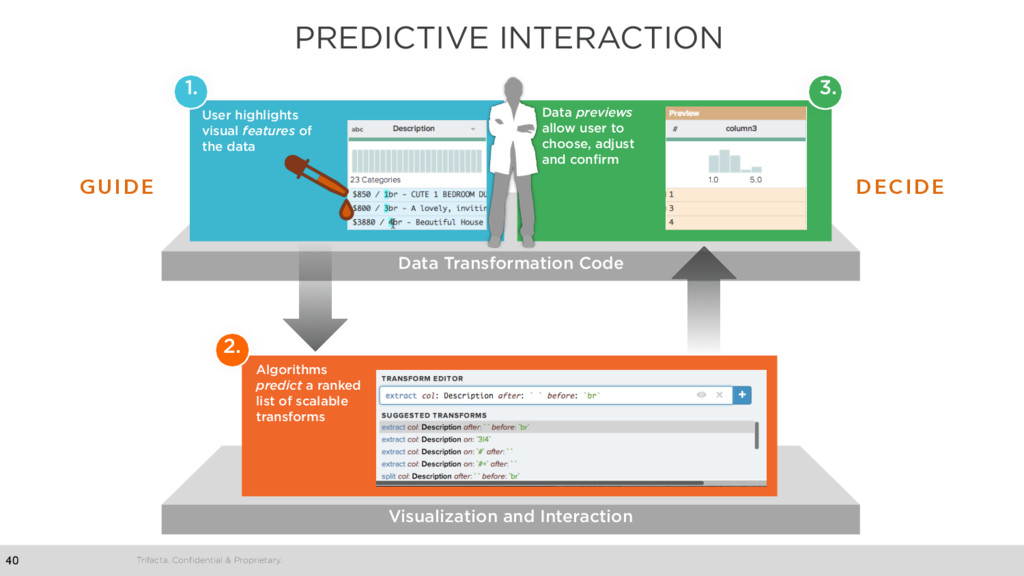
Data Transformation Code User highlights visual features of the data Data previews allow user to choose, adjust and confirm Algorithms predict a ranked list of scalable transforms 1. 3. 2. GUIDE DECIDE
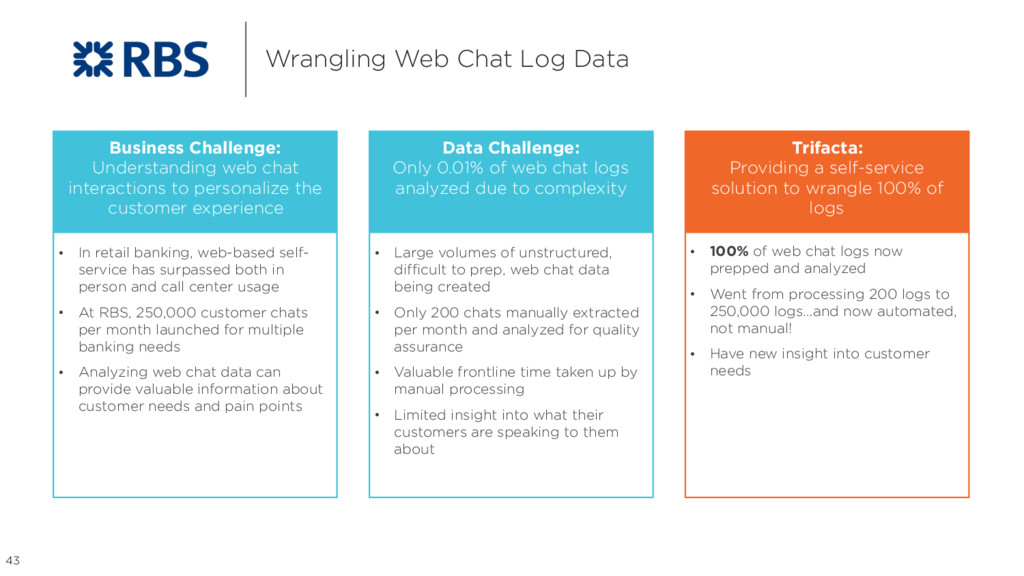
chat interactions to personalize the customer experience Data Challenge: Only 0.01% of web chat logs analyzed due to complexity • Large volumes of unstructured, difficult to prep, web chat data being created • Only 200 chats manually extracted per month and analyzed for quality assurance • Valuable frontline time taken up by manual processing • Limited insight into what their customers are speaking to them about • In retail banking, web-based self- service has surpassed both in person and call center usage • At RBS, 250,000 customer chats per month launched for multiple banking needs • Analyzing web chat data can provide valuable information about customer needs and pain points Trifacta: Providing a self-service solution to wrangle 100% of logs • 100% of web chat logs now prepped and analyzed • Went from processing 200 logs to 250,000 logs…and now automated, not manual! • Have new insight into customer needs
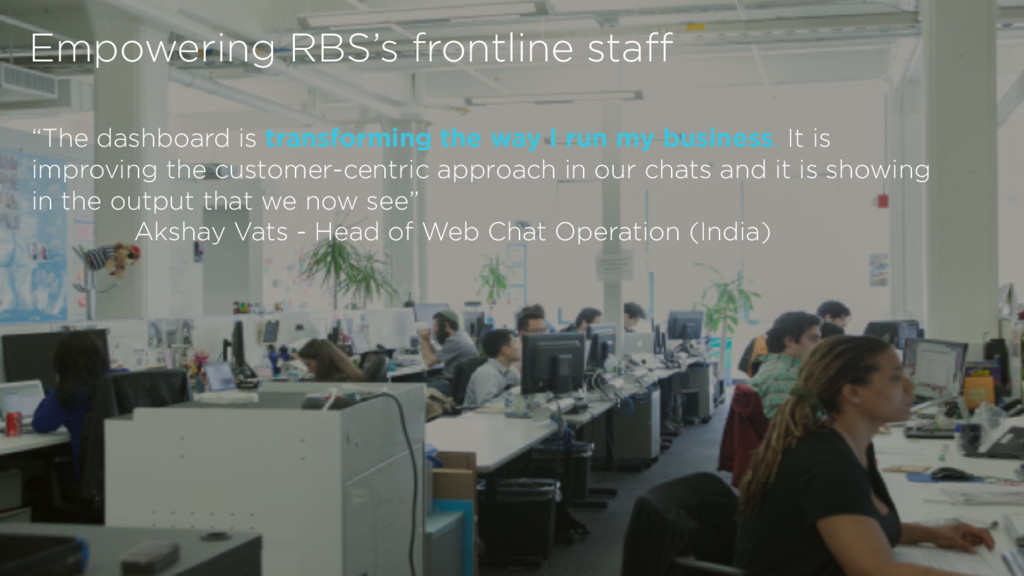
The classification of this document is PUBLIC. “The dashboard is transforming the way I run my business. It is improving the customer-centric approach in our chats and it is showing in the output that we now see” Akshay Vats - Head of Web Chat Operation (India) Empowering RBS’s frontline staff
for AI-assisted, human-driven tasks ➔DSLs at the center ➔A formal “narrow waist” ➔Targetable to multiple runtimes ➔Provides a modest, factored search space for learning & prediction ➔Interactive Profiling ➔Continuous data vis feedback during transformation ➔Data profile qua data interface
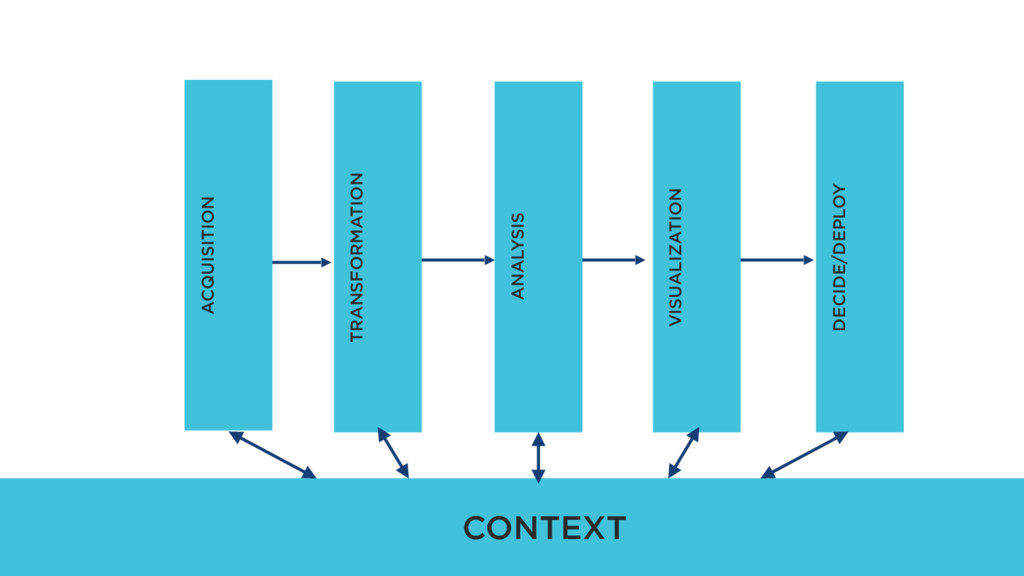
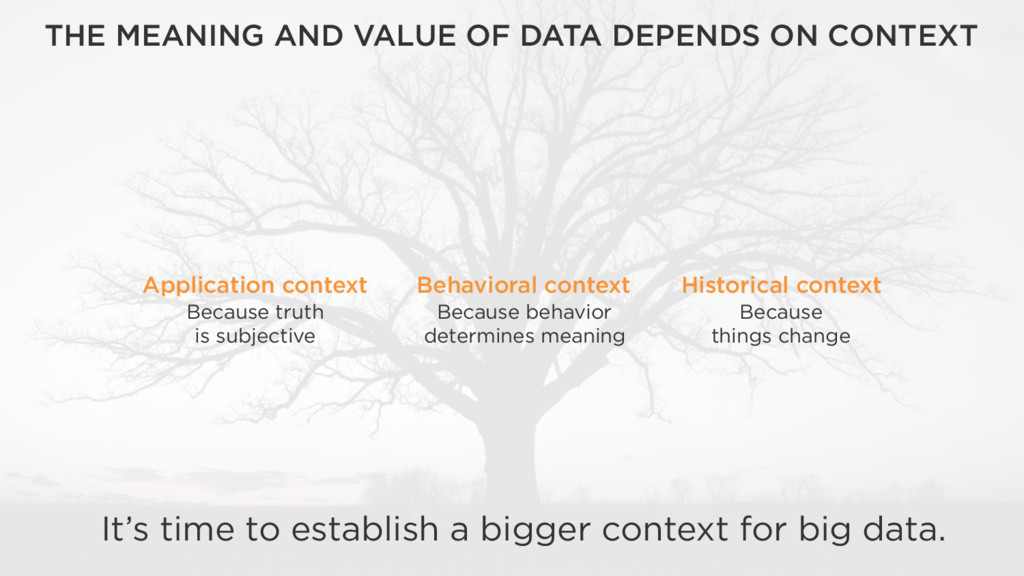
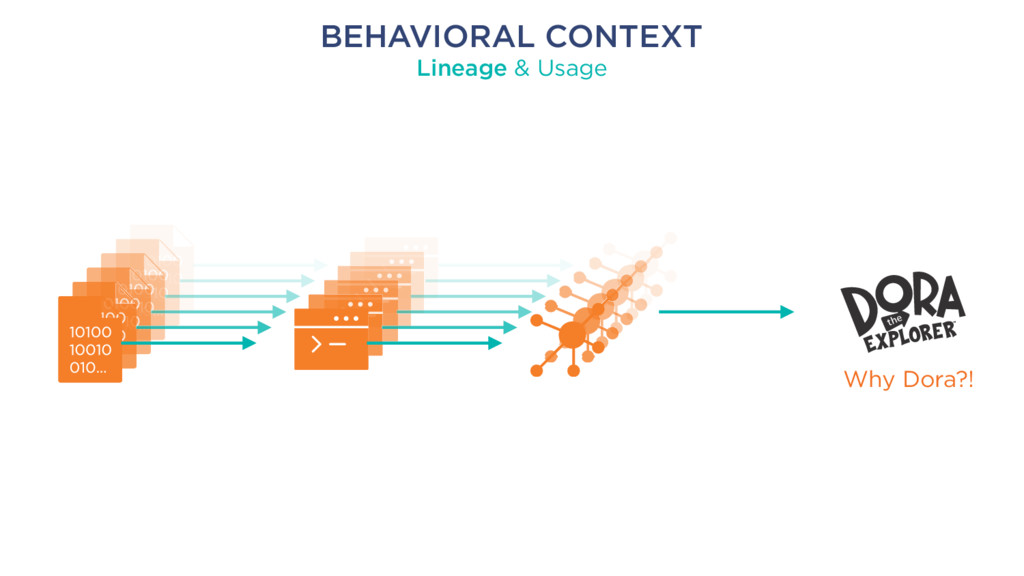
Historical context Because things change Behavioral context Because behavior determines meaning Application context Because truth is subjective THE MEANING AND VALUE OF DATA DEPENDS ON CONTEXT
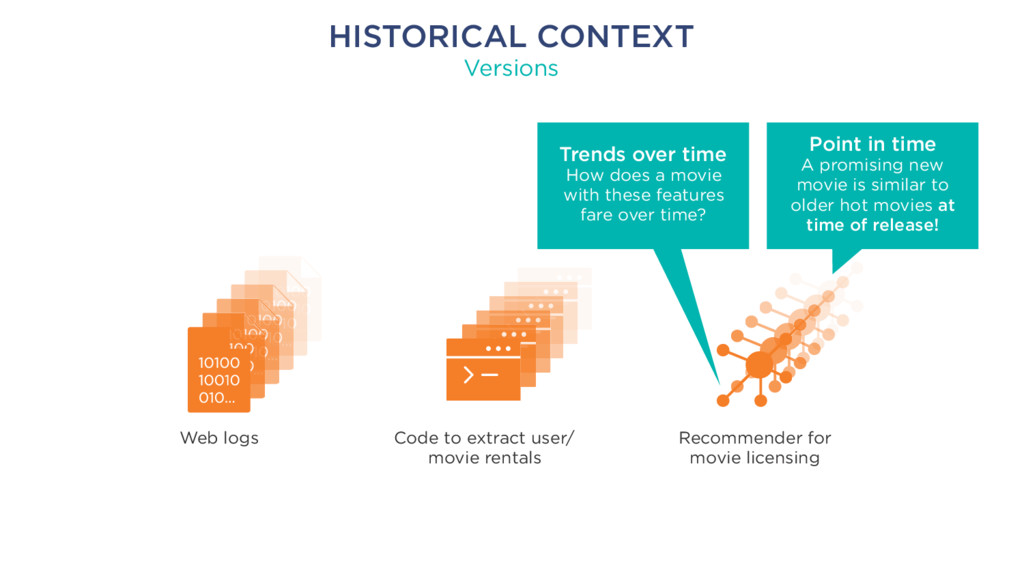
rentals Recommender for movie licensing Point in time A promising new movie is similar to older hot movies at time of release! Trends over time How does a movie with these features fare over time?
Data Science Recommenders “You should compare with book sales from last year.” Curation Tips “Logistics staff checks weather data the 1st Monday of every month.” Proactive Impact Analysis “The Twitter analysis script changed. You should check the boss’ dashboard!”
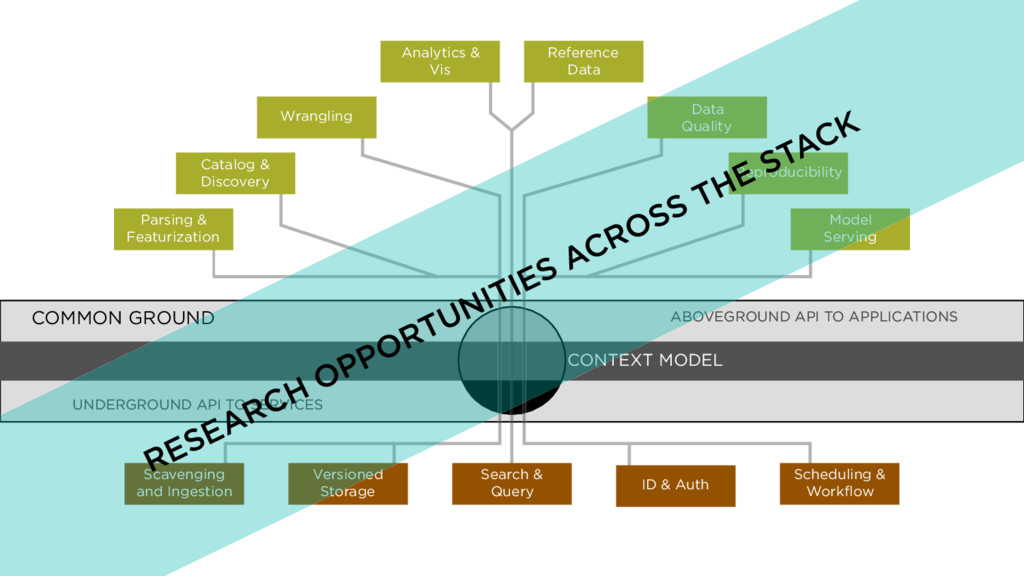
COMMON GROUND Parsing & Featurization Catalog & Discovery Wrangling Analytics & Vis Reference Data Data Quality Reproducibility Model Serving Scavenging and Ingestion Search & Query Scheduling & Workflow Versioned Storage ID & Auth
COMMON GROUND Parsing & Featurization Catalog & Discovery Wrangling Analytics & Vis Reference Data Data Quality Reproducibility Model Serving Scavenging and Ingestion Search & Query Scheduling & Workflow Versioned Storage ID & Auth ABOVEGROUND API TO APPLICATIONS UNDERGROUND API TO SERVICES RESEARCH OPPORTUNITIES ACROSS THE STACK
![WRANGLER (2011): ADD INTELLIGENCE 38 [Kandel, et al. CHI 11]](https://files.speakerdeck.com/presentations/36f861eafce34e8684dfe6932991a6cc/slide_37.jpg)
![@joe_hellerstein [email protected]](https://files.speakerdeck.com/presentations/36f861eafce34e8684dfe6932991a6cc/slide_68.jpg)