Upgrade to Pro — share decks privately, control downloads, hide ads and more …

Visualizing Cloud Architectures in Real Time with d3.js

jng
November 12, 2019

Visualizing Cloud Architectures in Real Time with d3.js

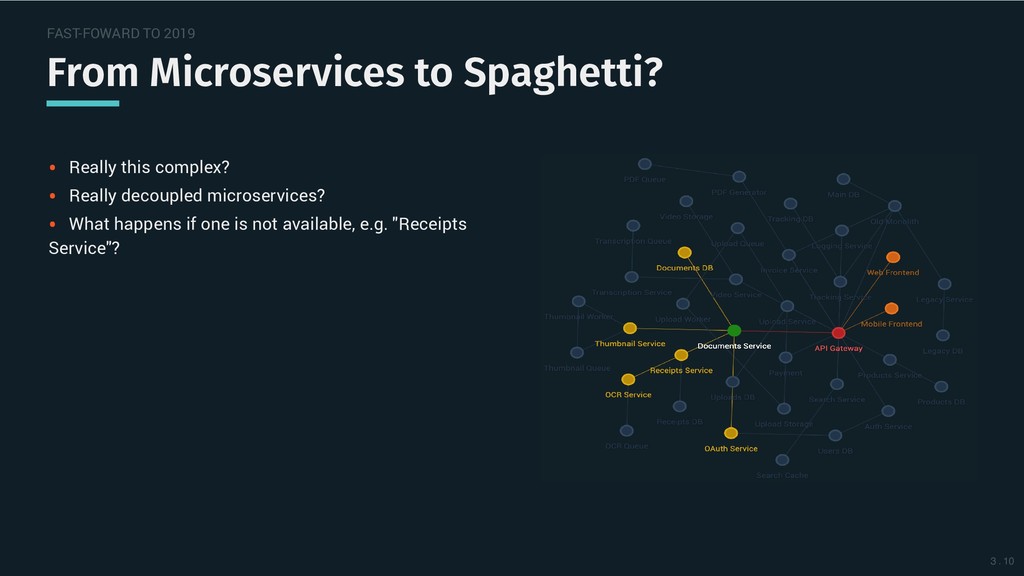
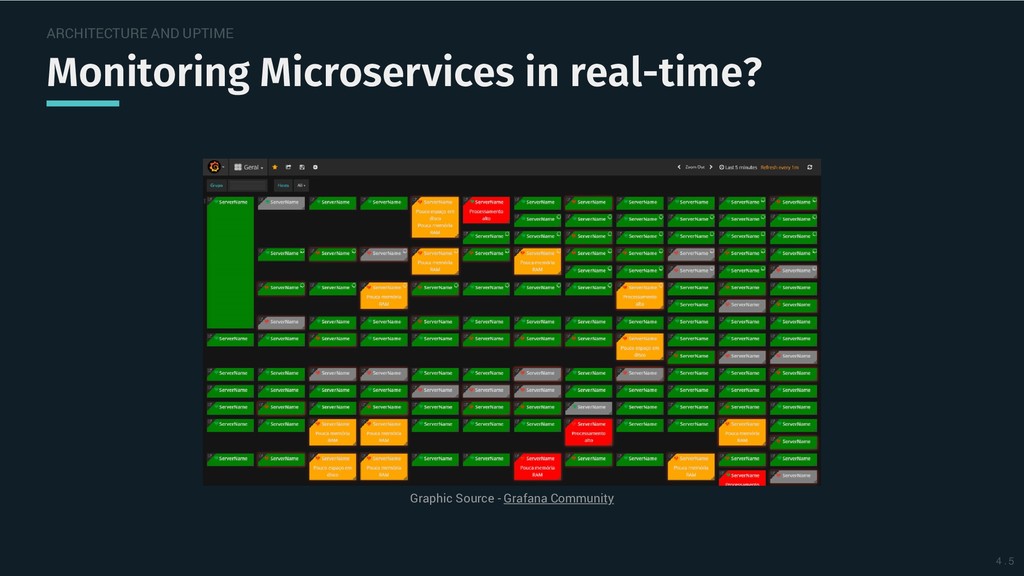
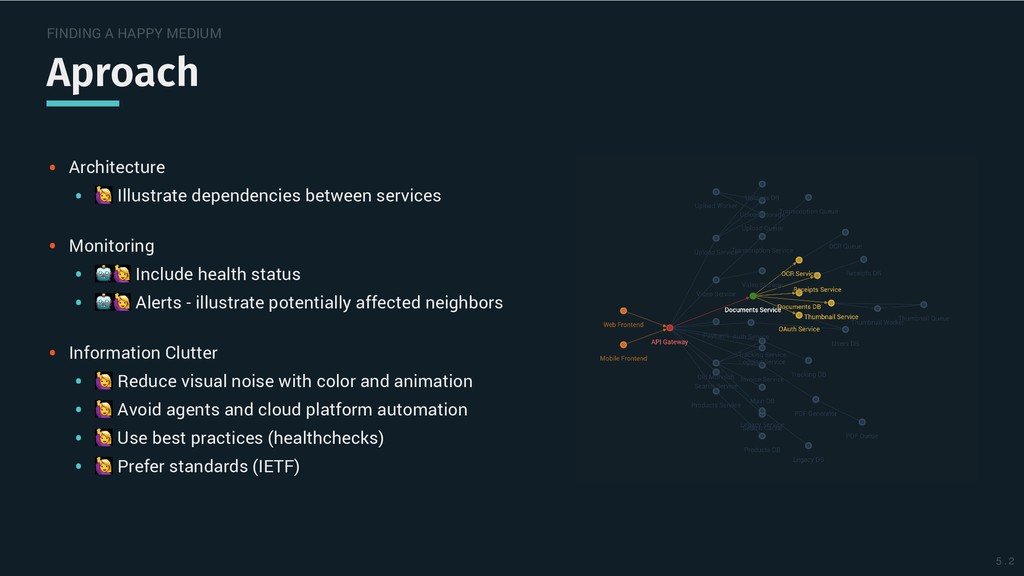
If you have multiple development teams, your cloud architecture probably feels organic changing with agile development cycles. We may ship faster and scale faster. But we can also get lost more easily as complexity grows. Automated monitoring tools come at the price of information overload.

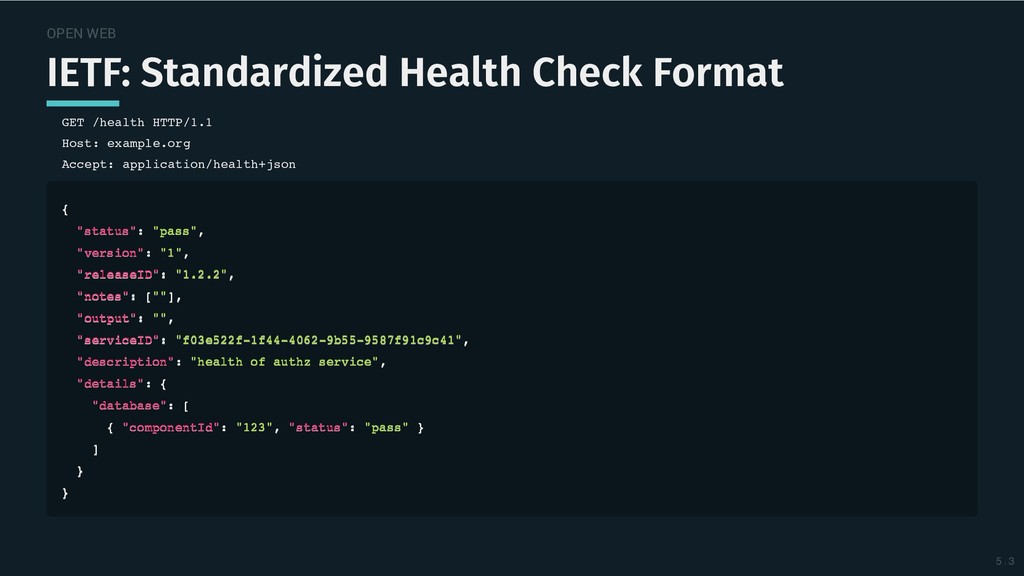
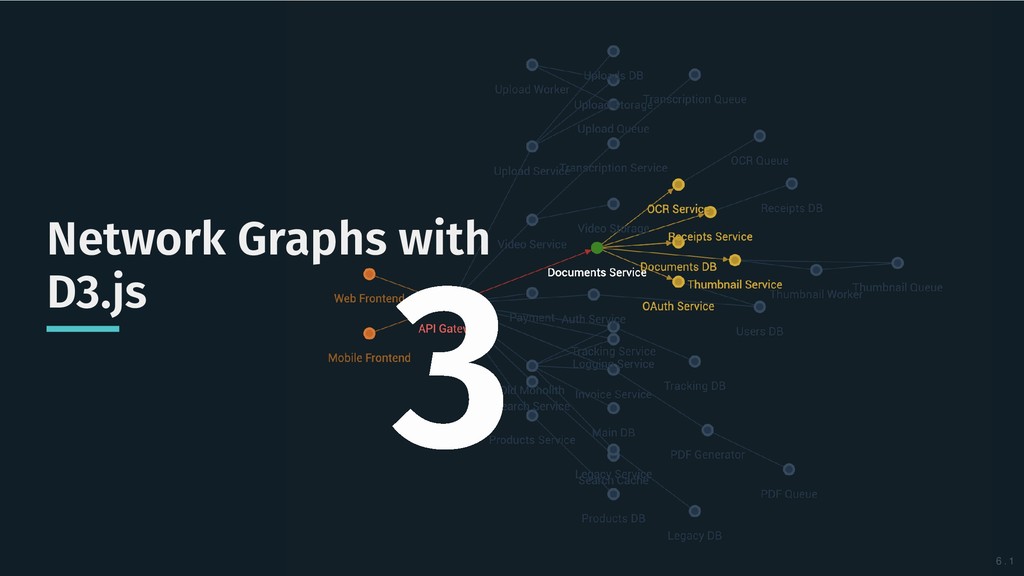
Let’s bring some clarity back into the picture by filtering out the technical noise to see how cloud architectures were designed to behave. We’ll create our our own microservice architecture visualization frontend using d3.js. Then we’ll integrate some backend monitoring, sprinkle in some animation with JS and CSS, and voilà – we can watch how our architecture dances – in real time!

jng

November 12, 2019
Tweet

More Decks by jng

Other Decks in Programming

Transcript

  1. Visualizing Cloud Architectures in Real Time with Visualizing Cloud Architectures

    in Real Time with d3.js d3.js Julie Ng Cloud Solution Architect, Microsoft NodeConf EU Kilkenny, Ireland 12 November 2019 • • 1
  2. WHO AM I Julie Ng Julie Ng Cloud Solution Architect

    at Microsoft Previously Enterprise Architect at Allianz Germany Making for the web since 1999 Photo: Climbing in Rovinj, Croatia • • • • 2
  3. Welcome to the Cloud Welcome to the Cloud From monoliths

    to microservices From monoliths to microservices and beyond and beyond 1 3 . 1
  4. DOWNSTREAM SERVICES Microservices from the ground Microservices from the ground

    Azure Blob Storage App Products Search Invoices PDF Service Invoices App Queue Invoices DB 3 . 7
  5. FAST-FOWARD TO 2019 Challenges of Microservices Challenges of Microservices Remote

    Service Client CDN Service Service Service Service Microservices Management Service Discovery API Gateway Static Content Identity Provider Source: Microsoft Azure: Introduction to microservices architectures 3 . 8
  6. NOT INFALLIBLE Availability: even the Cloud goes down Availability: even

    the Cloud goes down SLA % Downtime per week Downtime per month Downtime per year 99 1.68 hours 7.2 hours 3.65 days 99.9 10.1 minutes 43.2 minutes 8.76 hours 99.99 1.01 minutes 4.32 minutes 52.56 minutes 99.999 6 seconds 25.9 seconds 5.26 minutes Source: How do you as a developer handle unavailability? How does this affect your customers, product, and company? What is cost of downtime? Microsoft: Service Level Agreements for Azure • • • 3 . 9
  7. FAST-FOWARD TO 2019 From Microservices to Spaghetti? From Microservices to

    Spaghetti? Really this complex? Really decoupled microservices? What happens if one is not available, e.g. "Receipts Service"? • • • 3 . 10
  8. TAKEAWAY #1 Cloud is complex and not perfect Cloud is

    complex and not perfect Neither are we ;-) Neither are we ;-) 3 . 11
  9. How do you How do you Document Document Architecture? Architecture?

    What did we What did we intend intend to build? to build? 2 4 . 1
  10. ARCHITECTURE DOCUMENTATION Traditional Architecture Diagrams Traditional Architecture Diagrams Classic diagrams

    Show intent But very static Not real-time. Quickly outdated. What do arrows indicate? Dependencies? Data Flow? Diagram Source - • • • • • • • Scalable Web Application Reference Architecture 4 . 2
  11. ARCHITECTURE DOCUMENTATION Diagramming with Code Diagramming with Code const const

    data data = = { { nodes nodes: : [ [ { { id id: : 'web' 'web', , label label: : 'Web Frontend' 'Web Frontend' } }, , { { id id: : 'mobile' 'mobile', , label label: : 'Mobile Device' 'Mobile Device' } }, , { { id id: : 'server' 'server', , label label: : 'Monolith Backend' 'Monolith Backend' } }, , { { id id: : 'db' 'db', , label label: : 'Database' 'Database' } }, , ] ], , links links: : [ [ { { source source: : 'web' 'web', , target target: : 'server' 'server' } }, , { { source source: : 'mobile' 'mobile', , target target: : 'server' 'server' } }, , { { source source: : 'server' 'server', , target target: : 'db' 'db' } } ] ] } } 4 . 3
  12. ARCHITECTURE DOCUMENTATION Automated Architecture Diagrams Automated Architecture Diagrams Graphic Source

    - Microsoft Azure: Application Map: Triage Distributed Applications 4 . 4
  13. ORGANIZATIONS - DIVERSE Reality – many chaotic teams, but diverse

    Reality – many chaotic teams, but diverse 4 . 7
  14. Conway's Law Conway's Law “ Organizations which design systems... are

    constrained to produce designs which are copies of the communication structures of these organizations. - Melvin Conway, "How Do Committees Invent?” Datamation (April 1968). 4 . 8
  15. TAKEAWAY #2 Computers are useless. Computers are useless. They only

    give you answers. They only give you answers. – PABLO PICASSO 4 . 9
  16. Let's build our own Let's build our own Architecture Architecture

    Visualization Visualization What did we What did we intend intend to design? to design? 3 5 . 1
  17. FINDING A HAPPY MEDIUM Aproach Aproach Architecture Illustrate dependencies between

    services Monitoring Include health status Alerts - illustrate potentially affected neighbors • • • • • 5 . 2
  18. FINDING A HAPPY MEDIUM Aproach Aproach Architecture Illustrate dependencies between

    services Monitoring Include health status Alerts - illustrate potentially affected neighbors • • • • • 5 . 2
  19. FINDING A HAPPY MEDIUM Aproach Aproach Architecture Illustrate dependencies between

    services Monitoring Include health status Alerts - illustrate potentially affected neighbors Information Clutter Reduce visual noise with color and animation Avoid agents and cloud platform automation Use best practices (healthchecks) Prefer standards (IETF) • • • • • • • • • • 5 . 2
  20. OPEN WEB IETF: Standardized Health Check Format IETF: Standardized Health

    Check Format GET /health HTTP/1.1 Host: example.org Accept: application/health+json { { "status" "status": : "pass" "pass", , "version" "version": : "1" "1", , "releaseID" "releaseID": : "1.2.2" "1.2.2", , "notes" "notes": : [ ["" ""] ], , "output" "output": : "" "", , "serviceID" "serviceID": : "f03e522f-1f44-4062-9b55-9587f91c9c41" "f03e522f-1f44-4062-9b55-9587f91c9c41", , "description" "description": : "health of authz service" "health of authz service", , "details" "details": : { { "database" "database": : [ [ { { "componentId" "componentId": : "123" "123", , "status" "status": : "pass" "pass" } } ] ] } } } } 5 . 3
  21. ARCHITECTURE Illustrating Dependencies - Visually Illustrating Dependencies - Visually Label

    Color Meaning Highlighted Node green healthy Source red has problems if referenced node is not available Deep Source orange might not be aware of Source's dependency on Referenced Node Target yellow no direct dependency 5 . 4
  22. TAKEAWAY #3 DIY - Scratch your own need DIY -

    Scratch your own need and share - make it open source ❤ and share - make it open source ❤ 5 . 5
  23. D3.JS D3 - Data Driven Documents D3 - Data Driven

    Documents D3 (or D3.js) is a JavaScript library for visualizing data using web standards. D3 helps you bring data to life using SVG, Canvas and HTML. 6 . 2
  24. D3.JS Data Driven – describe what, not how Data Driven

    – describe what, not how There are no loops over the DOM Based on data() selectAll() does it all: add, update, remove elements no DOM management Apply values to DOM attributes: cx, cy and r • • • • • • const const data data = = [ [ { { 'x' 'x': : 1.0 1.0, , 'y' 'y': : 1.1 1.1, , 'prio' 'prio': : 5 5 } }, , { { 'x' 'x': : 2.0 2.0, , 'y' 'y': : 2.5 2.5, , 'prio' 'prio': : 1 1 } }, , ] ] svg svg. .selectAll selectAll( ('circle' 'circle') ) . .data data( (data data) ) . .enter enter( () ). .append append( ('circle' 'circle') ) . .attr attr( ('cx' 'cx', , ( (d d) ) => => d d. .x x) ) . .attr attr( ('cy' 'cy', , ( (d d) ) => => d d. .y y) ) . .attr attr( ('r' 'r', , ( (d d) ) => => 10 10 / / d d. .prio prio) ) // larger circle // larger circle 6 . 3
  25. D3.JS Example Data Example Data Nodes array IDs must be

    unique Links Array source & target reference IDs references are key based not array index based • • • • • • const const data data = = { { nodes nodes: : [ [ { { id id: : 'web' 'web', , label label: : 'Web Frontend' 'Web Frontend' } }, , { { id id: : 'mobile' 'mobile', , label label: : 'Mobile Device' 'Mobile Device' } }, , { { id id: : 'backend' 'backend', , label label: : 'Monolith Backend' 'Monolith Backend' } }, , { { id id: : 'db' 'db', , label label: : 'Database' 'Database' } } ] ], , links links: : [ [ { { source source: : 'web' 'web', , target target: : 'backend' 'backend' } }, , { { source source: : 'mobile' 'mobile', , target target: : 'backend' 'backend' } }, , { { source source: : 'backend' 'backend', , target target: : 'db' 'db' } } ] ] } } 6 . 4
  26. D3.JS General Update Pattern General Update Pattern General Update Pattern

    nodes.data(data) // join nodes.exit() nodes.enter() nodes.merge() // update • • • • • 6 . 5
  27. D3.JS Pattern Example - Nodes Pattern Example - Nodes //

    join // join let let nodes nodes = = d3 d3. .select select( (this this. .container container) ) . .selectAll selectAll( ('.node' '.node') ) . .data data( (data data. .nodes nodes, , ( (d d) ) => => d d. .id id) ) // apply data // apply data // exit // exit nodes nodes. .exit exit( () ). .remove remove( () ) // update // update nodes nodes = = nodes nodes. .enter enter( () ) . .append append( ('circle' 'circle') ) . .attr attr( ('id' 'id', , ( (n n) ) => => 'node-' 'node-' + + n n. .id id) ) . .merge merge( (nodes nodes) ) . .attr attr( ('data-title' 'data-title', , ( (n n) ) => => n n. .label label) ) // any html property // any html property . .attr attr( ('class' 'class', , ( (n n) ) => => 'node status-' 'node status-' + + n n. .status status) ) // styling // styling 6 . 6
  28. D3.JS General Update Pattern - newer Syntax General Update Pattern

    - newer Syntax svg svg. .selectAll selectAll( ("circle" "circle") ) . .data data( (data data) ) . .join join( ( enter enter => => enter enter. .append append( ("circle" "circle") ). .attr attr( ("fill" "fill", , "green" "green") ), , update update => => update update. .attr attr( ("fill" "fill", , "blue" "blue") ) ) ) . .attr attr( ("stroke" "stroke", , "black" "black") ); ; Source: https://github.com/d3/d3-selection 6 . 7
  29. D3.JS Links, Key Functions Links, Key Functions let let links

    links = = d3 d3. .select select( (this this. .container container) ) . .selectAll selectAll( ('.link' '.link') ) . .data data( (data data. .links links. . ( (d d) ) => => d d. .source source. .id id + + '-' '-' + + d d. .target target. .id id) ) // (d) => d.id) - does not work for links` // (d) => d.id) - does not work for links` links links. .exit exit( () ) . .transition transition( (fade fade) ) . .remove remove( () ) links links. .enter enter( () ) . .append append( ('line' 'line') ) . .merge merge( (links links) ) . .attr attr( ('id' 'id', , ( (l l) ) => => 'link-' 'link-' + + l l. .source source. .id id + + '-' '-' + + l l. .target target. .id id) ) . .attr attr( ('marker-end' 'marker-end', , 'url(#end)' 'url(#end)') ) 6 . 8
  30. D3.JS Layout Engine - D3 Force Layout Engine - D3

    Force let let force force = = d3 d3. .forceSimulation forceSimulation( (this this. .network network. .get get( ('nodes' 'nodes') )) ) . .force force( ('link' 'link', , d3 d3. .forceLink forceLink( ( this this. .network network. .get get( ('links' 'links') )) ) . .id id( (d d => => d d. .id id) ) . .distance distance( (100 100) ) . .strength strength( (0.5 0.5) ) ) ) . .force force( ('charge' 'charge', , d3 d3. .forceManyBody forceManyBody( (- -30 30) )) ) . .force force( ('center' 'center', , d3 d3. .forceCenter forceCenter( (this this. .width width / / 2 2, , this this. .height height / / 2 2) )) ) . .force force( ('collide' 'collide', , d3 d3. .forceCollide forceCollide( (50 50) )) ) . .force force( ('position' 'position', , d3 d3. .forceRadial forceRadial( (20 20) )) ) 6 . 9
  31. D3.JS Layout Engine - Webcola Layout Engine - Webcola let

    let size size = = [ [this this. .width width, , this this. .height height] ] let let force force = = Cola Cola. .d3adaptor d3adaptor( (d3 d3) ). .size size( (size size) ) force force . .nodes nodes( (this this. .network network. .get get( ('nodes' 'nodes') )) ) . .links links( (this this. .network network. .get get( ('links' 'links') )) ) . .avoidOverlaps avoidOverlaps( (true true) ) . .handleDisconnected handleDisconnected( (true true) ) // .symmetricDiffLinkLengths(25,0.5) // .symmetricDiffLinkLengths(25,0.5) . .jaccardLinkLengths jaccardLinkLengths( (65 65, ,0.8 0.8) ) if if ( (this this. .options options. .flow flow === === 'horizontal' 'horizontal') ) { { force force. .flowLayout flowLayout( ('x' 'x', , 100 100) ) } } force force. .start start( (50 50) ) 6 . 10
  32. HIDE D3.JS Our Diagram Our Diagram const const network network

    = = new new Network Network( (data data. .nodes nodes, , data data. .links links) ) const const graph graph = = new new Graph Graph( ({ { width width: : window window. .innerWidth innerWidth, , height height: : window window. .innerHeight innerHeight, , flow flow: : 'horizontal' 'horizontal', , // engine: 'd3', // webcola per default // engine: 'd3', // webcola per default draggable draggable: : true true, , network network: : network network } }) ) graph graph. .init init( () ) graph graph. .on on( ('node:click' 'node:click', , ( (n n) ) => => { { graph graph. .highlightDependencies highlightDependencies( (n n, , { { arrows arrows: : true true } }) ) } }) ) 6 . 11
  33. OPEN SOURCE Result - Newton Graph Result - Newton Graph

    https://julie-ng.github.io/newtonjs-graph/ 6 . 12
  34. Wrapping Up Wrapping Up Cloud and microservices - complex, not

    perfect "Computers are useless" "They only give you answers" Before you automate, create People are complex at core of both problem and center of solution • • • • • • • Graphic Source: Julie Zhou, VP Product, Facebook 8 . 1
  35. WRAPPING UP Ask Questions & Create New Value Ask Questions

    & Create New Value — Julie Zhou, VP Product, Facebook 8 . 2
  36. Julie Ng | NodeConf EU | November 2019 BYE BYE

    Thank you Thank you Twitter Web Newton Graph Tidy JSDoc Template Credits - all stock photos are from amazing photographers on • @jng5 • julie.io • github.com/julie-ng/newton-graph • github.com/julie-ng/tidy-jsdoc Unsplash → 8 . 3