Upgrade to Pro — share decks privately, control downloads, hide ads and more …

Designing and Visualizing Cloud Architectures for Humans

jng
April 27, 2019

Designing and Visualizing Cloud Architectures for Humans

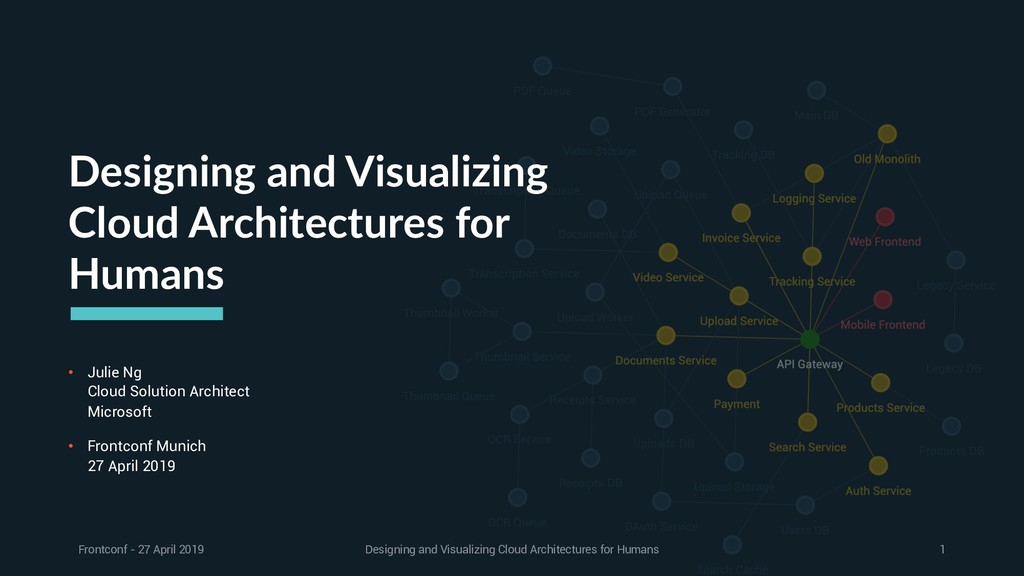
Today's software architectures are organic, scaling with cloud infrastructure and changing with agile development cycles. As software matures and teams grow, so does complexity. Combining d3.js visualizations and monitoring, we'll explore different dimensions of cloud architectures, both in design and operation to focus less on technical details and more on what matters: people.

jng

April 27, 2019
Tweet

More Decks by jng

Other Decks in Technology

Transcript

  1. Designing and Visualizing
    Cloud Architectures for
    Humans
    • Julie Ng
    Cloud Solution Architect
    Microsoft
    • Frontconf Munich
    27 April 2019
    Frontconf - 27 April 2019 Designing and Visualizing Cloud Architectures for Humans 1

    View Slide

  2. What is Good
    Architecture?
    In the opinion of a former
    Enterprise Architect
    1

    View Slide

  3. Hello World!
    ONCE UPON A TIME…

    View Slide

  4. Decouple Frontends!
    DIFFERENT UI REQUIREMENTS

    View Slide

  5. Backends for Frontends (BFF)
    DIFFERENT UX REQUIREMENTS

    View Slide

  6. • Decoupling has continued:
    • microservices, containers, serverless…
    what’s next?
    • on-prem à cloud à where’s my data?
    • Failures more complex
    • Debugging harder
    • Does it have to be this way?
    • WHY is it this way?
    Did I order this Architecture Spaghe>?
    IT-TRANSFORMATION AT SCALE
    Frontconf - 27 April 2019 Designing and Visualizing Cloud Architectures for Humans 6

    View Slide

  7. • One that works
    • Has no downtime
    • Enterprise Architecture = bridging
    technology and business
    • Allianz Germany 2018
    • 36.4 € Billion Revenue
    • 2.4 € Billion Operating Profit
    • 129 years old
    • So how much does 1 hour of downtime cost?
    What is a good architecture?
    LARGE SCALE - ENTERPRISE ARCHITECTURE
    COMPANY STATISTICS FROM
    h/ps://www.allianzdeutschland.de/die-allianz-deutschland-im-portraet/
    Frontconf - 27 April 2019 Designing and Visualizing Cloud Architectures for Humans 7

    View Slide

  8. Cloud Context
    The Human Element
    What causes DownAme?
    PER GOOGLE NEXT (YELLOW), INDEPENDENT ORACLE USER GROUP (BLUE)
    3rd Party or Cloud
    Server Failures
    Storage Failures
    Application Errors
    Usage Spikes/Surges
    Power Outages
    Network Outage
    Human Error Bad Deployments
    Monitoring Gaps
    Scaling Boundaries
    Uneven Sharding '
    Humans cause
    downtime
    The cloud just works…

    when configured properly
    (by humans)
    Frontconf - 27 April 2019 Designing and Visualizing Cloud Architectures for Humans 8

    View Slide

  9. • Measure quality of architecture by downtime
    • Assume the cloud just works
    • Assume we humans caused the failure
    • Goal is to understand human factor in architecture
    • How do we behave?
    • Is there a pattern?
    • Why do we behave the way we do?
    The Human Factor on Architecture
    WHY I BUILT NEWTON.JS
    We’re pushing the buttons
    Frontconf - 27 April 2019 Designing and Visualizing Cloud Architectures for Humans 9

    View Slide

  10. How do you
    Document
    Architecture?
    What did we intend to build?
    2

    View Slide

  11. Architecture Diagrams
    CLASSIC DOCUMENTATION
    Diagram Source – Scalable Web Application Reference Architecture
    https://docs.microsoft.com/en-us/azure/architecture/reference-architectures/app-service-web-app/scalable-web-app
    • Classic diagrams
    • Show intent
    • But very static
    • Not real-time. Quickly outdated.
    • What do arrows indicate?
    • Dependencies?
    • Data Flow?
    Frontconf - 27 April 2019 Designing and Visualizing Cloud Architectures for Humans 11

    View Slide

  12. Typical Real Time Monitoring Dashboards
    INTERACTIVE DOCUMENTATION?
    • Latency
    • CPU Usage
    • Uptime
    • Storage Consumption
    • Memory Consumption
    • Nodes Count
    • Temperature
    Does this make sense for a cloud application?
    No. The cloud just works, remember?
    Frontconf - 27 April 2019 Designing and Visualizing Cloud Architectures for Humans 12

    View Slide

  13. • For 10.000 feet overview - too
    much information
    • Missing relationships – remember
    those arrows?
    • To understand how everything is
    connected, we have to go return to
    the humans…
    Monitor uptime for hundreds of components?
    JUST UPTIME
    Graphic Source
    https://community.grafana.com/t/status-panel-for-more-than-200-servers/2710
    Frontconf - 27 April 2019 Designing and Visualizing Cloud Architectures for Humans 13

    View Slide

  14. OrganizaAons
    in the Cloud
    The people behind the code
    3

    View Slide

  15. What we imagine – 1 team
    ORGANIZATIONS – UNIFORM AND STANDARDIZED IN LARGE OPEN SPACE OFFICES
    Frontconf - 27 April 2019 Designing and Visualizing Cloud Architectures for Humans 15

    View Slide

  16. Reality – many chaoAc teams, but diverse
    ORGANIZATIONS
    So do you really expect 1 architecture?
    Frontconf - 27 April 2019 Designing and Visualizing Cloud Architectures for Humans 16

    View Slide

  17. Conway’s Law
    BEHAVIORAL PSYCHOLOGY

    Organizations which design systems...
    are constrained to produce designs
    which are copies of the communication
    structures of these organizations.
    - Melvin Conway. "How Do Committees Invent?” Datamation (April 1968).
    So despite independent teams, is there only a single possible overall result?
    Frontconf - 27 April 2019 Designing and Visualizing Cloud Architectures for Humans 17

    View Slide

  18. • Installed on base images so every team uses
    them – easy win?
    • Large organizations and systems à too
    much noise
    • Arrows indicate request flow, but not intent -
    the relationships we wanted to build
    • How can we indicate intent?
    Automated graphs with trace agents
    AUTOMATE RELATIONSHIPS
    Example automated graph
    Frontconf - 27 April 2019 Designing and Visualizing Cloud Architectures for Humans 18

    View Slide

  19. Junior designers… make it look good
    JULIE ZHOU, VP PRODUCT FACEBOOK ON GOALS
    https://medium.com/the-year-of-the-looking-glass/junior-designers-vs-senior-designers-fbe483d3b51e
    Frontconf - 27 April 2019 Designing and Visualizing Cloud Architectures for Humans 19

    View Slide

  20. Senior designers… make new value
    JULIE ZHOU, VP PRODUCT FACEBOOK ON GOALS
    https://medium.com/the-year-of-the-looking-glass/junior-designers-vs-senior-designers-fbe483d3b51e
    Before we automate, let’s create.
    How can we reintroduce intent to
    real time monitoring?
    Remember, that’s how we choose
    to measure good architecture.
    Frontconf - 27 April 2019 Designing and Visualizing Cloud Architectures for Humans 20

    View Slide

  21. Visualizations
    with d3.js
    Data Driven Transformations
    on the DOM
    4

    View Slide

  22. • There are no loops over the DOM
    • Based on data()
    • selectAll() does it all:
    • Adds Circles
    • Updates Circles
    • Removes Circles
    Data Driven – describe what, not how
    D3.JS - NO FOR LOOPS
    Frontconf - 27 April 2019 Designing and Visualizing Cloud Architectures for Humans 22

    View Slide

  23. • Nodes array
    • IDs must be unique
    • Links Array
    • source & target reference IDs
    • References are key based, not Array
    index based
    #PROTIP
    Source and targets are not array index based – although d3.js
    documents and tutorials say they are.
    Example Data
    D3.JS
    Frontconf - 27 April 2019 Designing and Visualizing Cloud Architectures for Humans 23

    View Slide

  24. General Update Pattern
    D3.JS
    DATA DOM ELEMENTS
    Enter Exit
    Update
    Frontconf - 27 April 2019 Designing and Visualizing Cloud Architectures for Humans 24

    View Slide

  25. • General Update Pattern
    • nodes.data(data) // join
    • nodes.exit()
    • nodes.enter()
    • Nodes.merge() // update
    Nodes
    D3.JS
    Frontconf - 27 April 2019 Designing and Visualizing Cloud Architectures for Humans 25

    View Slide

  26. • selection.data(data, (d) => d.id) // does not work for links *
    Links, Key Functions
    D3.JS
    Frontconf - 27 April 2019 Designing and Visualizing Cloud Architectures for Humans 26

    View Slide

  27. • Default Force, Particles Engine
    • Too uniform?
    D3.js Force Engine
    D3.JS
    Frontconf - 27 April 2019 Designing and Visualizing Cloud Architectures for Humans 27

    View Slide

  28. Webcola Force Layout
    D3.JS
    Frontconf - 27 April 2019 Designing and Visualizing Cloud Architectures for Humans 28

    View Slide

  29. • D3 Layout iterations: tick
    • Custom events via EventEmitter
    • this.emit('update')
    • Standard events
    • mouseover, mouseout
    • dragstart
    • etc.
    Event Driven
    D3.JS
    Frontconf - 27 April 2019 Designing and Visualizing Cloud Architectures for Humans 29

    View Slide

  30. • Runtime vs. State
    • Transactions
    Visualize Dependencies – intent!
    D3.JS
    Frontconf - 27 April 2019 Designing and Visualizing Cloud Architectures for Humans 30

    View Slide

  31. Live Demo!
    Newton.js
    Cloud Architecture Graphs for Humans
    https://github.com/julie-ng/newtonjs-graph
    Frontconf - 27 April 2019 Designing and Visualizing Cloud Architectures for Humans 31

    View Slide

  32. • Follow Me!
    • julie.io
    • github.com/julie-ng
    • twitter.com/jng5
    • Credits - all stock photos are from amazing photographers on Unsplash
    https://unsplash.com/collections/4638940/frontconf-talk-cloud-architectures-
    visualizations/98850e9cfebb9cc0d350ce787e6986e4
    • Note - all opinions are my own and do not reflect those of my employers past and present.
    Thank you!
    BYE BYE
    Frontconf - 27 April 2019 Designing and Visualizing Cloud Architectures for Humans 32

    View Slide