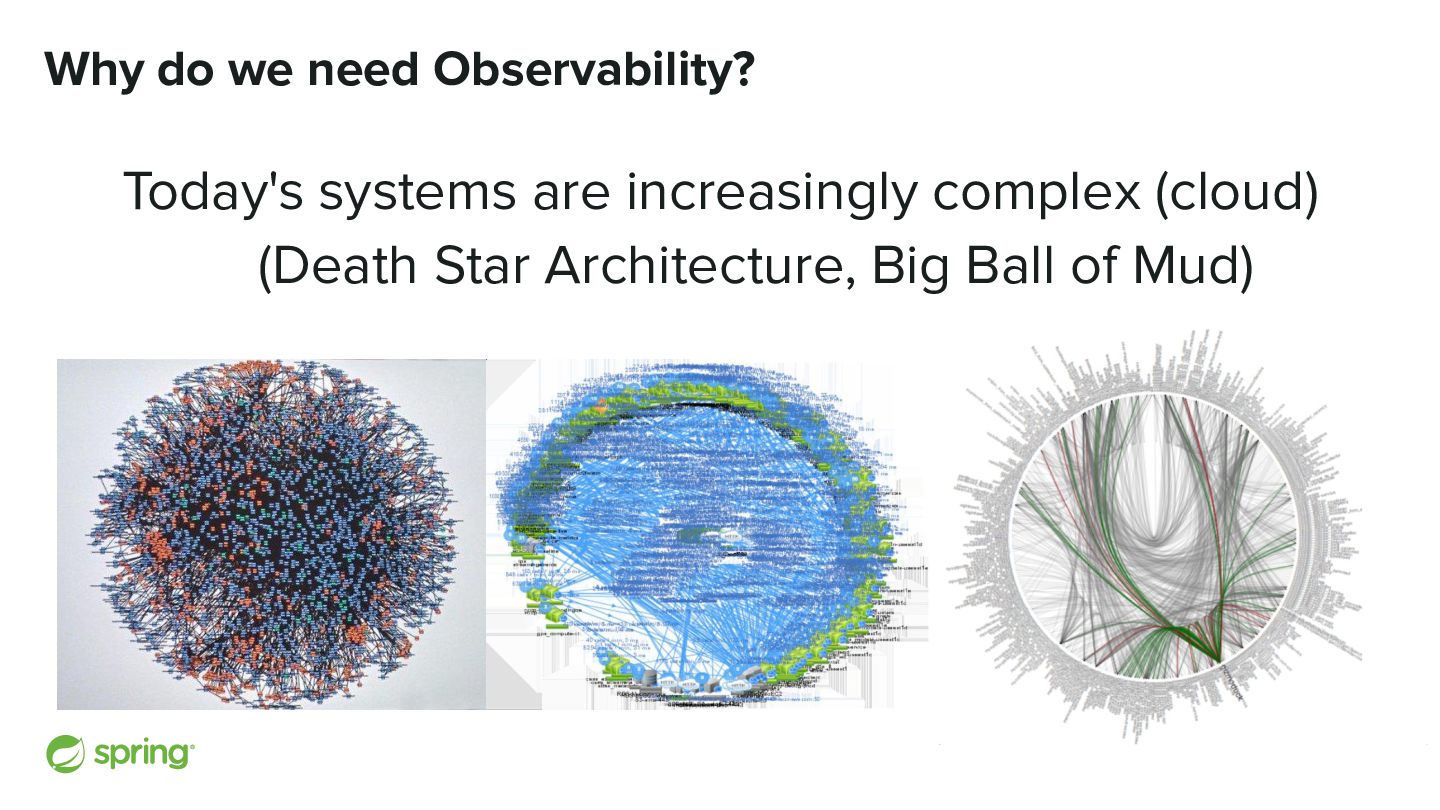
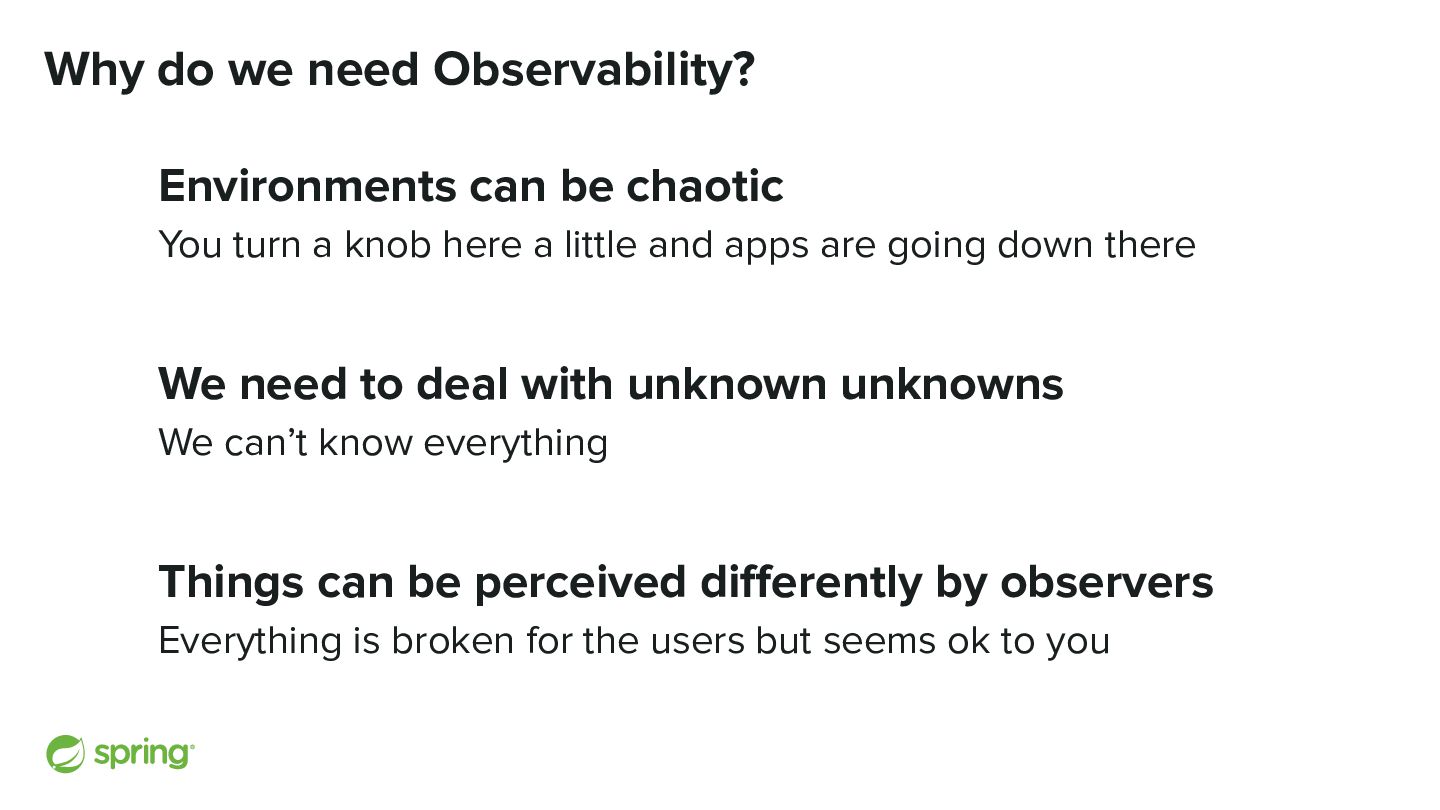
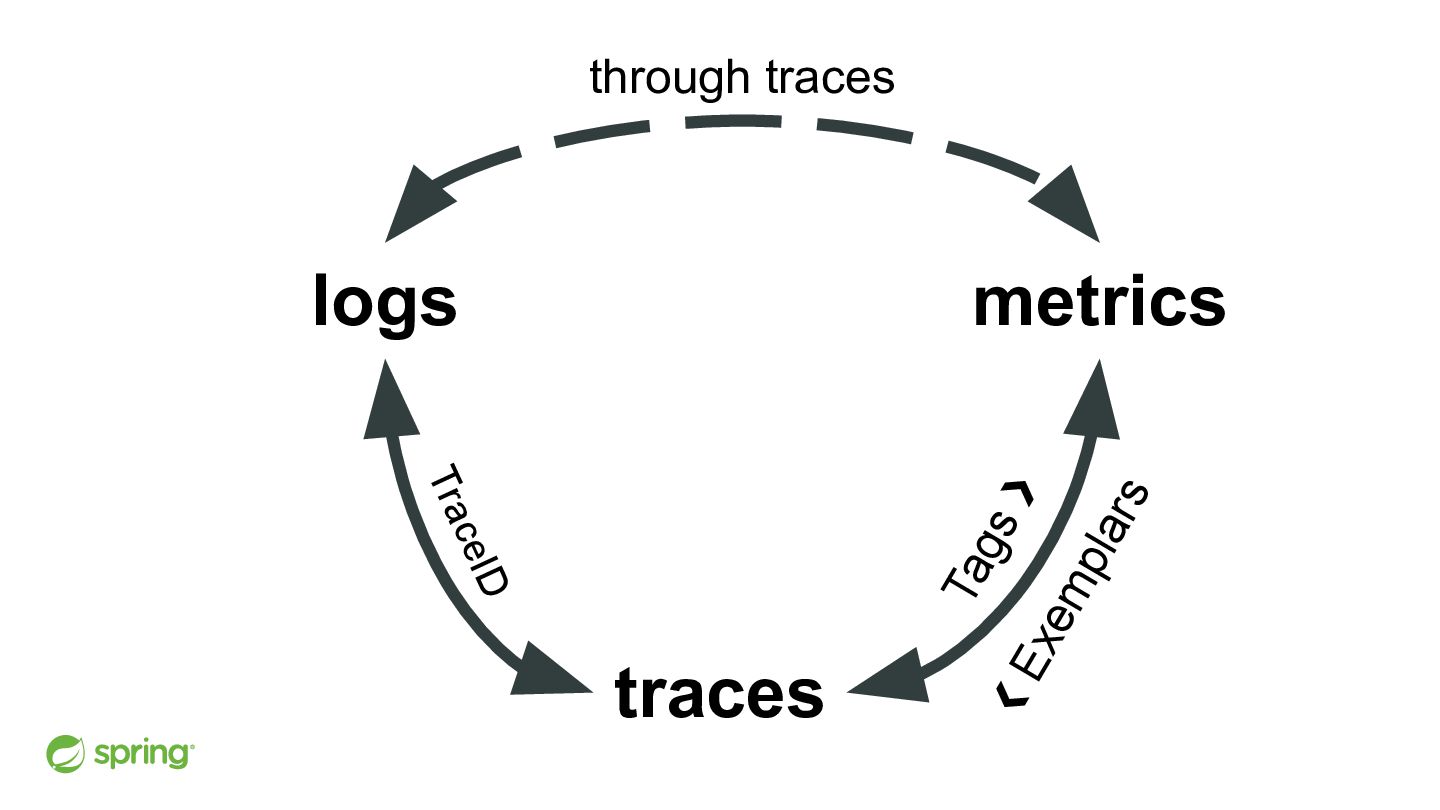
little and apps are going down there We need to deal with unknown unknowns We can’t know everything Things can be perceived differently by observers Everything is broken for the users but seems ok to you Why do we need Observability?
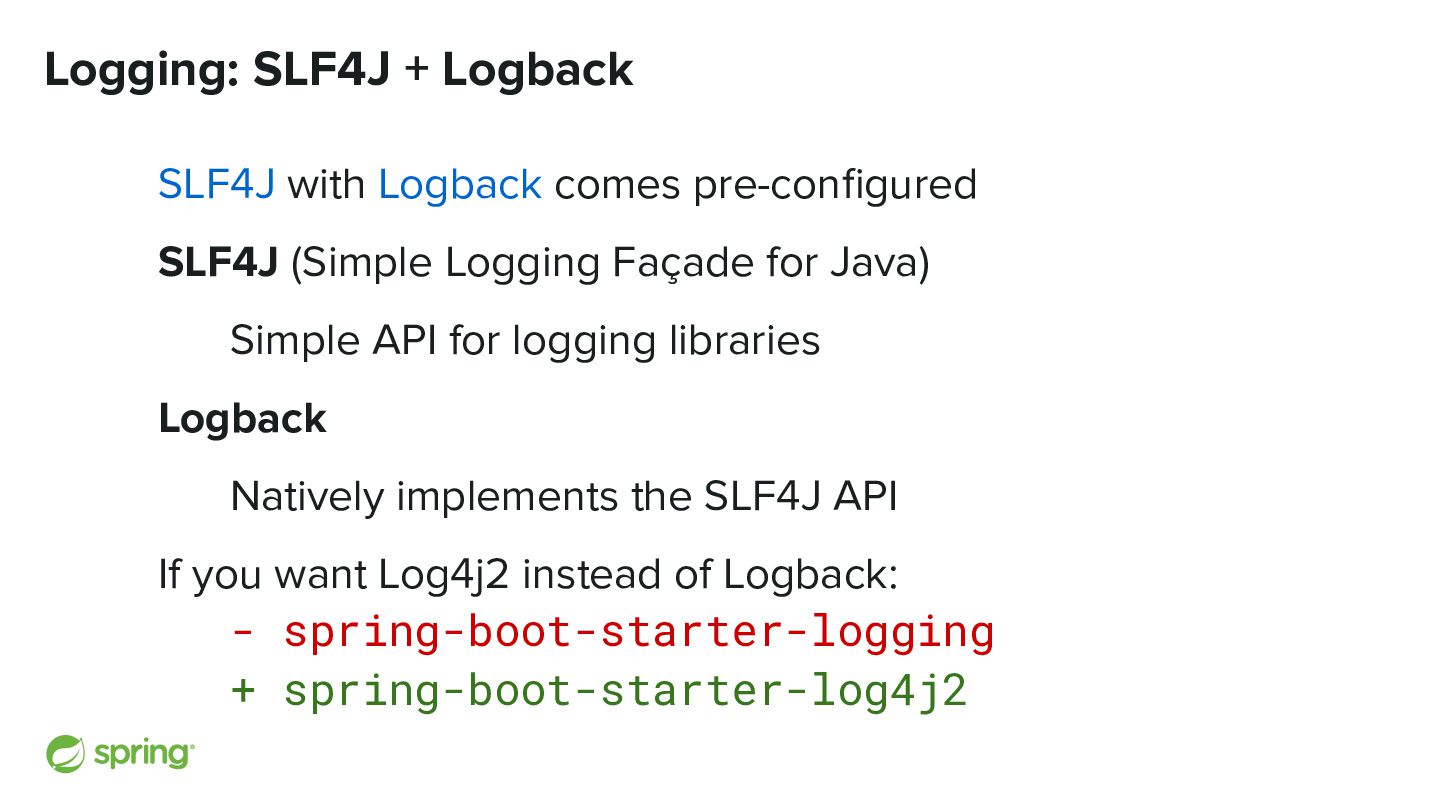
Java) Simple API for logging libraries Logback Natively implements the SLF4J API If you want Log4j2 instead of Logback: - spring-boot-starter-logging + spring-boot-starter-log4j2 Logging: SLF4J + Logback
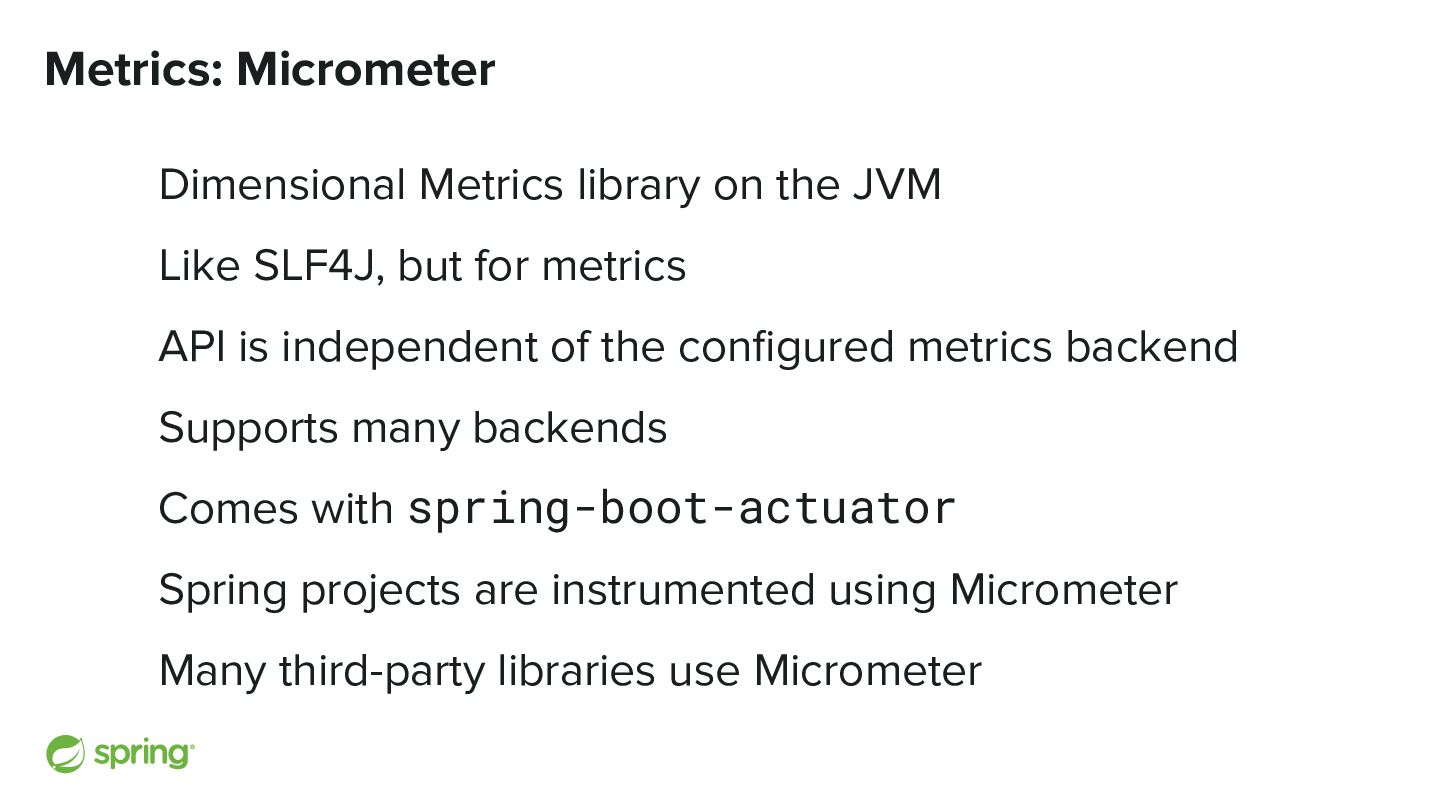
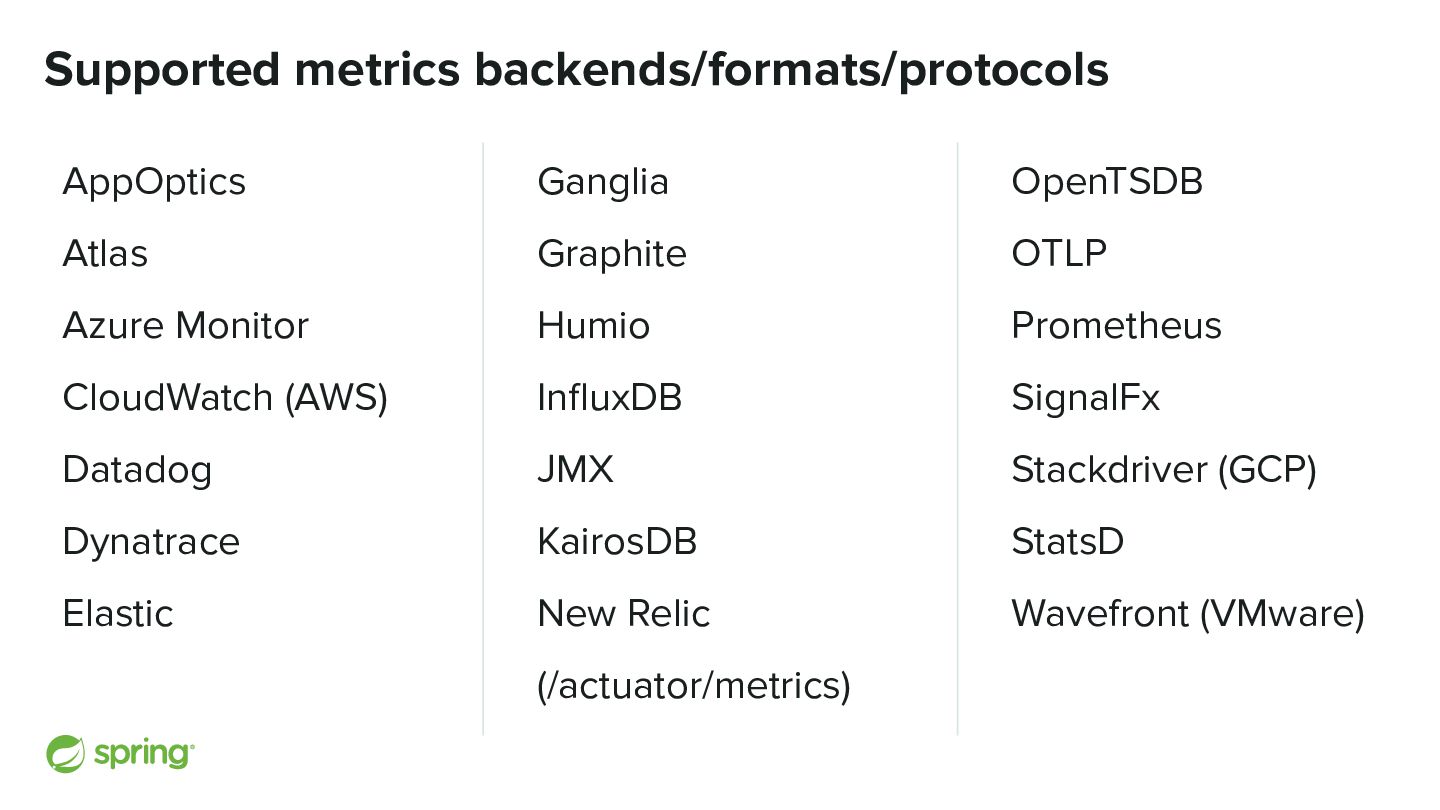
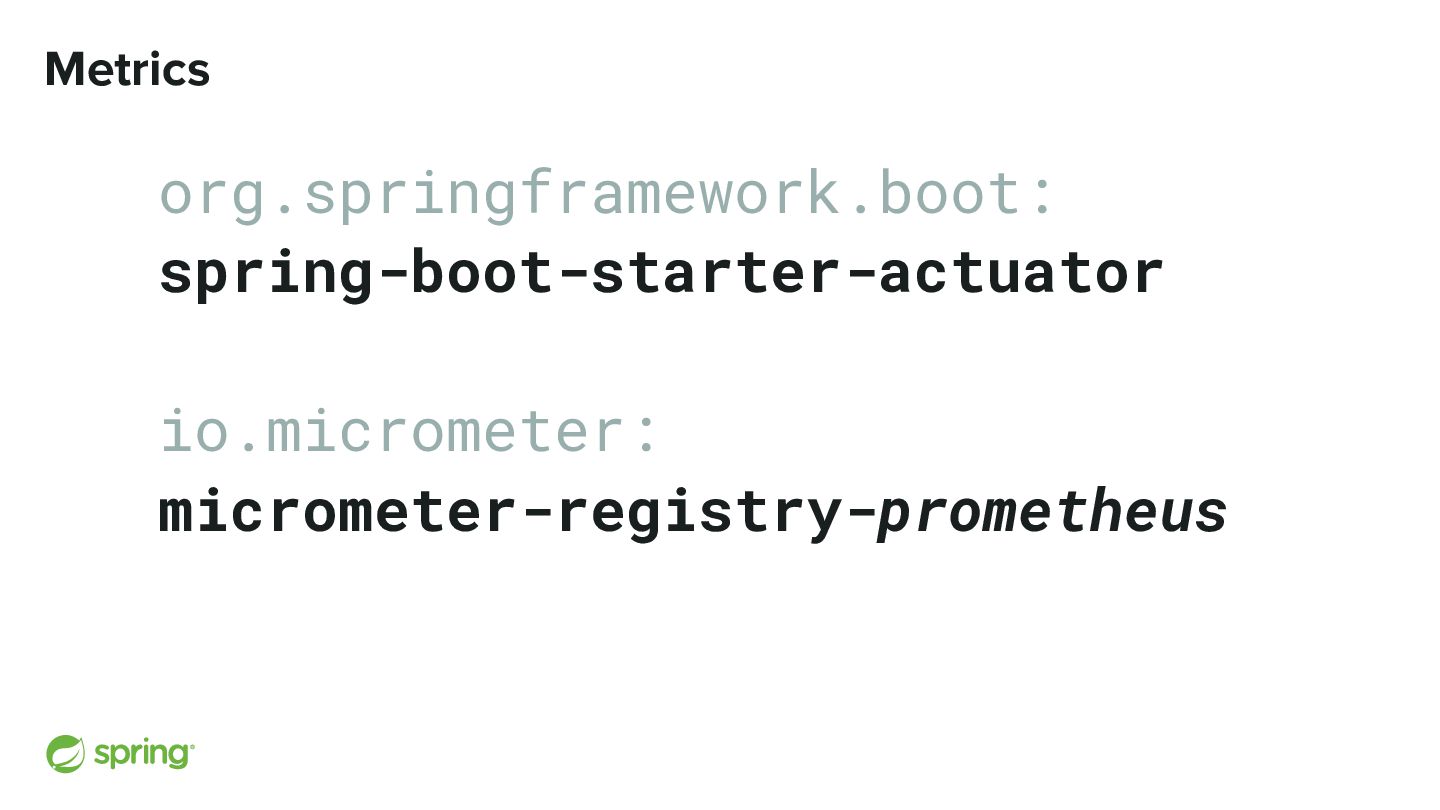
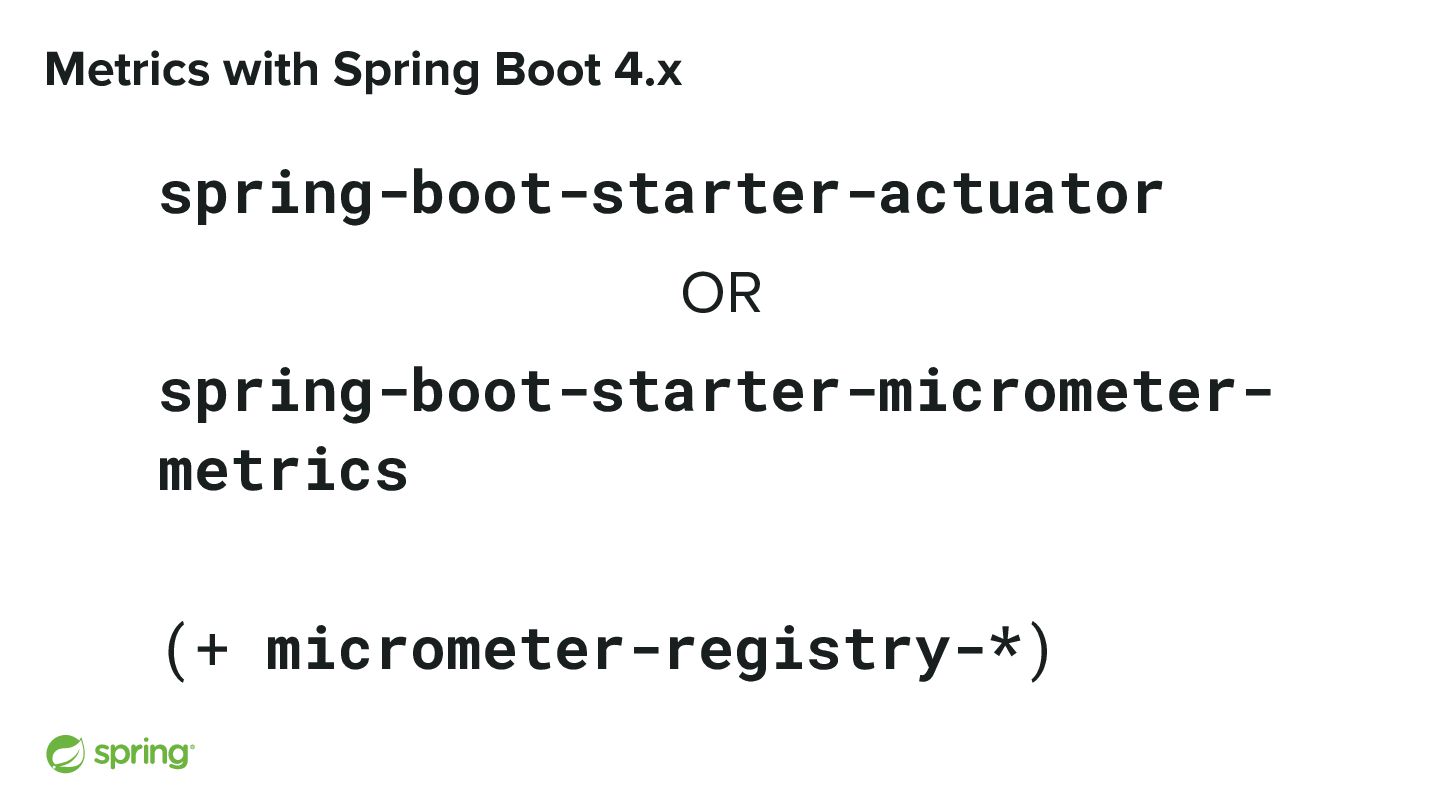
but for metrics API is independent of the configured metrics backend Supports many backends Comes with spring-boot-actuator Spring projects are instrumented using Micrometer Many third-party libraries use Micrometer
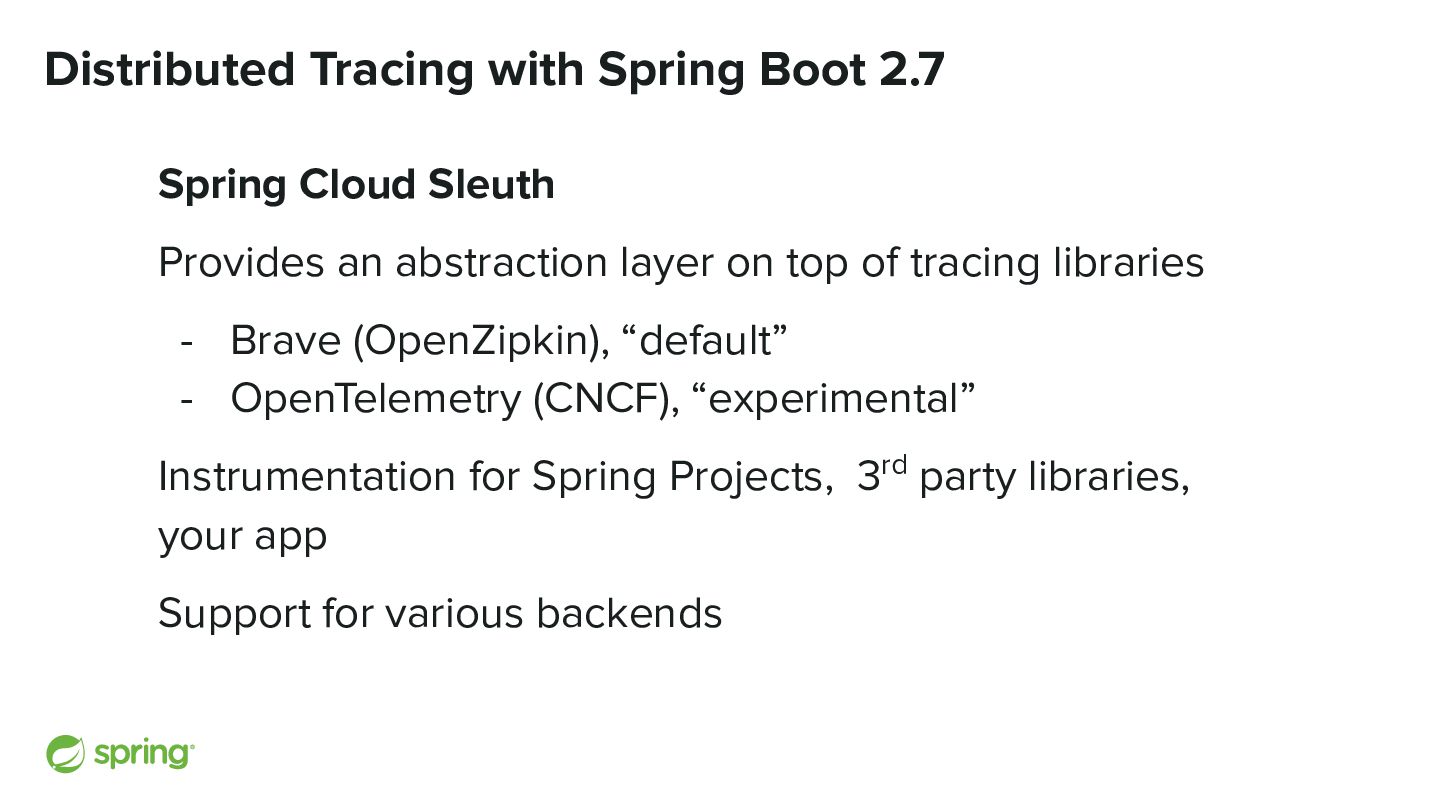
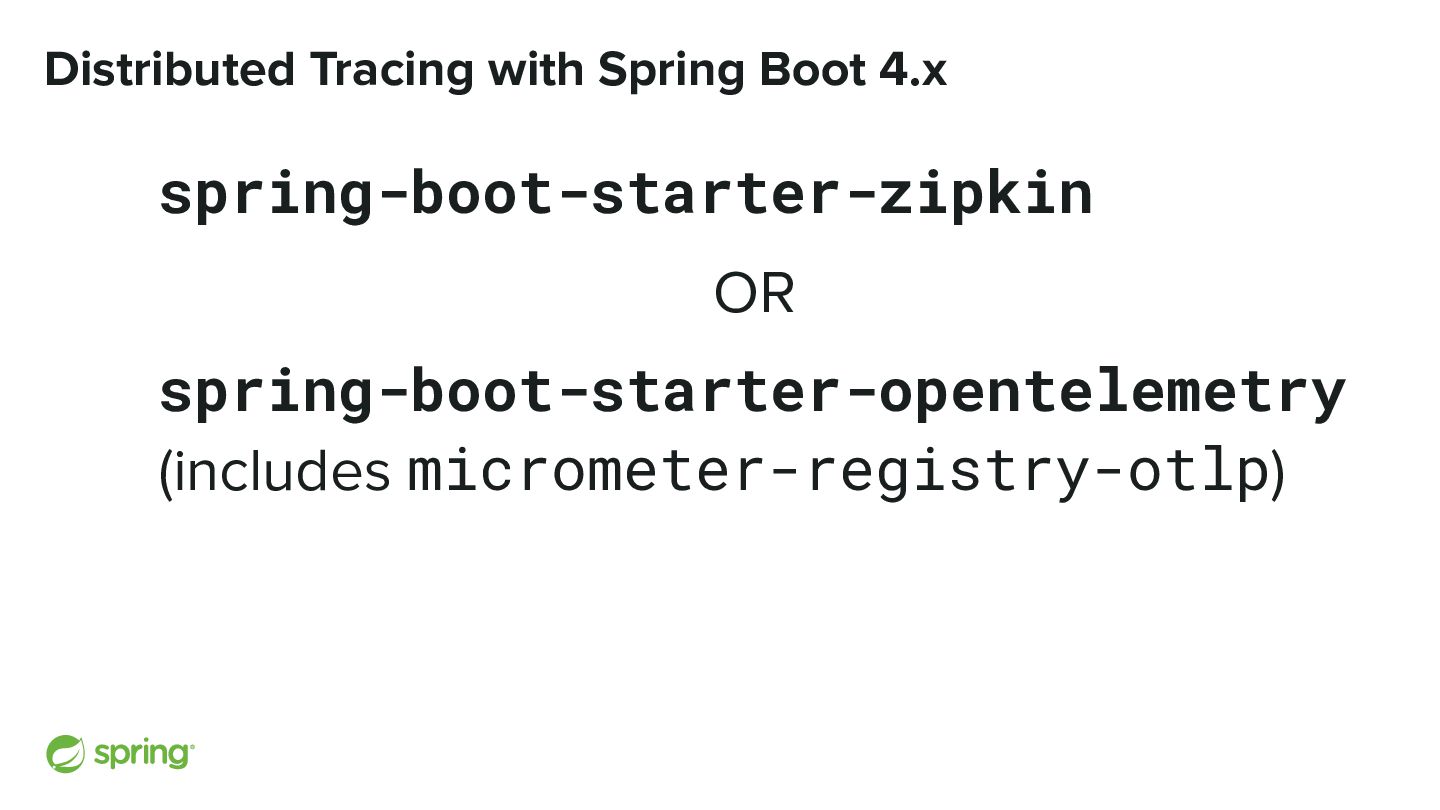
an abstraction layer on top of tracing libraries - Brave (OpenZipkin), “default” - OpenTelemetry (CNCF), “experimental” Instrumentation for Spring Projects, 3rd party libraries, your app Support for various backends
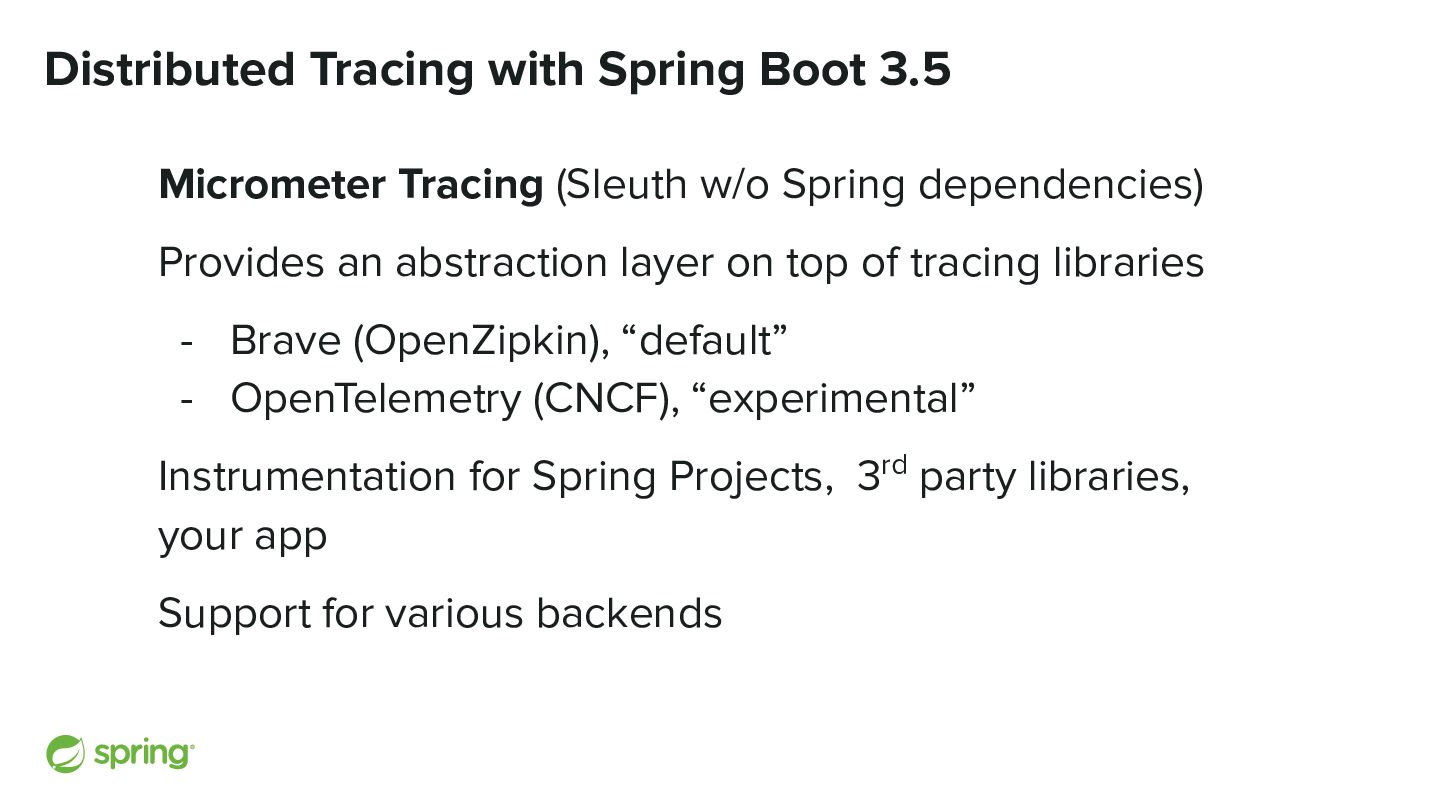
Spring dependencies) Provides an abstraction layer on top of tracing libraries - Brave (OpenZipkin), “default” - OpenTelemetry (CNCF), “experimental” Instrumentation for Spring Projects, 3rd party libraries, your app Support for various backends
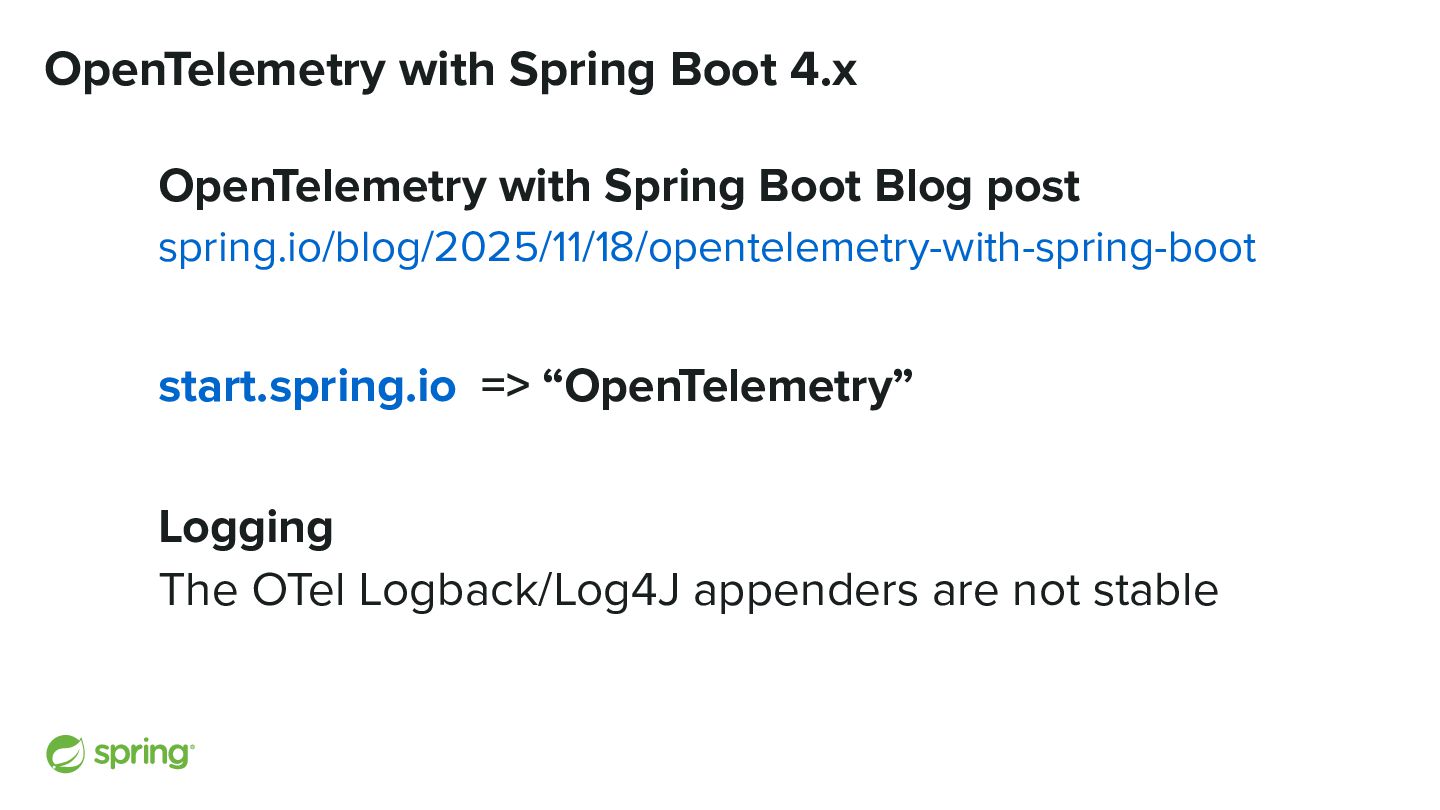
post spring.io/blog/2025/11/18/opentelemetry-with-spring-boot start.spring.io => “OpenTelemetry” Logging The OTel Logback/Log4J appenders are not stable
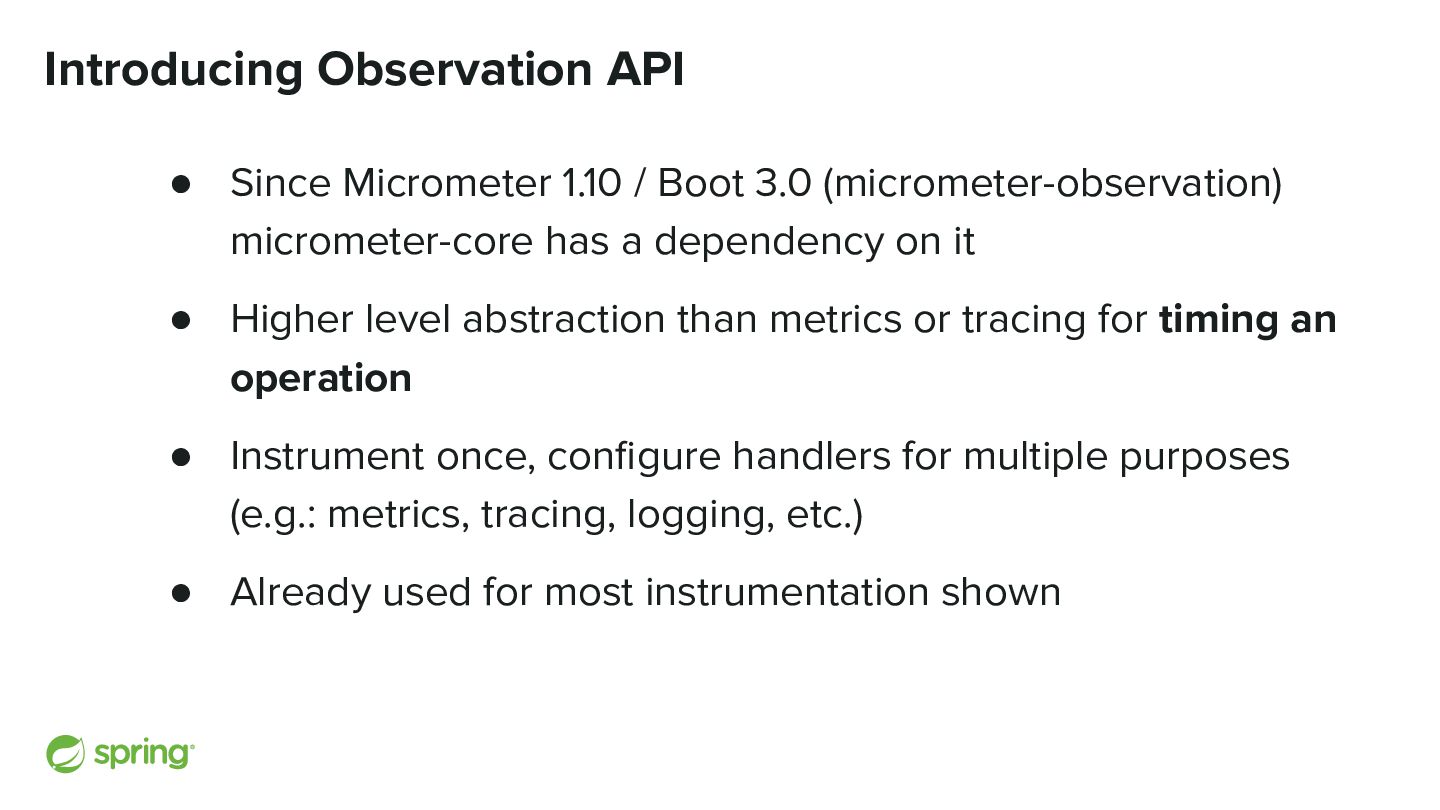
(micrometer-observation) micrometer-core has a dependency on it • Higher level abstraction than metrics or tracing for timing an operation • Instrument once, configure handlers for multiple purposes (e.g.: metrics, tracing, logging, etc.) • Already used for most instrumentation shown
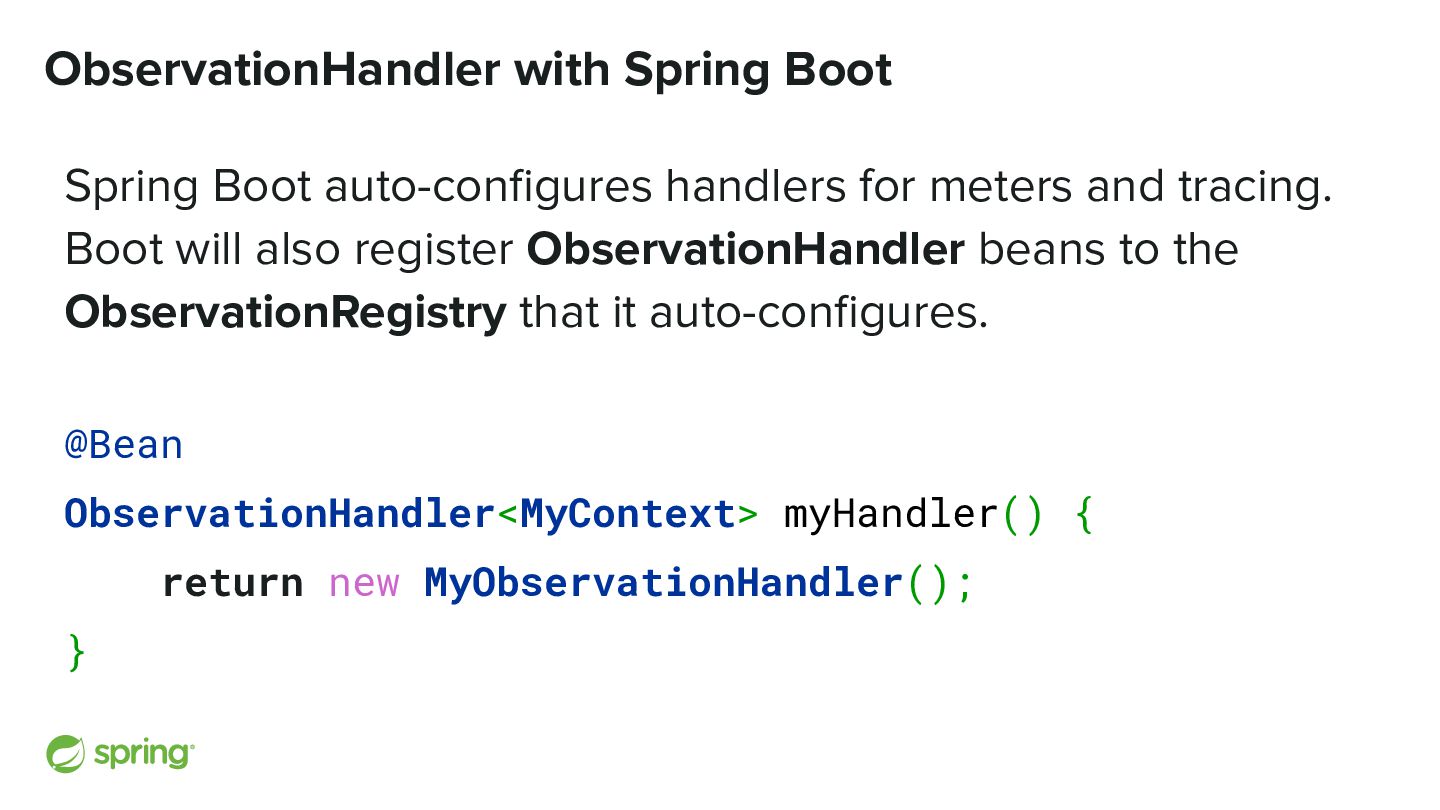
and tracing. Boot will also register ObservationHandler beans to the ObservationRegistry that it auto-configures. @Bean ObservationHandler<MyContext> myHandler() { return new MyObservationHandler(); }
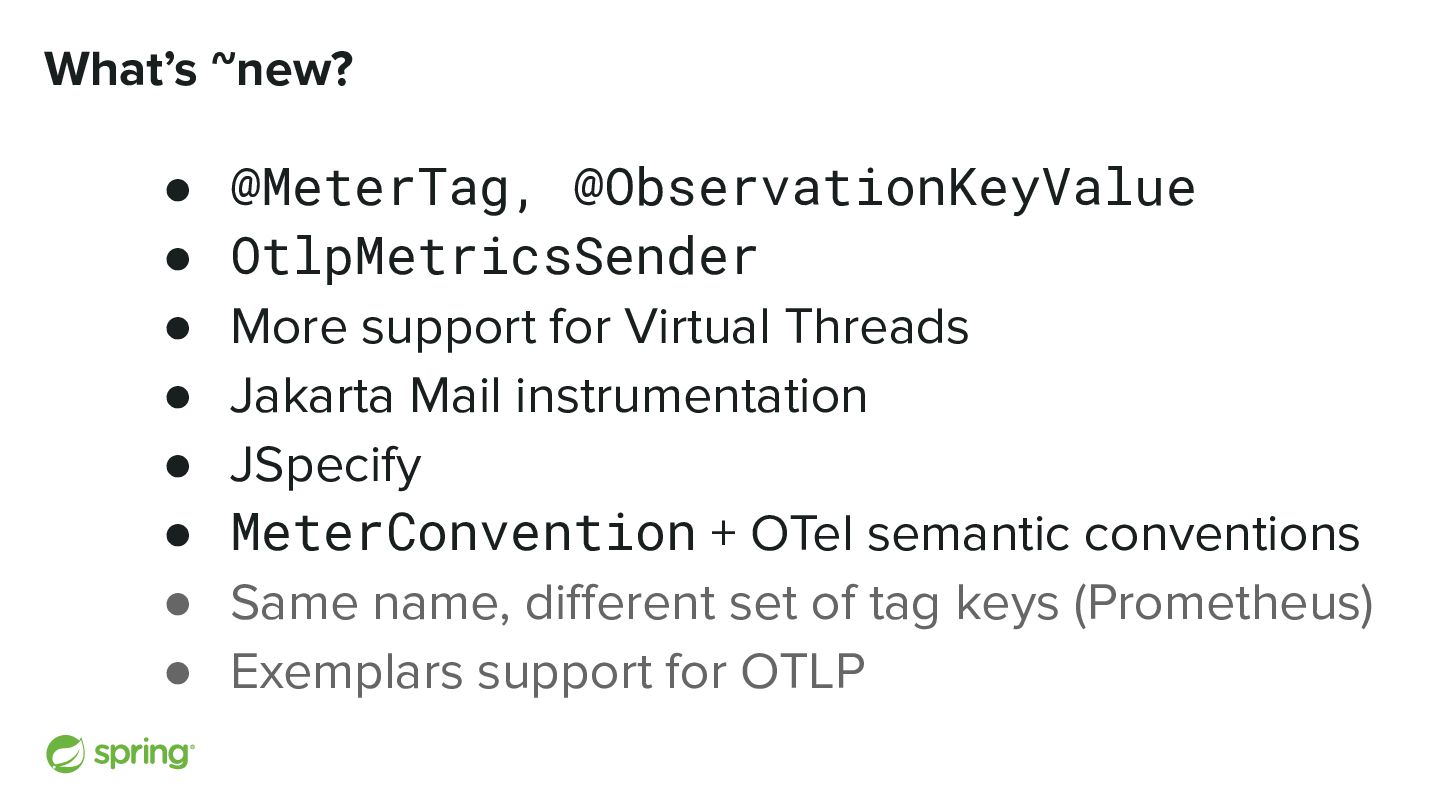
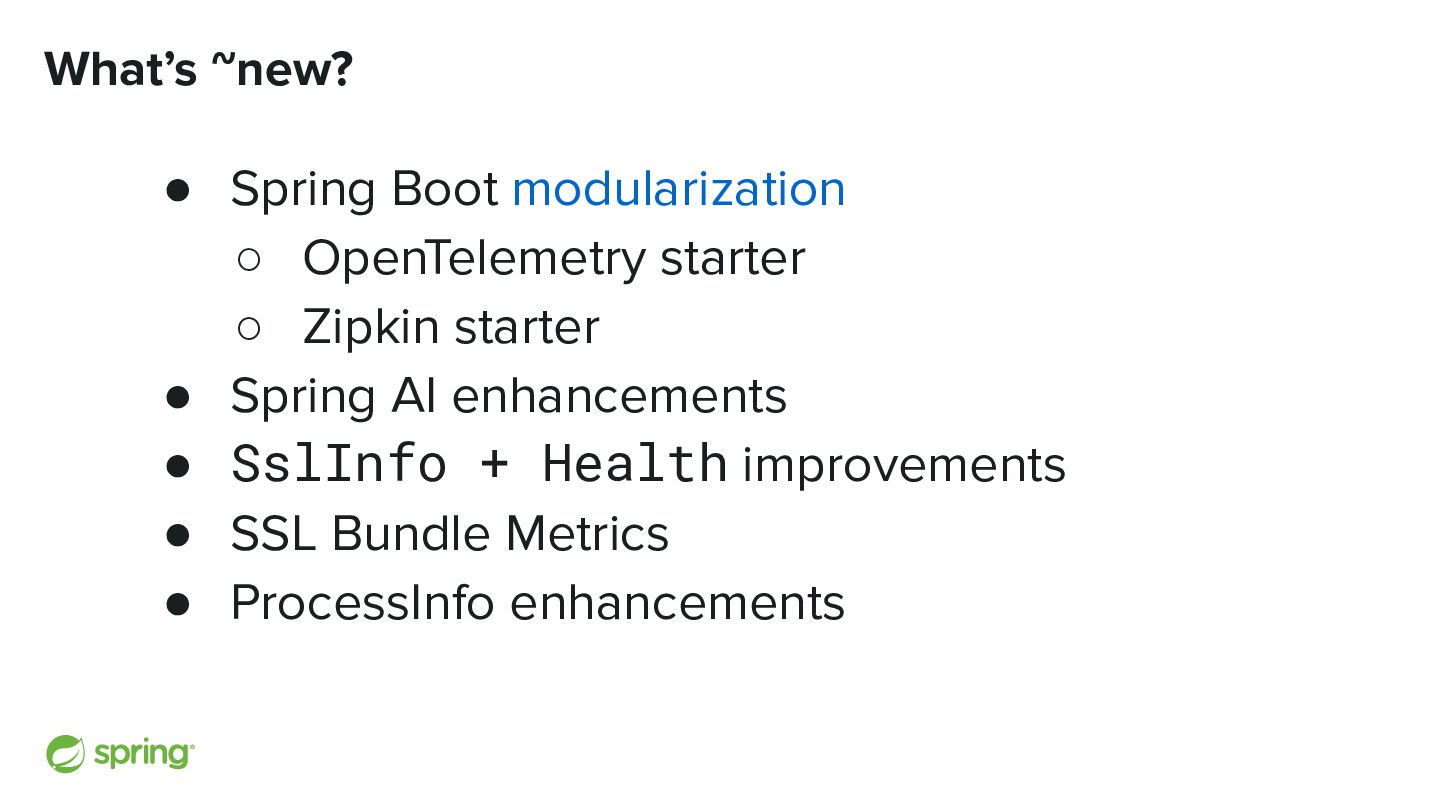
for Virtual Threads • Jakarta Mail instrumentation • JSpecify • MeterConvention + OTel semantic conventions • Same name, different set of tag keys (Prometheus) • Exemplars support for OTLP