Inc. to make Data Science available for everyone. Prior to Exploratory, Kan was a director of development at Oracle leading development teams for building various Data Science products in areas including Machine Learning, BI, Data Visualization, Mobile Analytics, Big Data, etc. While at Oracle, Kan also provided training and consulting services to help organizations transform with data. @KanAugust Instructor
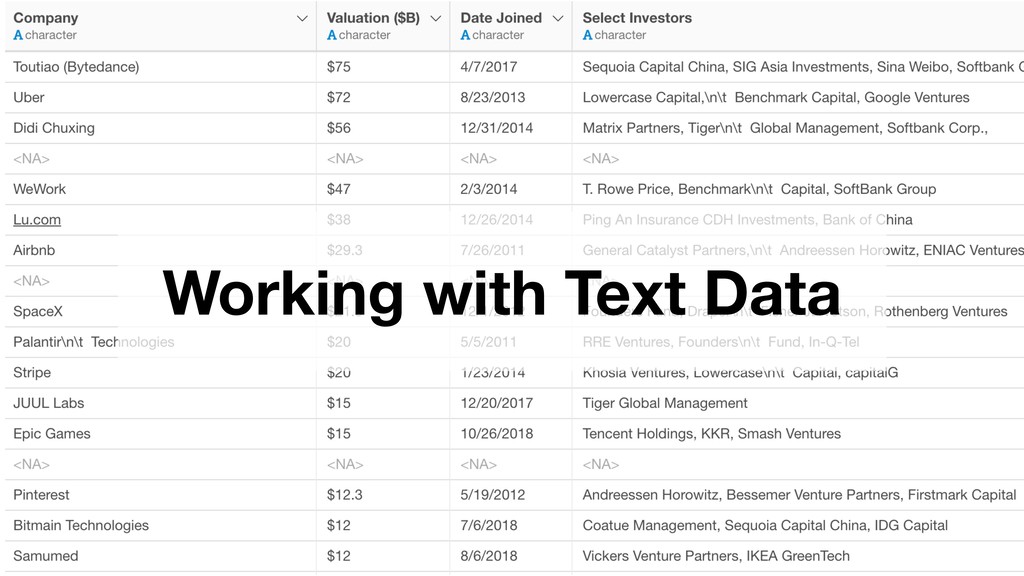
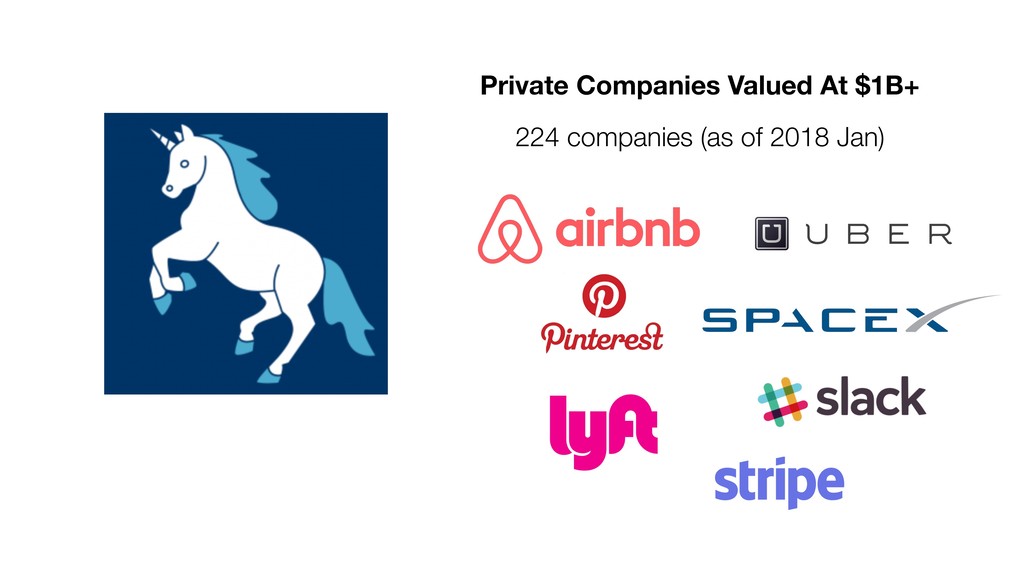
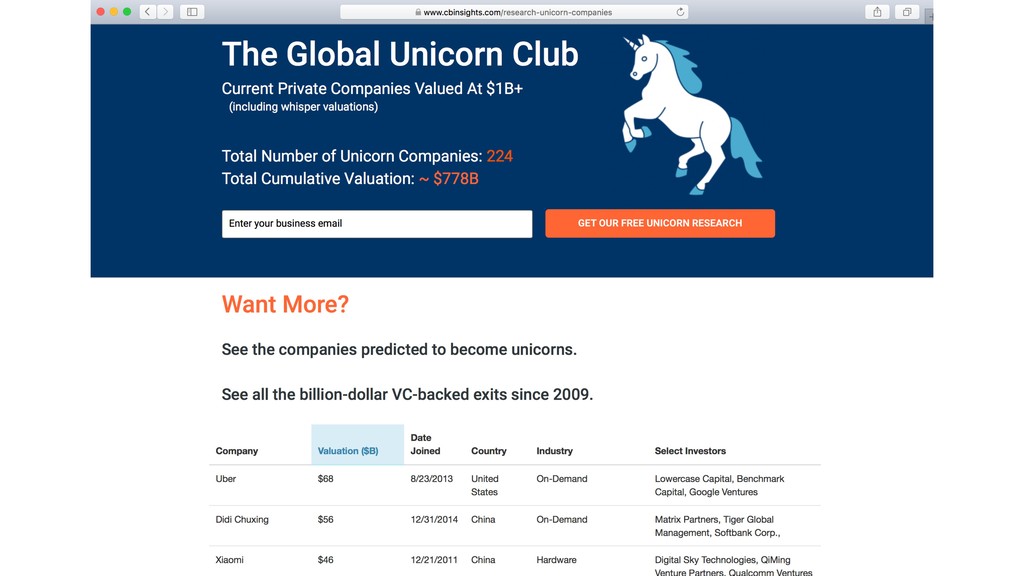
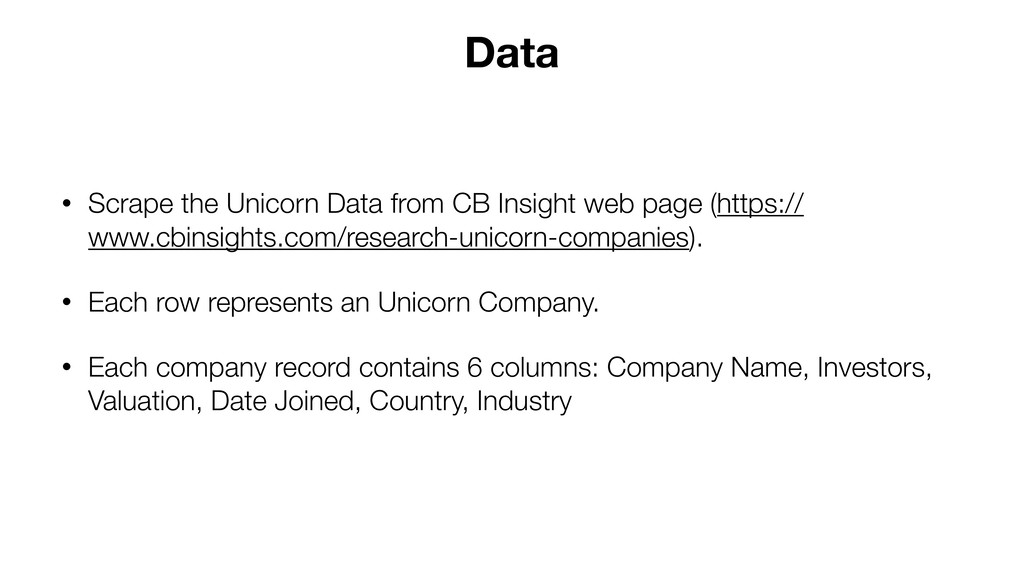
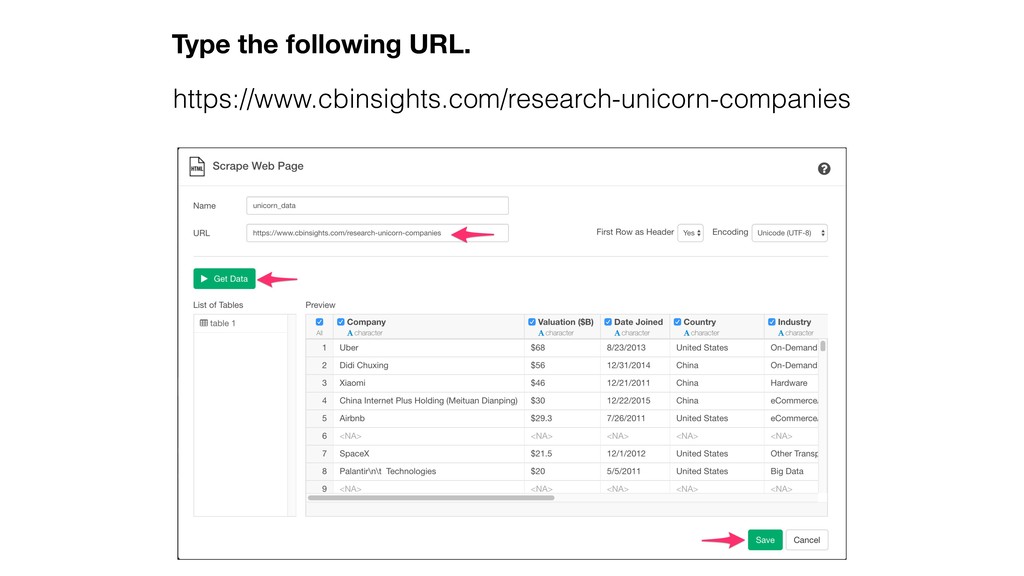
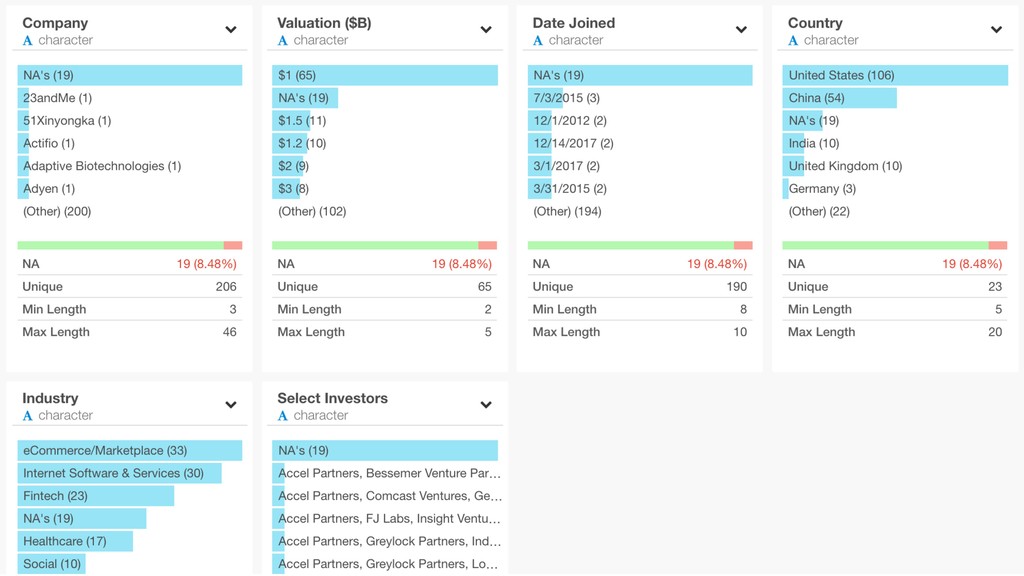
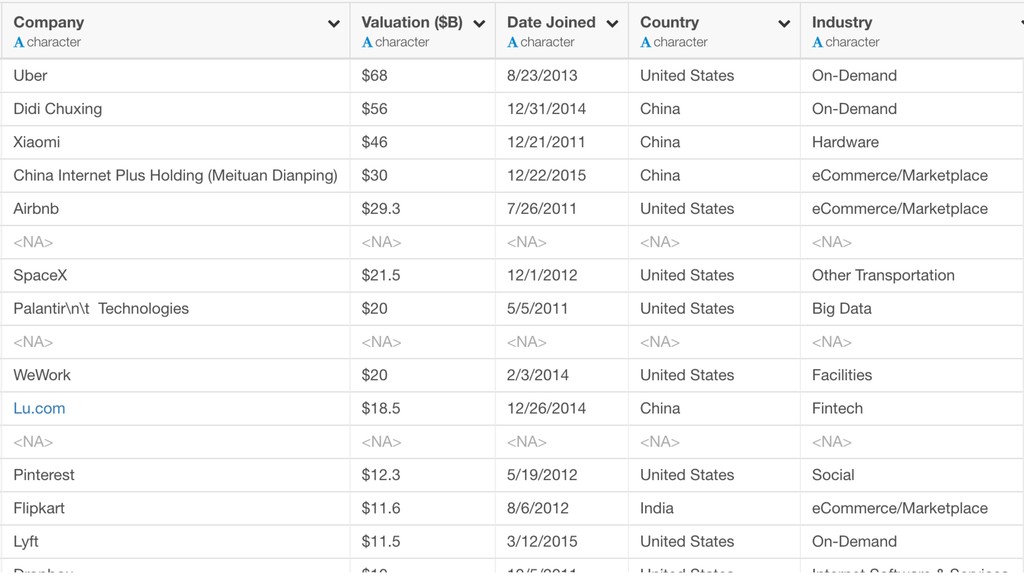
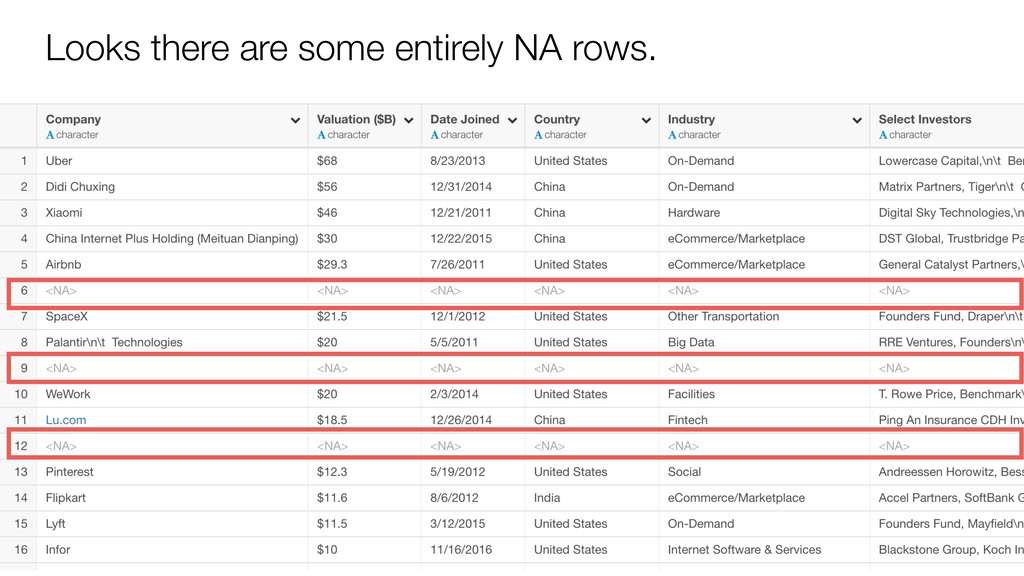
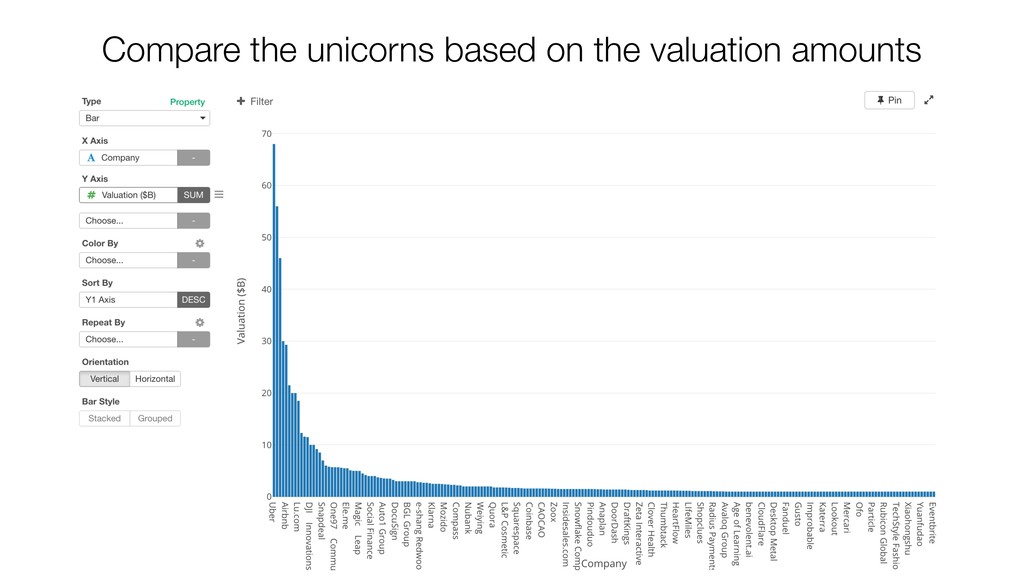
(https:// www.cbinsights.com/research-unicorn-companies). • Each row represents an Unicorn Company. • Each company record contains 6 columns: Company Name, Investors, Valuation, Date Joined, Country, Industry Data
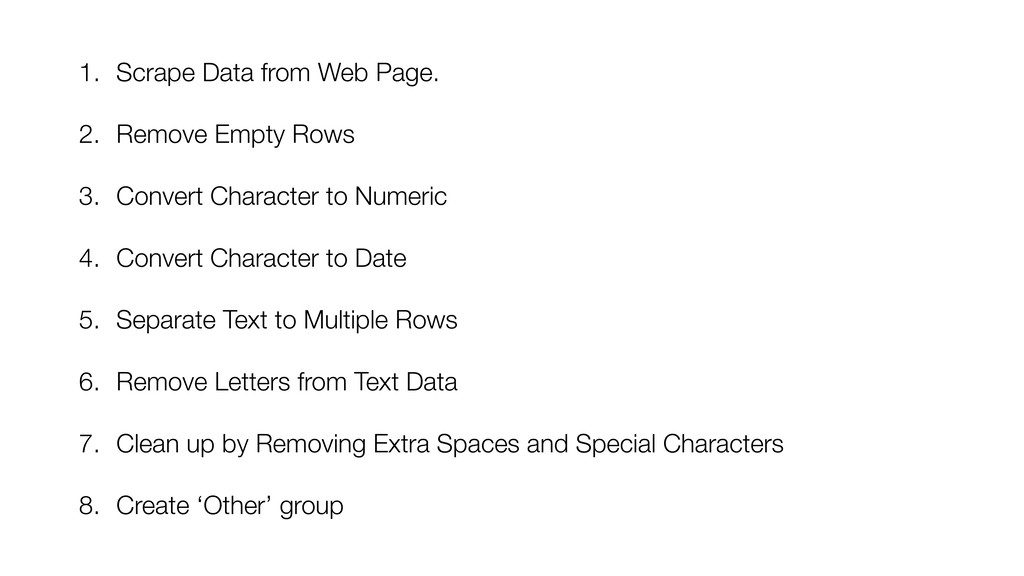
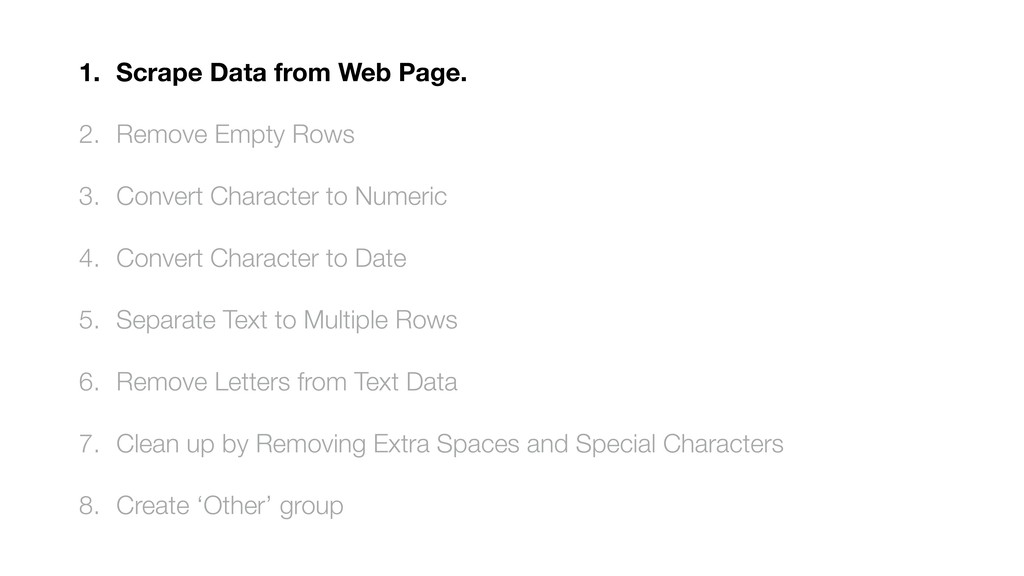
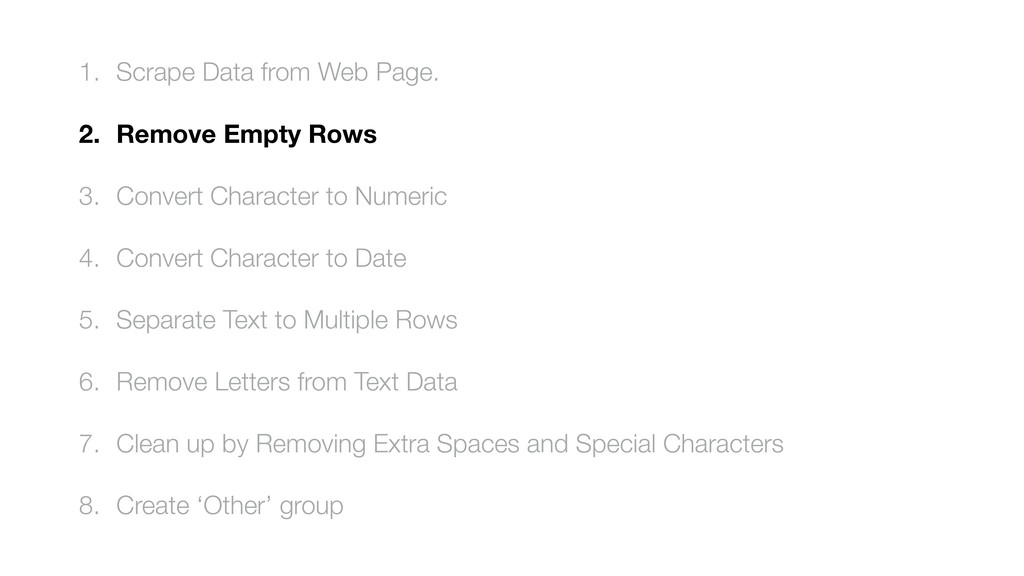
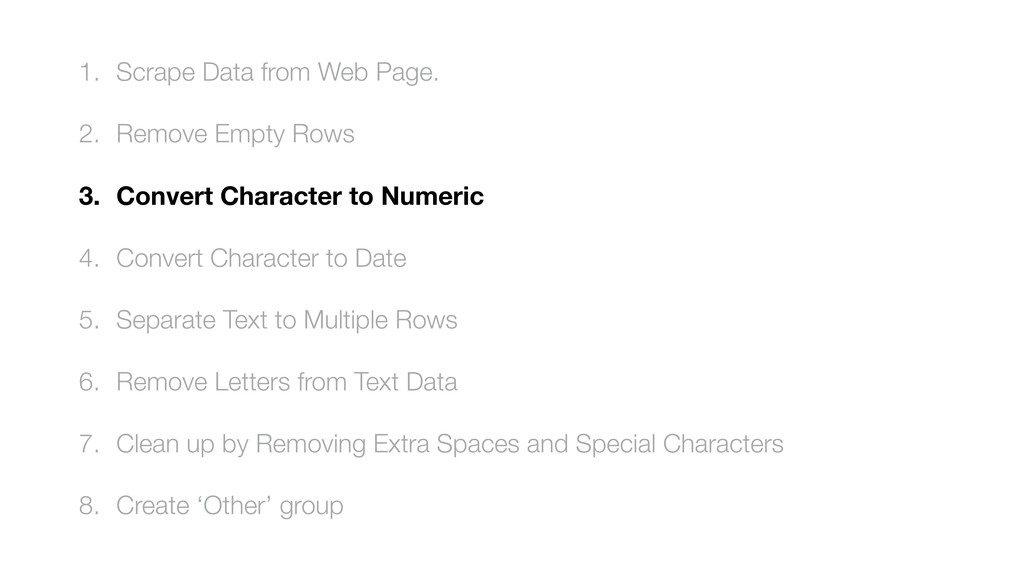
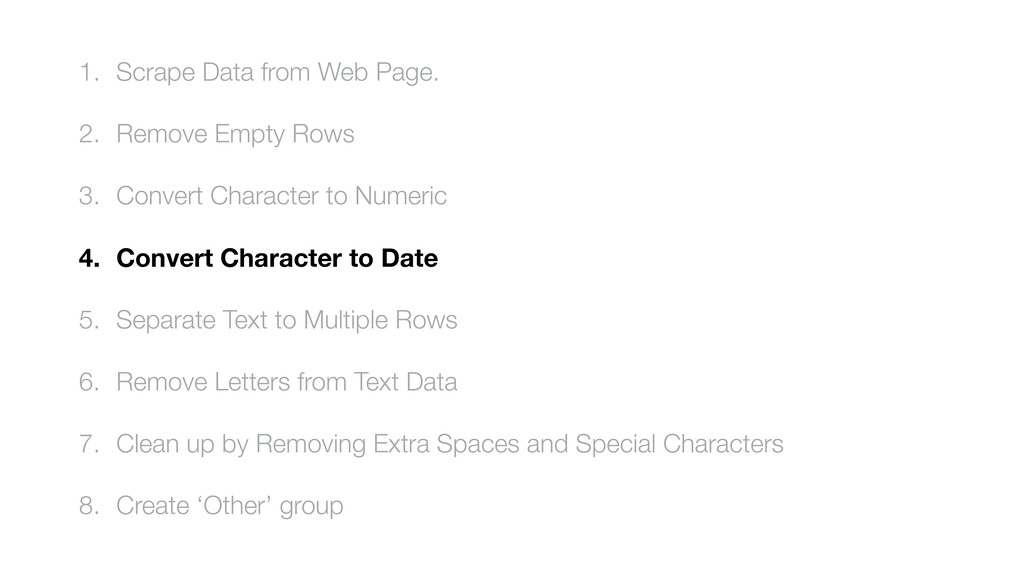
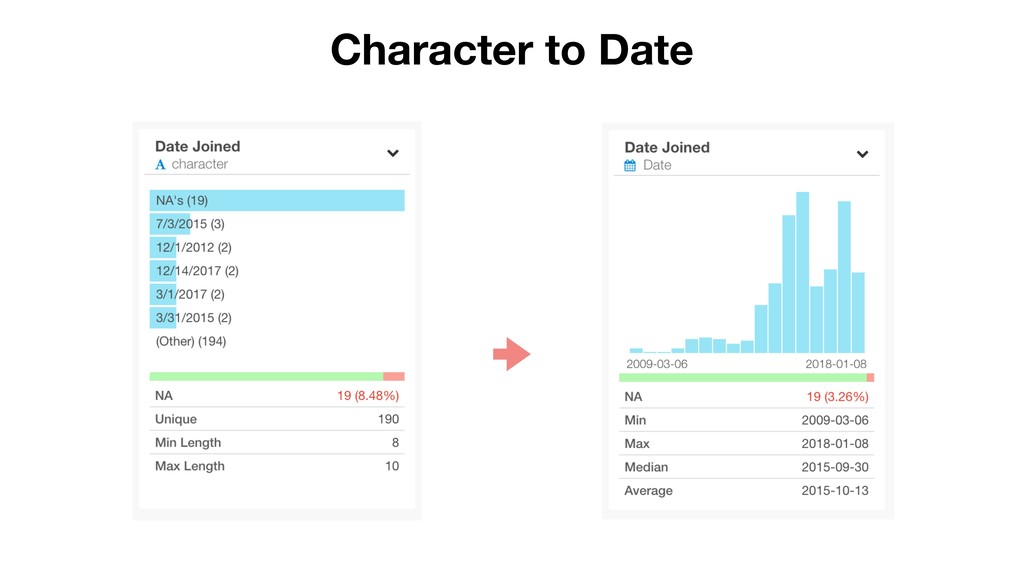
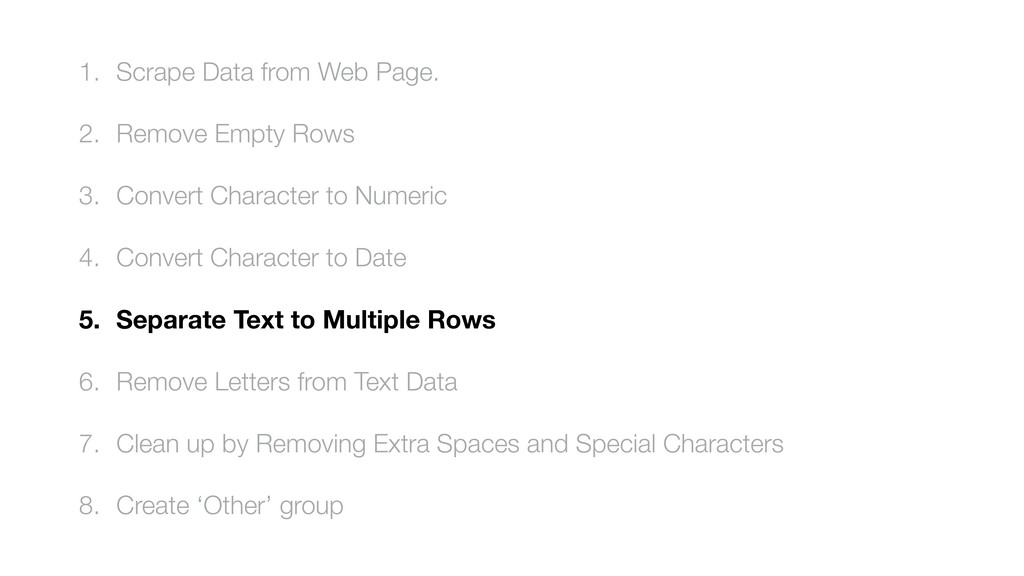
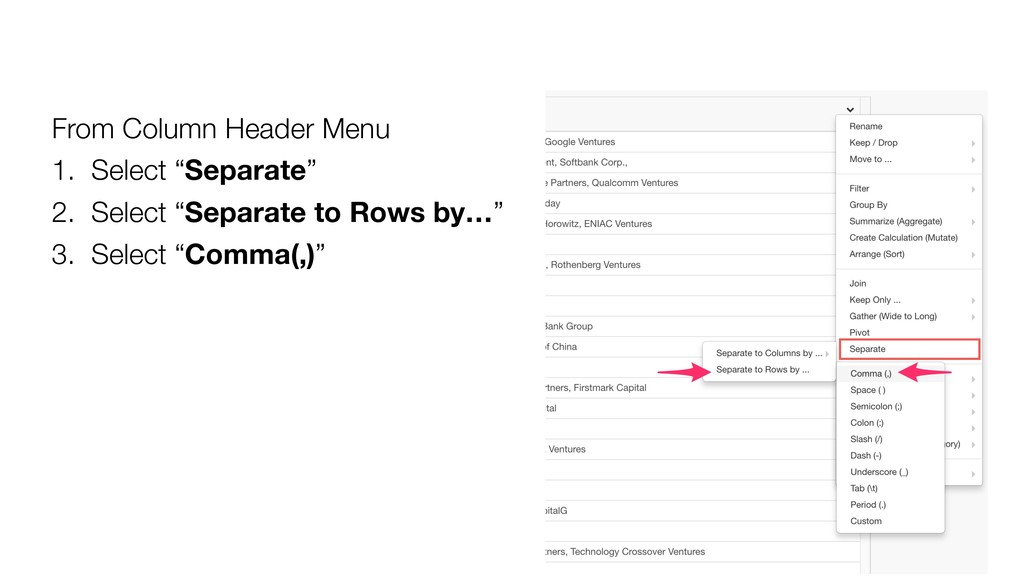
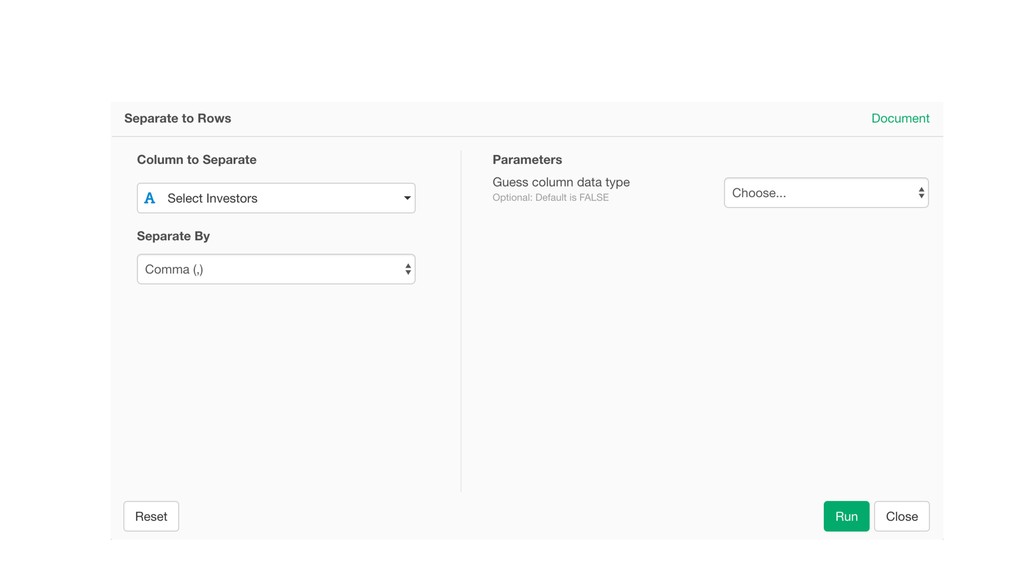
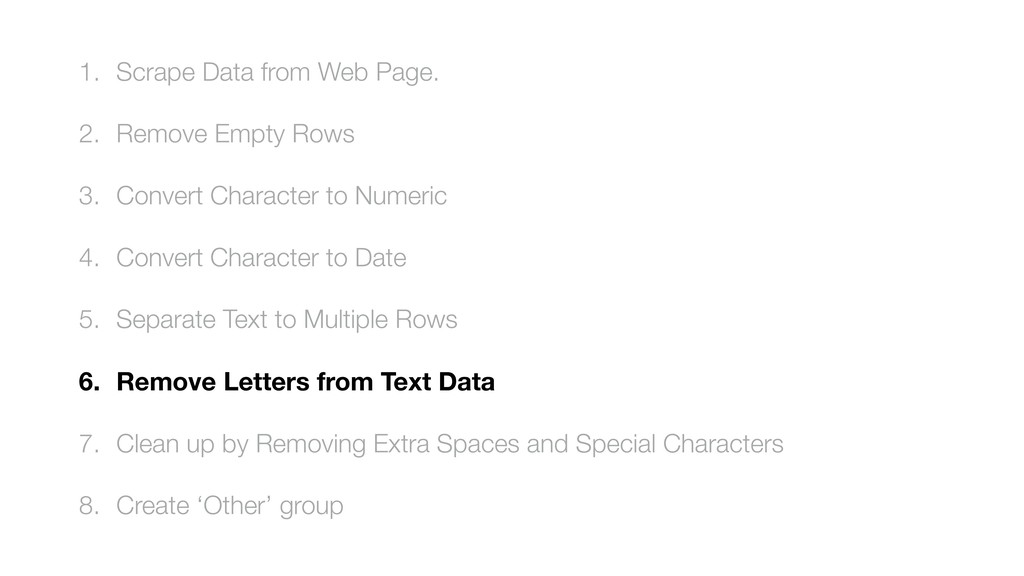
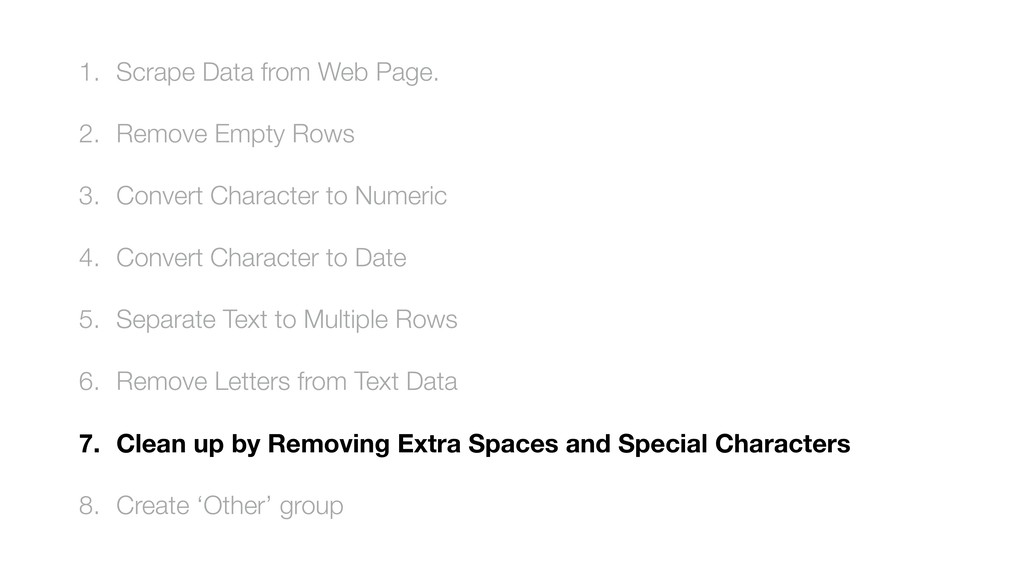
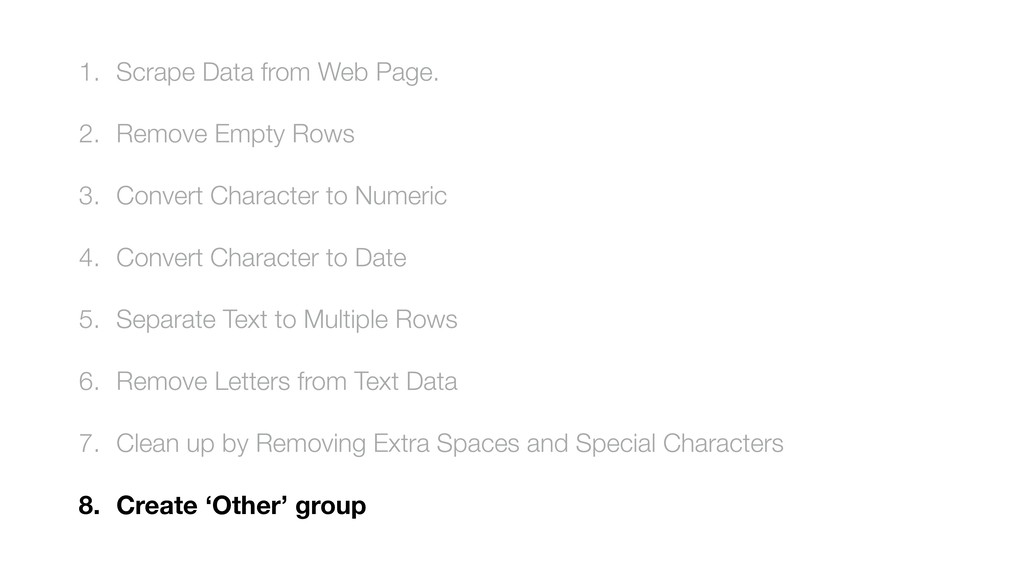
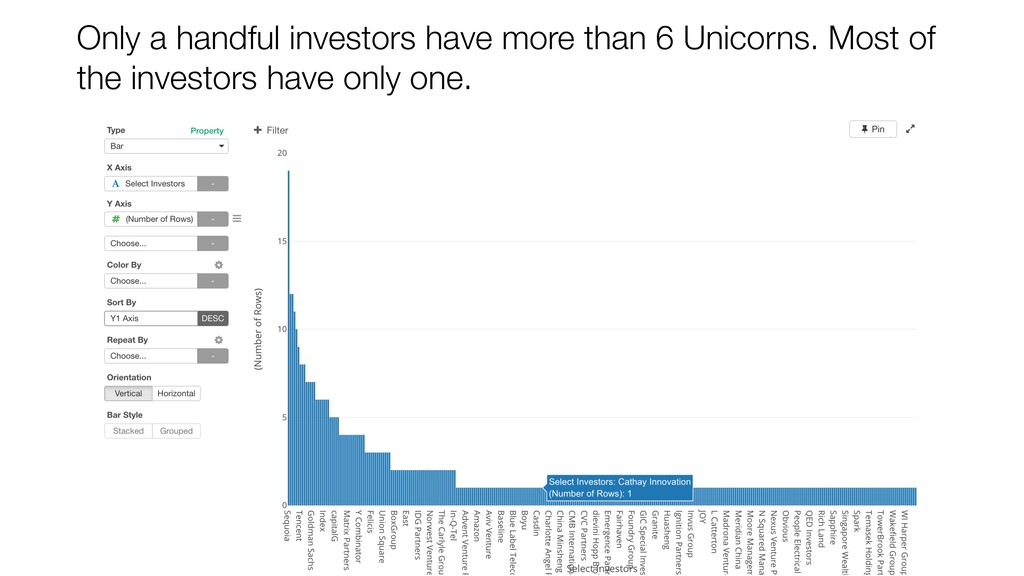
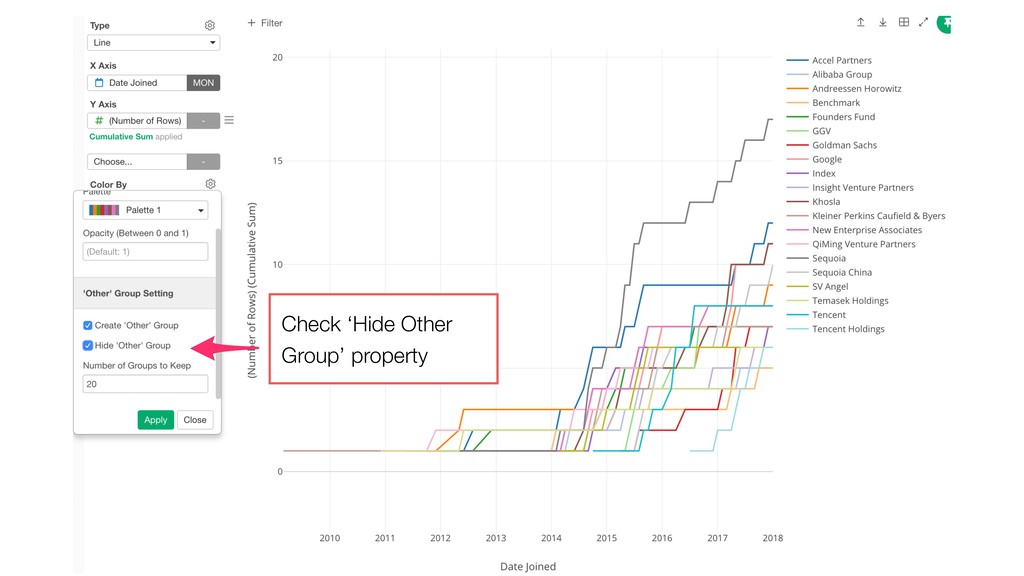
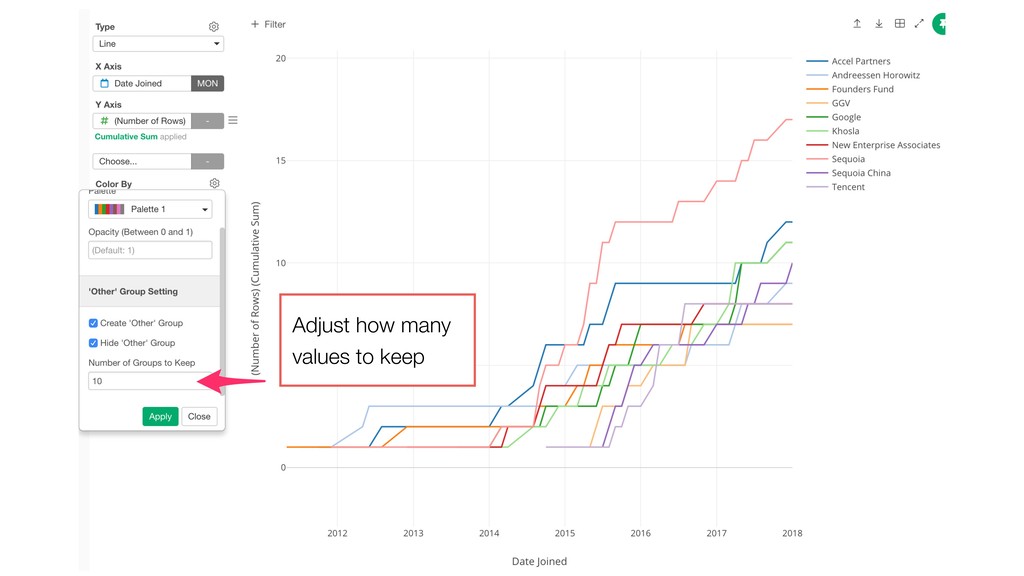
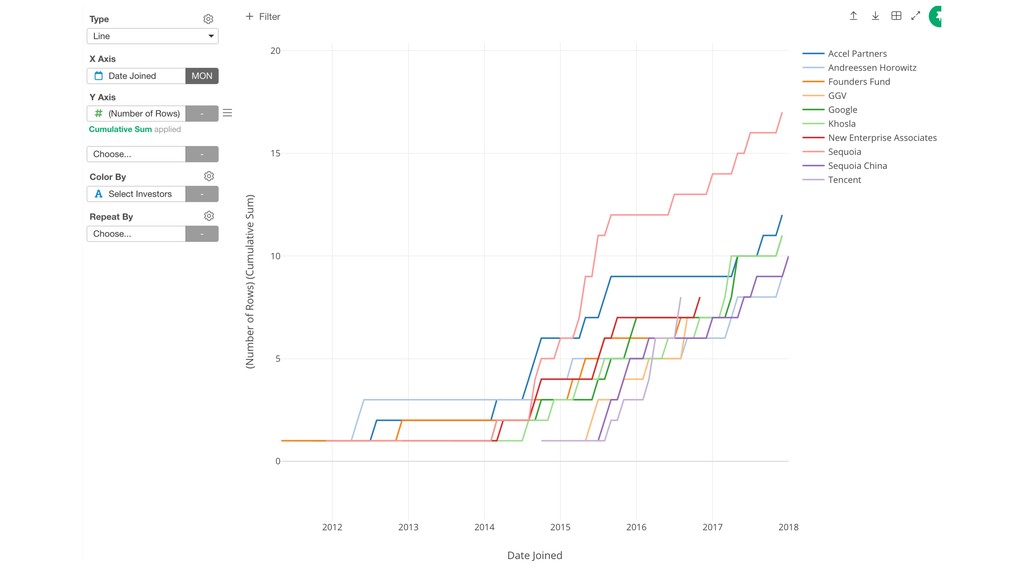
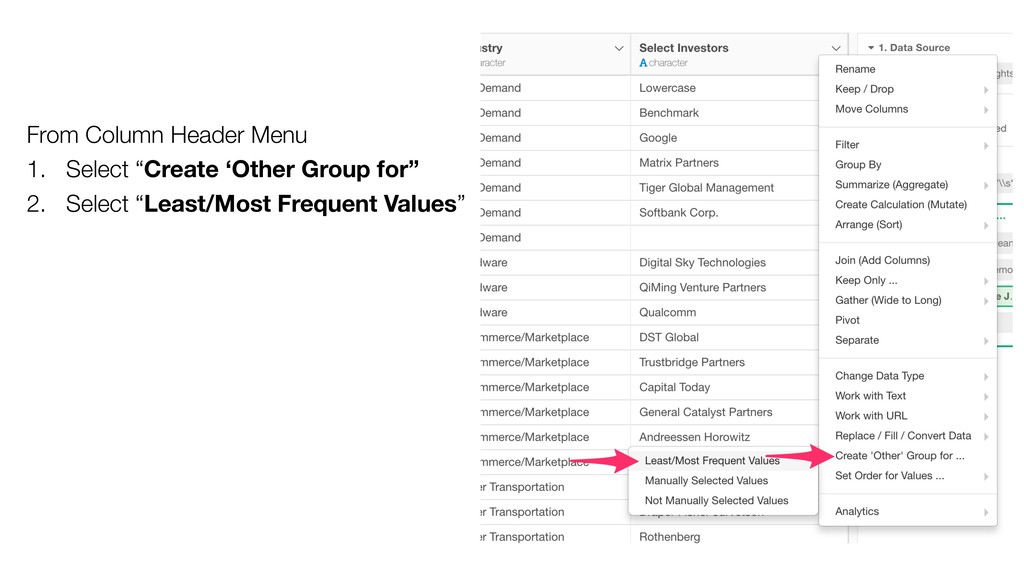
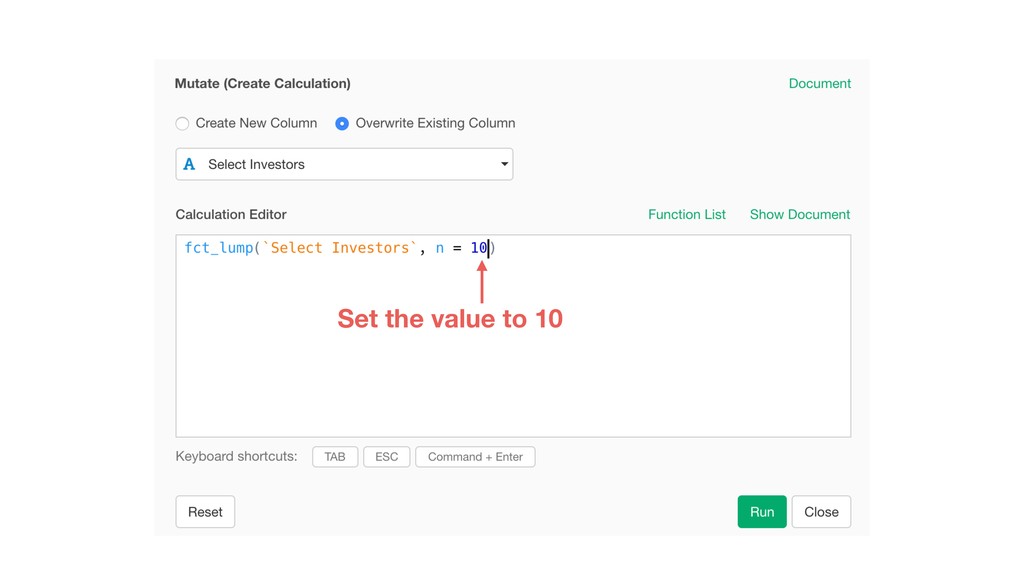
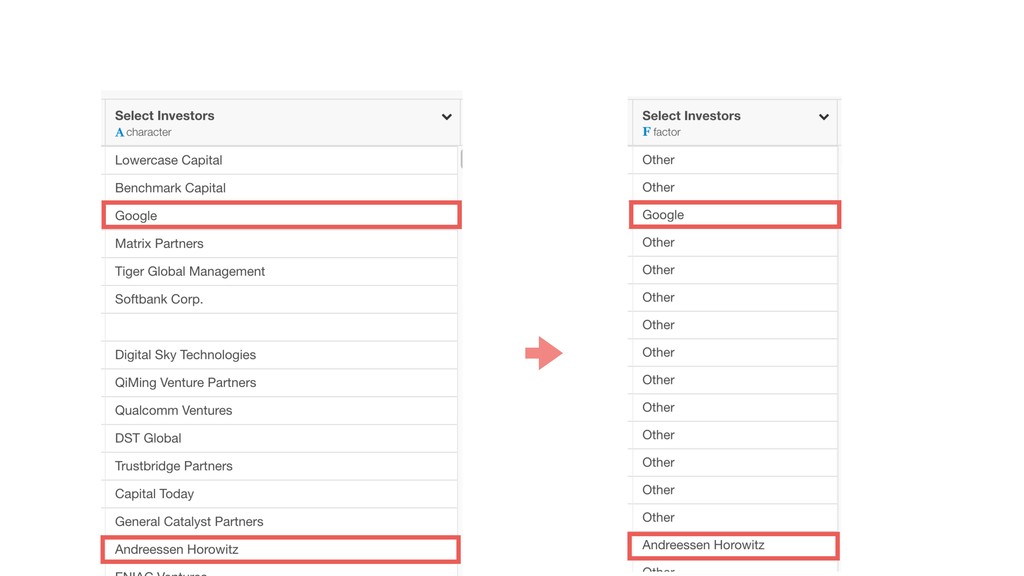
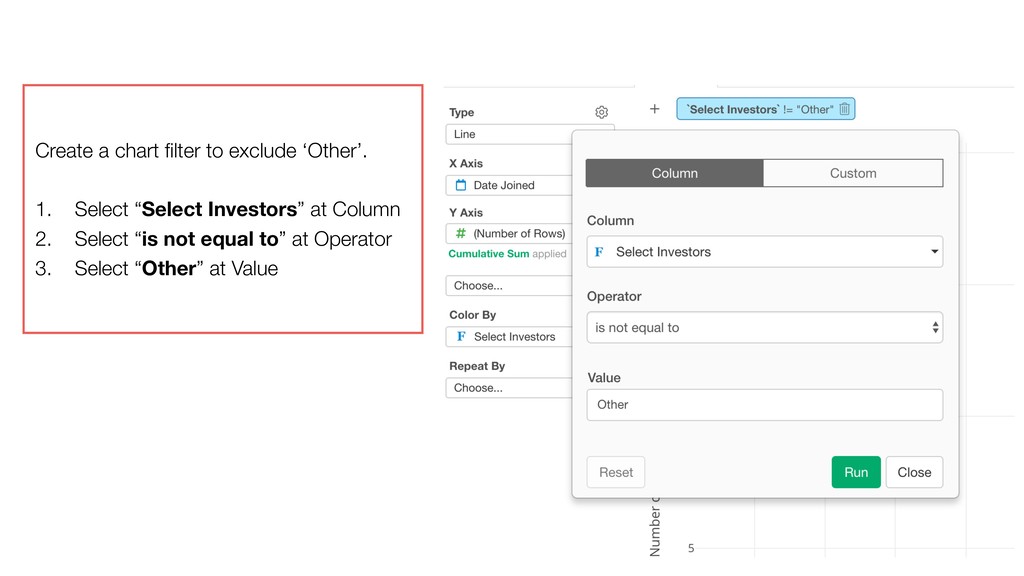
3. Convert Character to Numeric 4. Convert Character to Date 5. Separate Text to Multiple Rows 6. Remove Letters from Text Data 7. Clean up by Removing Extra Spaces and Special Characters 8. Create ‘Other’ group
3. Convert Character to Numeric 4. Convert Character to Date 5. Separate Text to Multiple Rows 6. Remove Letters from Text Data 7. Clean up by Removing Extra Spaces and Special Characters 8. Create ‘Other’ group
3. Convert Character to Numeric 4. Convert Character to Date 5. Separate Text to Multiple Rows 6. Remove Letters from Text Data 7. Clean up by Removing Extra Spaces and Special Characters 8. Create ‘Other’ group
3. Convert Character to Numeric 4. Convert Character to Date 5. Separate Text to Multiple Rows 6. Remove Letters from Text Data 7. Clean up by Removing Extra Spaces and Special Characters 8. Create ‘Other’ group
3. Convert Character to Numeric 4. Convert Character to Date 5. Separate Text to Multiple Rows 6. Remove Letters from Text Data 7. Clean up by Removing Extra Spaces and Special Characters 8. Create ‘Other’ group
3. Convert Character to Numeric 4. Convert Character to Date 5. Separate Text to Multiple Rows 6. Remove Letters from Text Data 7. Clean up by Removing Extra Spaces and Special Characters 8. Create ‘Other’ group
3. Convert Character to Numeric 4. Convert Character to Date 5. Separate Text to Multiple Rows 6. Remove Letters from Text Data 7. Clean up by Removing Extra Spaces and Special Characters 8. Create ‘Other’ group
3. Convert Character to Numeric 4. Convert Character to Date 5. Separate Text to Multiple Rows 6. Remove Letters from Text Data 7. Clean up by Removing Extra Spaces and Special Characters 8. Create ‘Other’ group
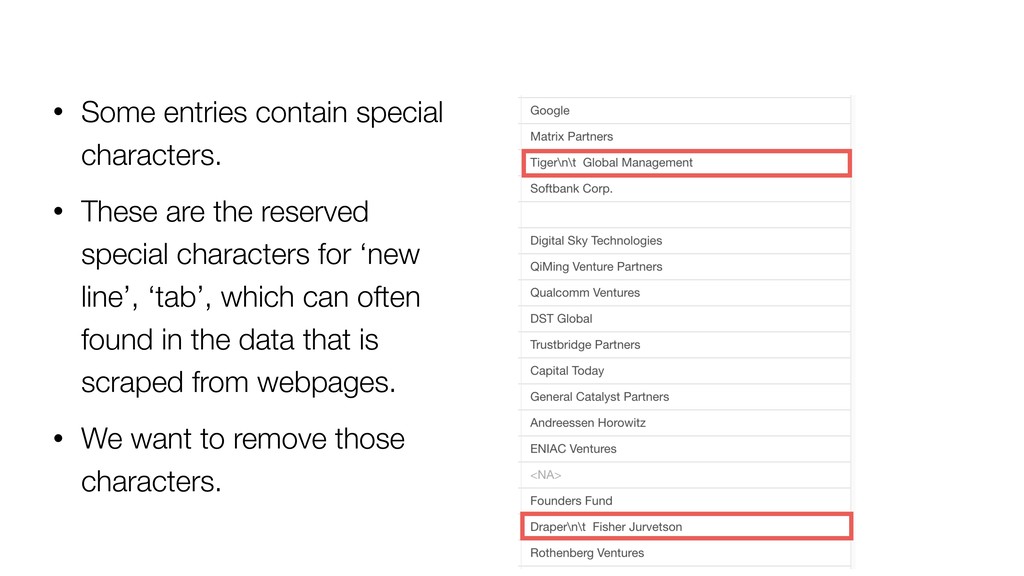
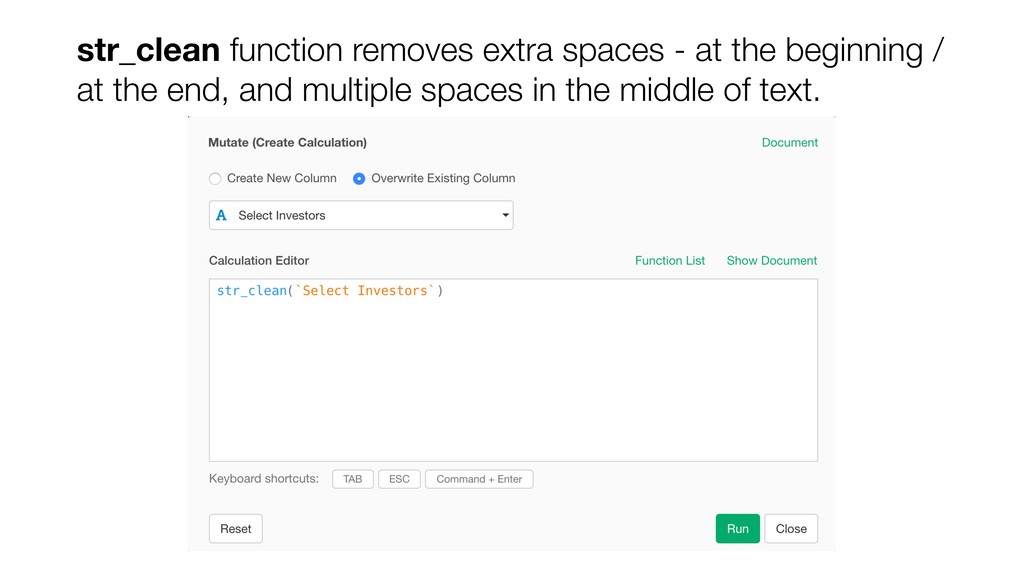
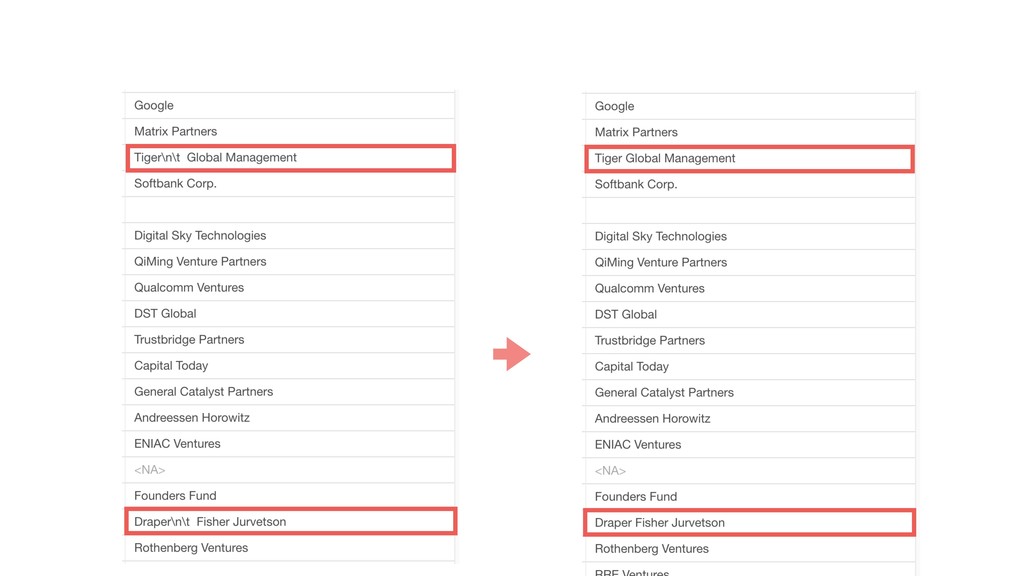
reserved special characters for ‘new line’, ‘tab’, which can often found in the data that is scraped from webpages. • We want to remove those characters.
3. Convert Character to Numeric 4. Convert Character to Date 5. Separate Text to Multiple Rows 6. Remove Letters from Text Data 7. Clean up by Removing Extra Spaces and Special Characters 8. Create ‘Other’ group
![Regular Expression [\d,]+(\.\d+)? “Exchange Rate for Bitcoin to USD is](https://files.speakerdeck.com/presentations/e309984e955940b4b7750d4fe7bf241e/slide_9.jpg)
![@[[a-zA-Z0-9].-]+$ “[email protected]” exploratory.io Extract a domain from email. Regular Expression](https://files.speakerdeck.com/presentations/e309984e955940b4b7750d4fe7bf241e/slide_10.jpg)
![Contact Email [email protected] Data Science Training https://exploratory.io/training Twitter @KanAugust Online](https://files.speakerdeck.com/presentations/e309984e955940b4b7750d4fe7bf241e/slide_84.jpg)