The 3rd in a three part series outlining the basic tools to get started with data visualization for the web. This talk will focus on using Google Refine to manipulate data and d3 to generate some impressive visualizations with minimal effort.
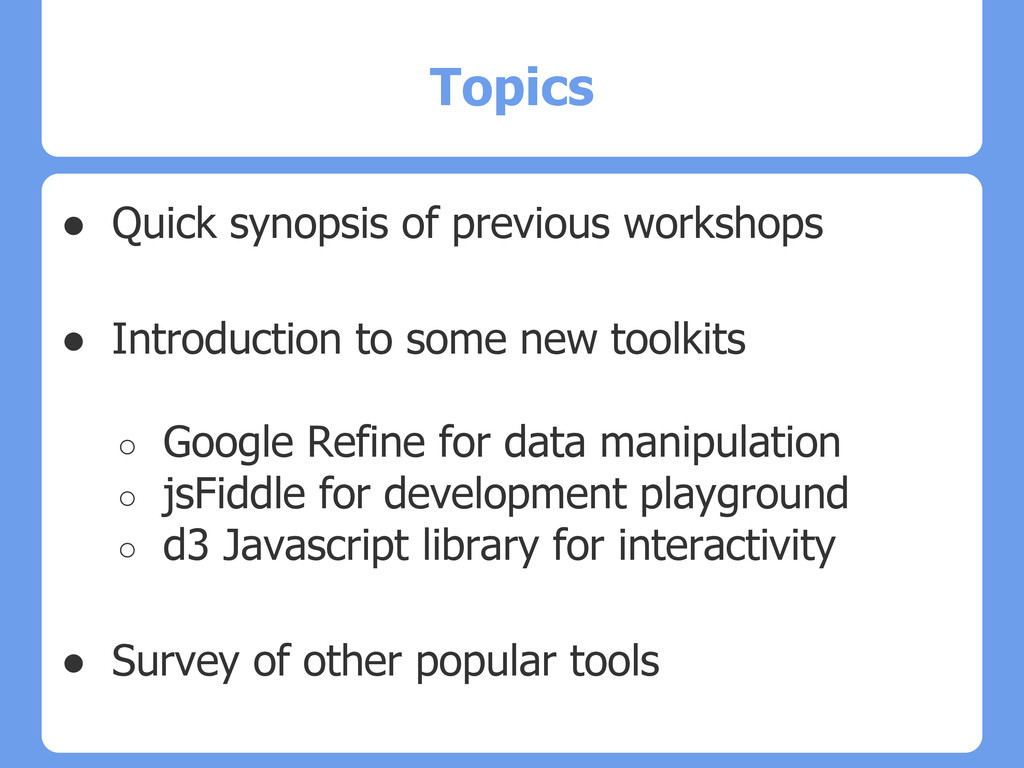
some new toolkits ◦ Google Refine for data manipulation ◦ jsFiddle for development playground ◦ d3 Javascript library for interactivity • Survey of other popular tools
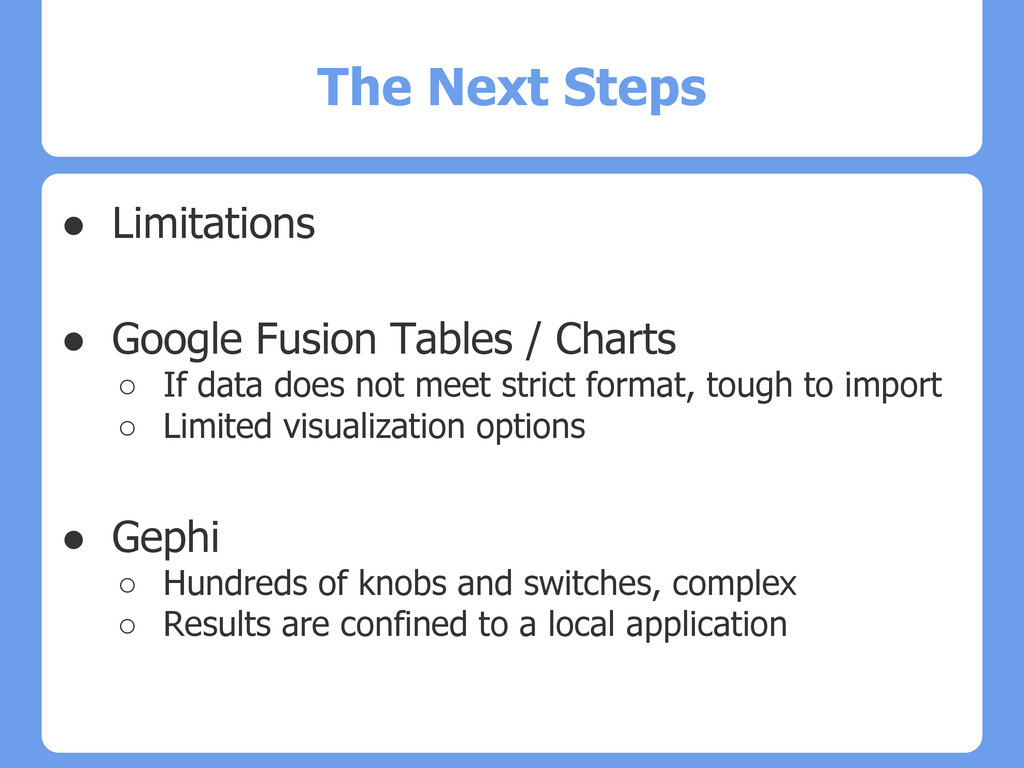
Charts ◦ If data does not meet strict format, tough to import ◦ Limited visualization options • Gephi ◦ Hundreds of knobs and switches, complex ◦ Results are confined to a local application
lets clean up a data set • Google Refine ◦ Tool to clean up data ◦ De-duplication, mass change operations ◦ Facet, Pivot, Clustering ◦ Powerful export options, JSON templates • Tutorial url - http://bit.ly/124JB1J
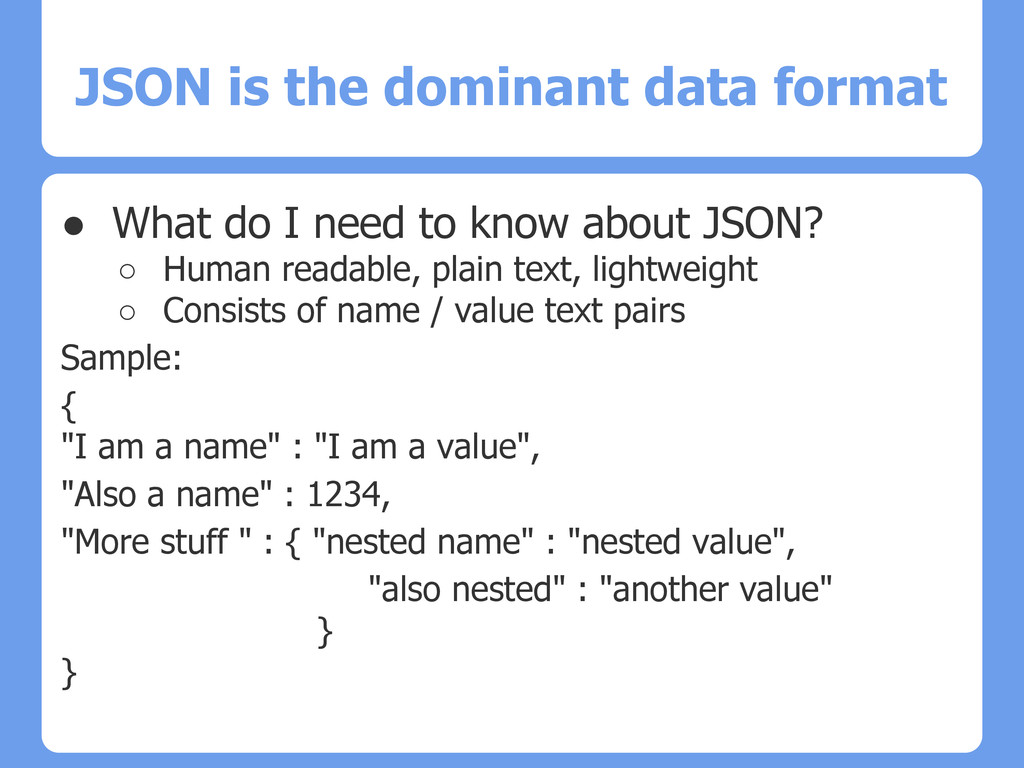
need to know about JSON? ◦ Human readable, plain text, lightweight ◦ Consists of name / value text pairs Sample: { "I am a name" : "I am a value", "Also a name" : 1234, "More stuff " : { "nested name" : "nested value", "also nested" : "another value" } }
Custom programming is hard • Bonus - People have done the heavy lifting • We will hack, borrow and steal for now to get our chops up to speed • What looks cool?