Upgrade to Pro — share decks privately, control downloads, hide ads and more …

Online media in Germany 2013: Cat food, iPhones and a free hugs

klischka
February 08, 2013

Online media in Germany 2013: Cat food, iPhones and a free hugs

klischka

February 08, 2013
Tweet

More Decks by klischka

Other Decks in Business

Transcript

  1. Spiegel Online 1996 ! May 1994 on Compuserve, 25. October

    1994 WWW ! 2 part-time editors 1995 ! 52.000 visits in 1/1995 ! 213.000 visits in 2/1996 ! Weekly Updates ! Ads since 11/1995 (230 ads in the first 5 months) http://klischka.de/s/spon1996
  2. Spiegel Online 2013 ! 135+ full-time editors ! 11,7 million

    unique users/month, 5,39 million per week (2/2013) ! 120+ articles a day ! Homepage Wallpaper-Ad: 65.000 Euros / day
  3. Web usage became mainstream – internet penetration is at 76

    % 1997 1998 1999 2000 2001 2002 2003 2004 2005 2006 2007 2008 2009 2010 2011 2012 0 10 20 30 40 50 60 70 80 6,5 10,4 17,7 28,6 38,8 44,1 51,5 52,6 56,7 57,6 60,7 64,3 64,7 68,1 72,6 75,9 Internet users per 100 inhabitants (usage in the last four weeks) Base: German population 14 years and older Source: ARR/ZDF-Onlinestudie (http://www.ard-zdf-onlinestudie.de) Average usage 5,6 days/week 138 min/day
  4. steady increase in online usage in age groups 50 years

    and older in the past two years 1997 1998 1999 2000 2001 2002 2003 2004 2005 2006 2007 2008 2009 2010 2011 2012 0 10 20 30 40 50 60 70 80 90 100 6,3 15,6 30 48,5 67,4 76,9 92,1 94,7 95,7 97,3 95,8 97,2 97,5 100 100 100 12,4 18,9 24,5 41,1 50,3 65,6 73,1 75,9 79,9 80,6 81,9 87,9 89,4 89,9 94,4 97,6 7,7 11,1 19,6 32,2 49,3 47,8 67,4 69,9 71 72 73,8 77,3 80,2 81,9 90,7 89,4 3 4,4 15,1 22,1 32,2 35,4 48,8 52,7 56,5 60 64,2 65,7 67,4 68,9 69,1 76,8 0,2 0,8 1,9 4,4 8,1 7,8 13,3 14,5 18,4 20,3 25,1 26,4 27,1 28,2 34,5 39,2 Internet users per 100 inhabitants in age group (usage in last three months) 14–19 20–29 30–39 40–49 50–59 60+ year % Base: German population 14 years and older Source: ARR/ZDF-Onlinestudie (http://klischka.de/s/onliner)
  5. In absolute numbers: the majority of German web users is

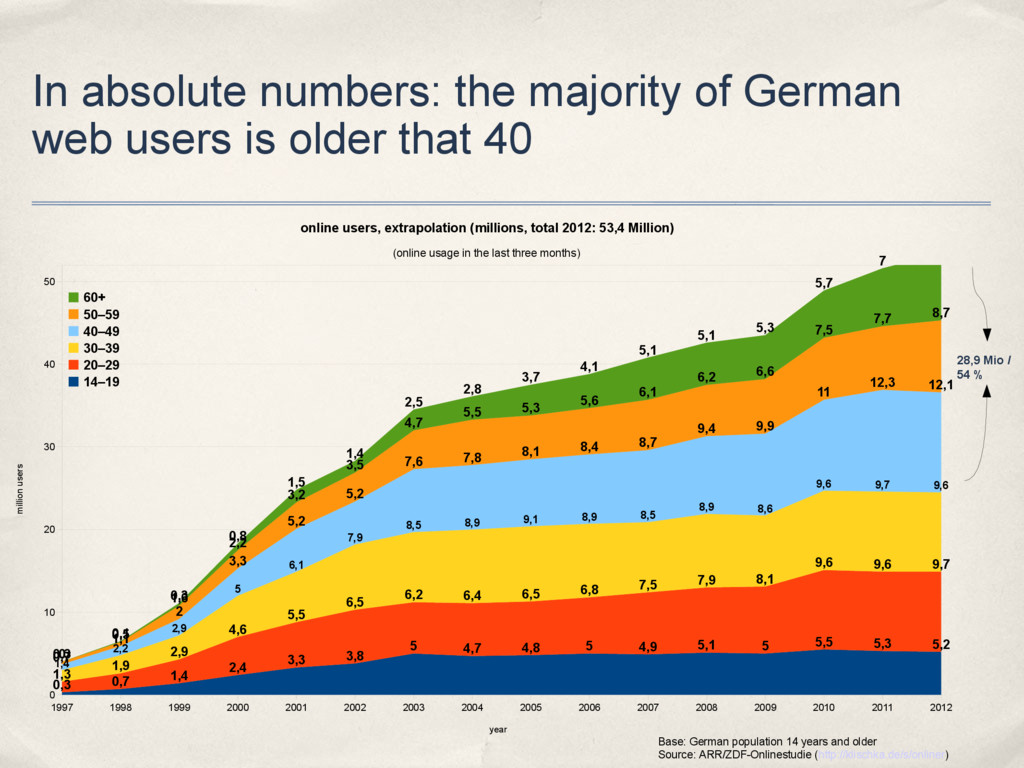
    older that 40 1997 1998 1999 2000 2001 2002 2003 2004 2005 2006 2007 2008 2009 2010 2011 2012 0 10 20 30 40 50 0,3 0,7 1,4 2,4 3,3 3,8 5 4,7 4,8 5 4,9 5,1 5 5,5 5,3 5,2 1,3 1,9 2,9 4,6 5,5 6,5 6,2 6,4 6,5 6,8 7,5 7,9 8,1 9,6 9,6 9,7 1,4 2,2 2,9 5 6,1 7,9 8,5 8,9 9,1 8,9 8,5 8,9 8,6 9,6 9,7 9,6 0,7 1,1 2 3,3 5,2 5,2 7,6 7,8 8,1 8,4 8,7 9,4 9,9 11 12,3 12,1 0,3 0,5 1,6 2,2 3,2 3,5 4,7 5,5 5,3 5,6 6,1 6,2 6,6 7,5 7,7 8,7 0 0,1 0,3 0,8 1,5 1,4 2,5 2,8 3,7 4,1 5,1 5,1 5,3 5,7 7 online users, extrapolation (millions, total 2012: 53,4 Million) (online usage in the last three months) 60+ 50–59 40–49 30–39 20–29 14–19 year million users Base: German population 14 years and older Source: ARR/ZDF-Onlinestudie (http://klischka.de/s/onliner) 28,9 Mio / 54 %
  6. Mobile Usage explodes – high growth potential, highest growth in

    young population 2010 2011 2012 1. Half 2012 2. Half 0 5 10 15 20 25 10,95 16,95 19,18 21,3 Unique Mobile Users (Millions / 30 days, 14 and above) Source: AGOF Mobile Facts II/2012 (http://www.agof.de/aktuelle-studie.1022.de.html) + 11 % + 55 % + 13 % 70,3 % 20-49 years old
  7. Some attention shifts to the web, overall media usage increases

    Source: ARD/ZDF-Langzeitstudie Massenkommunikation (http://klischka.de/s/mk00 / http://klischka.de/s/mk10) 220 187 83 23 35 28,5 6 Average daily media usage 2011 (in minutes per day, Germans aged 14+) TV Radio Internet Newspaper Music-CD Books Magazines 185 206 13 30 36 18 10 Average daily media usage 2000 (in minutes per day, Germans aged 14+) TV Radio Internet Newspaper Music-CD Books Magazines
  8. Some attention shifts to the web, overall media usage increases

    – TV/Radio/Newpapers loose younger users Source: ARD/ZDF-Langzeitstudie Massenkommunikation (http://klischka.de/s/mk00 / http://klischka.de/s/mk10) 130 127 136 8,5 75 28,5 3 Average daily media usage 2011 (in minutes per day, Germans aged 14-29) TV Radio Internet Newspaper Music-CD Books Magazines
  9. Newspapers are loosing readers: overall circulation 21,3% down since 2000

    2000 2001 2002 2003 2004 2005 2006 2007 2008 2009 2010 2011 2012 0 5 10 15 20 25 30 35 1,6 1,7 1,7 1,6 1,6 1,6 1,6 1,6 1,6 1,6 1,6 1,56 1,5 16,6 16,4 16,1 15,8 15,4 15,1 14,8 14,5 14,3 14 13,74 13,5 12,95 5,7 5,7 5,4 5,1 5 3,8 4,7 4,6 4,5 4,3 4,4 3,8 3,6 2 1,9 1,8 1,9 1,9 1,9 2 2 2 2 1,94 1,85 1,75 4,5 4,5 4,5 4,3 4,16 3,83 3,72 3,71 3,55 3,43 3,38 3,21 3,07 average circulation per issue in 2nd quarter of given year (millions) sunday papers weekly tabloid daily regional daily national broadsheet daily -21,9% -36,8% Source: IVW (http://www.ivw.de) But national Broadsheet are doing better, weekly Die Zeit gained 15%, now at 500.000+ sold copies, decline of Sunday Papers a bit misleading Bild am Sonntag lost 38%, but broadsheet Frankfurter Allgemeine Sonntagszeitung started in 2001 and sells 338.000 copies in 2011
  10. German top sites in June 2013 – 3 news sites

    in the top 50, 7 in the top 100 (unique monthly visitors) Source: Google Ad Planner (http://klischka.de/s/gap100) / *Nielsen (http://klischka.de/s/nielsentop10) Rank Domain 5/2013 1. google.de 2. facebook.com 3. youtube.com 4. ebay.de 5. wikipedia.org 6. amazon.de 7. yahoo.com 8. web.de 9. T-Online 10. live.com 14. chip.de 15. bild.de 18. partypoker.com 24. immobilienscout24.de 27. spiegel.de 35. rtl.de 38. news.de 55. welt.de 63. focus.de 79. stern.de 80. zdf.de 82. sueddeutsche.de Rank Domain 4/2012 1 google.de 2 facebook.com 3 youtube.com 4 ebay.de 5 amazon.de 6 wikipedia.org 7 t-online.de 8 web.de 14 bild.de 16 chip.de 18 Spiegel.de 20 mobile.de 24 immobilienscout24.de 31 computerbild.de 33 rtl.de 43 welt.de 47 focus.de Rank Domain 7/2011 1 google.de 2 facebook.com 3 youtube.com 4 ebay.de 5 wikipedia.org 6 t-online.de 7 amazon.de 8 web.de 13 bild.de 19 Partypoker 21 wer-kennt-wen.de 21 Spiegel.de 23 immobilienscout24.de 23 Mobile.de 24 otto.de
  11. Advertising revenue shifts to the web 2005 2006 2007 2008

    2009 2010 2011 2012 0 10 20 30 40 50 60 70 80 90 100 04,4% 08,7% 12,1% 14,8% 16,5% 19,2% 19,7% 21,8% 25,0% 24,1% 23,0% 22,0% 21,4% 19,0% 18,6% 17,0% 40,2% 37,7% 36,8% 36,9% 37,7% 39,1% 38,1% 38,2% 19,4% 18,9% 17,5% 16,1% 13,9% 12,9% 12,8% 12,0% Share of advertising spending 2005-2010: TV and web up, newspapers down (share of overall advertising gross revenue, %) trade magazine Posters Radio general interest magazines TV Newspapers Online Source: OVK / Nielsen Media Research (http://klischka.de/s/ovk10 Overall Revenue: 20,1 billion Euros Overall Revenue: 29,1 billion Euros
  12. Newspapers are loosing advertising revenue – overall revenue fell 11,3

    % from 1999 to 2011 1999 2000 2001 2002 2003 2004 2005 2006 2007 2008 2009 2010 2011 0 2 4 6 8 10 12 3,51 3,68 3,4 3,9 3,95 3,97 4,09 4,09 4,13 4,72 4,27 4,88 4,96 6,06 6,55 5,99 4,93 4,45 4,5 4,4 4,5 4,5 4,37 3,69 3,64 3,55 Newspaper revenue breakdown by segments (net revenue in billion Euros) advertising revenue (bn Euros) circulation revenue (bn Euro) - 41,41 % +41,31% Source: BVDZ (http://klischka.de/s/bdzv
  13. On the web newcomers take the majority of advertising revenue

    Source: OVK (http://klischka.de/s/ovk) ! Google took - estimated - 50 percent of German online advertising revenue in 2010 ! Google dominates the German search and search advertising market with a share of 93 % (3/2011, Webtrekk) 373 2.076 3.781 German online advertising revenue by segment (2010, million Euros) Affiliate Search Keywords (approx 93% Google) Banner/Layer/Video approx. net revenue approx. net revenue
  14. Mobile ad spending lagging behind mobile traffic Source: Emarketer (http://klischka.de/s/mobi)

    ! Mobile Reality in Germany in 2012: 21,3 Millionen unique mobile users, but only 4,1 % of digital ad spending (that's not even 1 % of total ad spending) Country % Digital % of total (2012) Digital % of total (2017) Mobile % of digital (2012) Mobile % of digital (2017) Growth 2012 -2017 mobile Growth 2012 -2017 digital Growth 2012 -2017 total media UK 40,4 % 51,1 % (est) 9,3 % 43,9 % (est) 47,8 % (est) 8,4 % (est) 3,4 % (est) Denmark 31,3 % 41,8 % (est) 6,4 % 24,2 % (est) 39,5 % (est) 7,4% (est) 1,4 % (est) Germany 19,7 % 26,6 % (est) 4,1 % 24,8 % (est) 54 % (est) 7,6 % (est) 1,3 % (est)
  15. Monetization: Will mobile advertising grow as fast as mobile usage?

    Source: KPCB Internet Trends 2012 (http://klischka.de/s/kpcb) /
  16. On mobile web newcomers take the majority of advertising revenue

    Source: Emarketer (http://klischka.de/s/mobius Google 2.171 Facebook 339 Twitter 135 Apple (iAD) 124 Pandora 225 Other 844 US Net Mobile Ad Revenues, by Company (2012) (million USD) Google Facebook Twitter Apple (iAD) Pandora Other
  17. Top Ten most visited Social Networks in Germany 12/2012 Facebook

    Google Plus Xing Stayfriends Twitter Odnoklassniki Ask.fm Linkedin Tumblr Wer-kennt-wen 0 5 10 15 20 25 30 38,6 5,6 4,2 3,5 3,1 2,9 2,8 2,7 2,5 2,5 Unique Visitors per month (millions) Source: Comscore http://klischka.de/s/germannetw
  18. Top Ten Brands in German social media – they produce

    content for free and pay for audience amazon.de McDonalds Deutschland Stylefruits Kinder Riegel H&M Red Bull Nutella DM Drogerie Markt Coca-Cola Starbucks 2566198 2085057 1832014 1636255 1550974 1500383 1304738 1132852 1127795 979257 Source: Socialbakers http://klischka.de/s/fbbrands Facebook (mio. local fans 3/2013) Twitter (local fans 3/2013) @HUGOBOSS @MercedesBenz @NI_News @eventimDE @jedemengetipps @greenpeace_de @hmdeutschland @Audi_Online @deutschetelekom @TUI_com 165008 156508 148242 95565 73022 64209 56413 49665 38323 37482
  19. Share of visits from Google / Facebook to major German

    news sites Source: Comscore / FAZ (http://klischka.de/s/hsc) Focus.de 2/2010 Focus.de 2/2011 Bild.de 2/2010 Bild.de 2/2011 FAZ.net 2/2010 FAZ.net 2/2010 0 5 10 15 20 25 30 35 40 45 50 44,2 43,9 18,6 20,1 31,3 23,3 0,9 3,2 1,7 9,6 1,1 3,3 Google Facebook
  20. Caveat: For some audiences print is not dead Source: Xing

    (http://klischka.de/s/xing12012) Successful German magazine start-ups: est. Circulation 1/2013 about audience Landlust 2005 1.098.385 bi-monthly country-life 76% women 79% w. Garden 81,7% 40+ y.o. (vs 65,1% oa) Laviva 2008 320.240 monthly food, 93% women Wellness 38% 40+ y.o Grazia 2010 181.046 weekly celebrity, 96% woman fashion 66% 20-49 y.o.
  21. German publisher Hubert Burda in 2009: „You get lousy pennies

    on the web.“ (for journalism) Source: Heise (http://klischka.de/s/hbpennies)
  22. Hubert Burda Media earns a lot of pennies on the

    web – 937 million Euros in 2011 Source: Hubert Burda Media (http://klischka.de/s/burda) Private company, revenue 2,1 billion Euros 2011, 8.248 employees. 658 € 30% 385 € 18% 937 € 43% 189 € 9% 7 € 0% Hubert Burda Media revenue breakdown by segments 2011 (million Euros) publishing Germany publishing international digital printing plants other -1,6 % +48,2 % +59,6 % +16,6 %
  23. … but not so much with journalism, rather with cat

    food, gadgets and games Source: Hubert Burda Media (http://klischka.de/s/burdadig) digital acquisitions (minority/majority) over the years since 1999: ! E-Commerce: Zooplus (stuff for pets), Lumas (photo art), Cyberport (Tech) ! Social Networks: Xing ! Special Interest Portals: Edellight, Suite101, Etsy (handcrafted stuff), Holidaycheck (hotel reviews), Jameda (doctor reviews), Elitepartner (online dating), Glam (Blogs) ! Games: GameDuell ! Online Media: Focus Online, Chip Online
  24. Xing – some people pay for using a social network

    Source: Xing (http://klischka.de/s/xing) For a premium account you pay 71,40 Euros / year. That's what you get: ! Sending messages to everybody ! Seeing who visited your profile ! Some discounts and special deals It works for Xing: ! 10,45 million members in 2010 – 745.000 premium members (7,1 %) ! 54,3 million € revenue 2010, EBITDA 16,7 million € - 31% margin 13,18 million members in 1Q2013 – 810.000 paying members (5,9 %) 19,59 million € revenue 1Q2013, EBITDA 5,3 million € - 27% margin
  25. Axel Springer AG CEO Mathias Döpfner about the iPad (2010):

    (Publishers should) „Sit down once a day and pray to thank Steve Jobs that he is saving the publishing industry.“ Source: PBS (http://klischka.de/s/mdipad)
  26. Springer: Buying digital competitors - digital media share of total

    revenues 33 % in 2013 Company: ! 40,8 % of shares free floated, majority of shares owned by Friede Springer ! 3,3 billion Euros revenue / 13.651 employees in 2012 Problems: ! Bild lost 34 % of its circulation in ten years: 4,4 m. (2/2001) > 2,9 m (2/2011) ! Wanted to take over TV-conglomerate ProsiebenSat1 in 2005 – anti-trust-authority stopped the deal Many digital acquisitions over the years: ! Advertising: online brochures (KaufDA), career portals (Stepstone), price comparison service (Idealo), property portals (Immonet, Seloger), affiliate advertising (Zanox) ! Special interest Communities / Portals (Transfermarkt, aufeminin.com, netmums.com, finanzen.net) ! Online games (Gamigo)
  27. Springer: paid content on mobile devices for journalism brings 189.066

    digital customers (1H/2011) Source: Axel Springer Analystencall H1 2011 (http://klischka.de/s/asv ! Bild and Welt available since 12/2009 as iPhone Apps (79 Cent / issue) ! Bild HD for iPad since 12/2010, Welt HD since 6/2010 ! Price: 0,79 € / issue; 9,99 € / month; 89,99 € / year
  28. Springer: Portals and digital classified bring high margins Source: Axel

    Springer Analystencall H1 2011 (http://klischka.de/s/asv
  29. Springer: digital advertising revenues higher than print advertising since 2011

    Source: Axel Springer Analystencall H1 2011 (http://klischka.de/s/asv)
  30. Der Spiegel – no cat food, no online gaming, just

    (profitable) journalism Sources: IVW (www.ivw.de) / Konzernabschluss Rudolf Augstein GmbH 2011 (http://ebundesanzeiger.de) ! Der Spiegel is Germanys leading news magazine and the largest in Europe ! Der Spiegel lost 11% of its circulation form 2/2001 (1,1 million) till 2/2011 (961.000) – but gained 26% in subscriptions (456.819) (IVW numbers) ! more than 270 editors work for the print edition, more than 120 for Spiegel Online 92 28% 140 43% 32 10% 46 14% 14 4% print advertising circulation Online TV production other Revenue breakdown 2011 in million €: 318 million € revenue, 43 million € net income according to public financial statements