Upgrade to Pro — share decks privately, control downloads, hide ads and more …

Massey Ratings for Match Outcome Prediction in ...

Sponsored · Your Podcast. Everywhere. Effortlessly. Share. Educate. Inspire. Entertain. You do you. We'll handle the rest.

Massey Ratings for Match Outcome Prediction in Table Tennis: Evidence of Greater Stability than the ITTF World Ranking

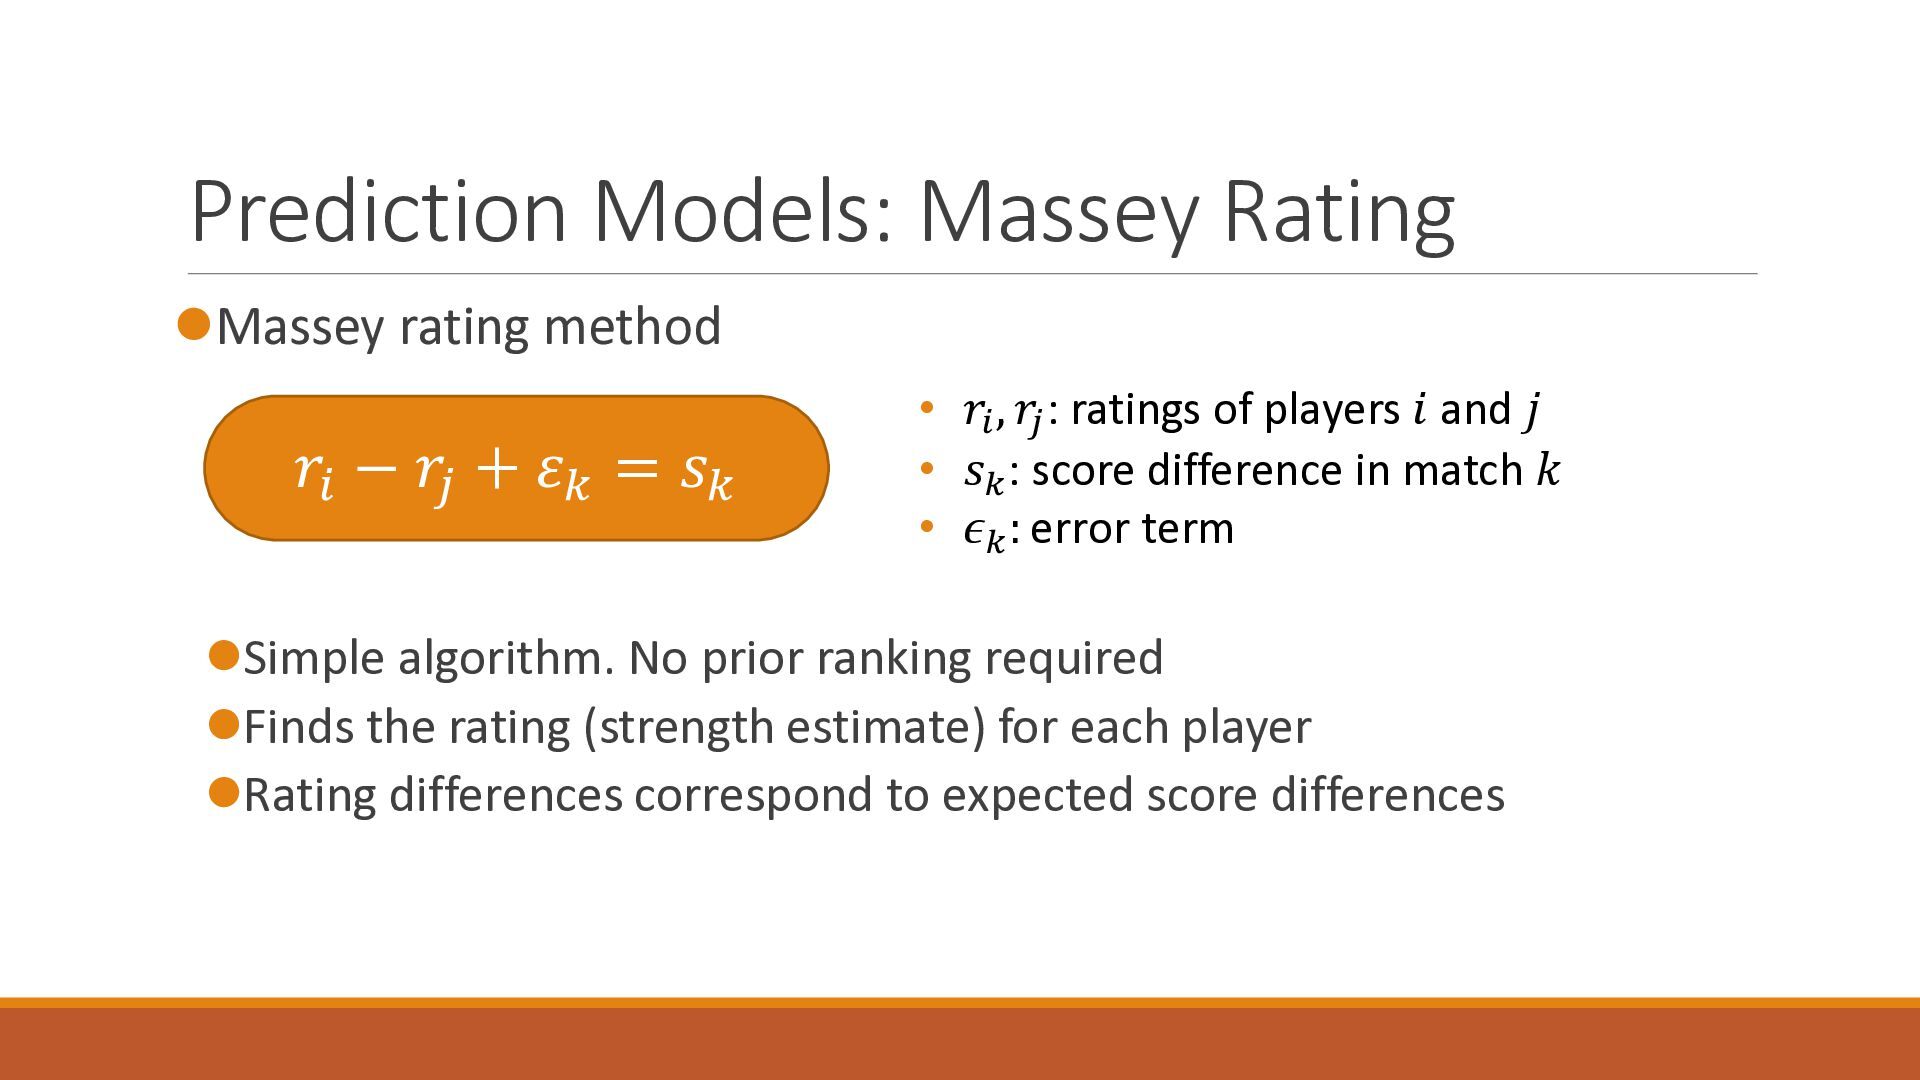
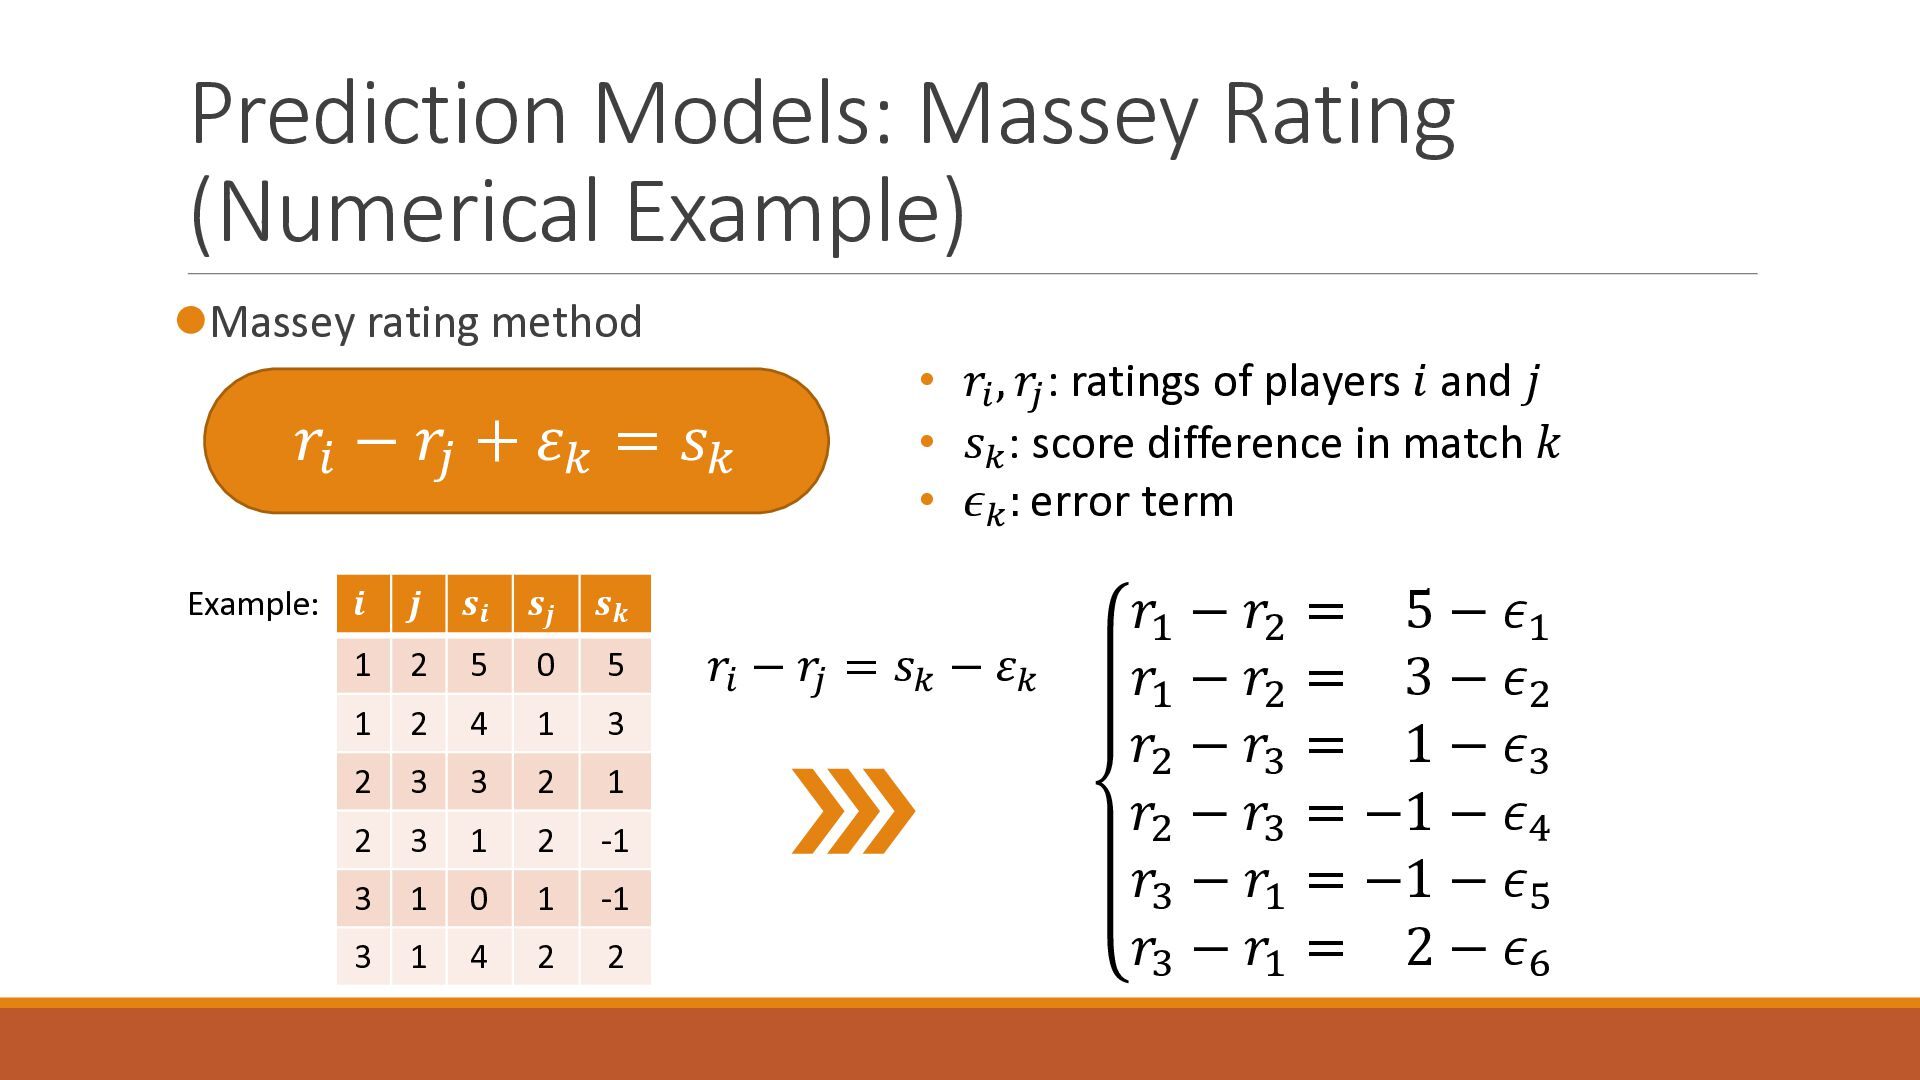
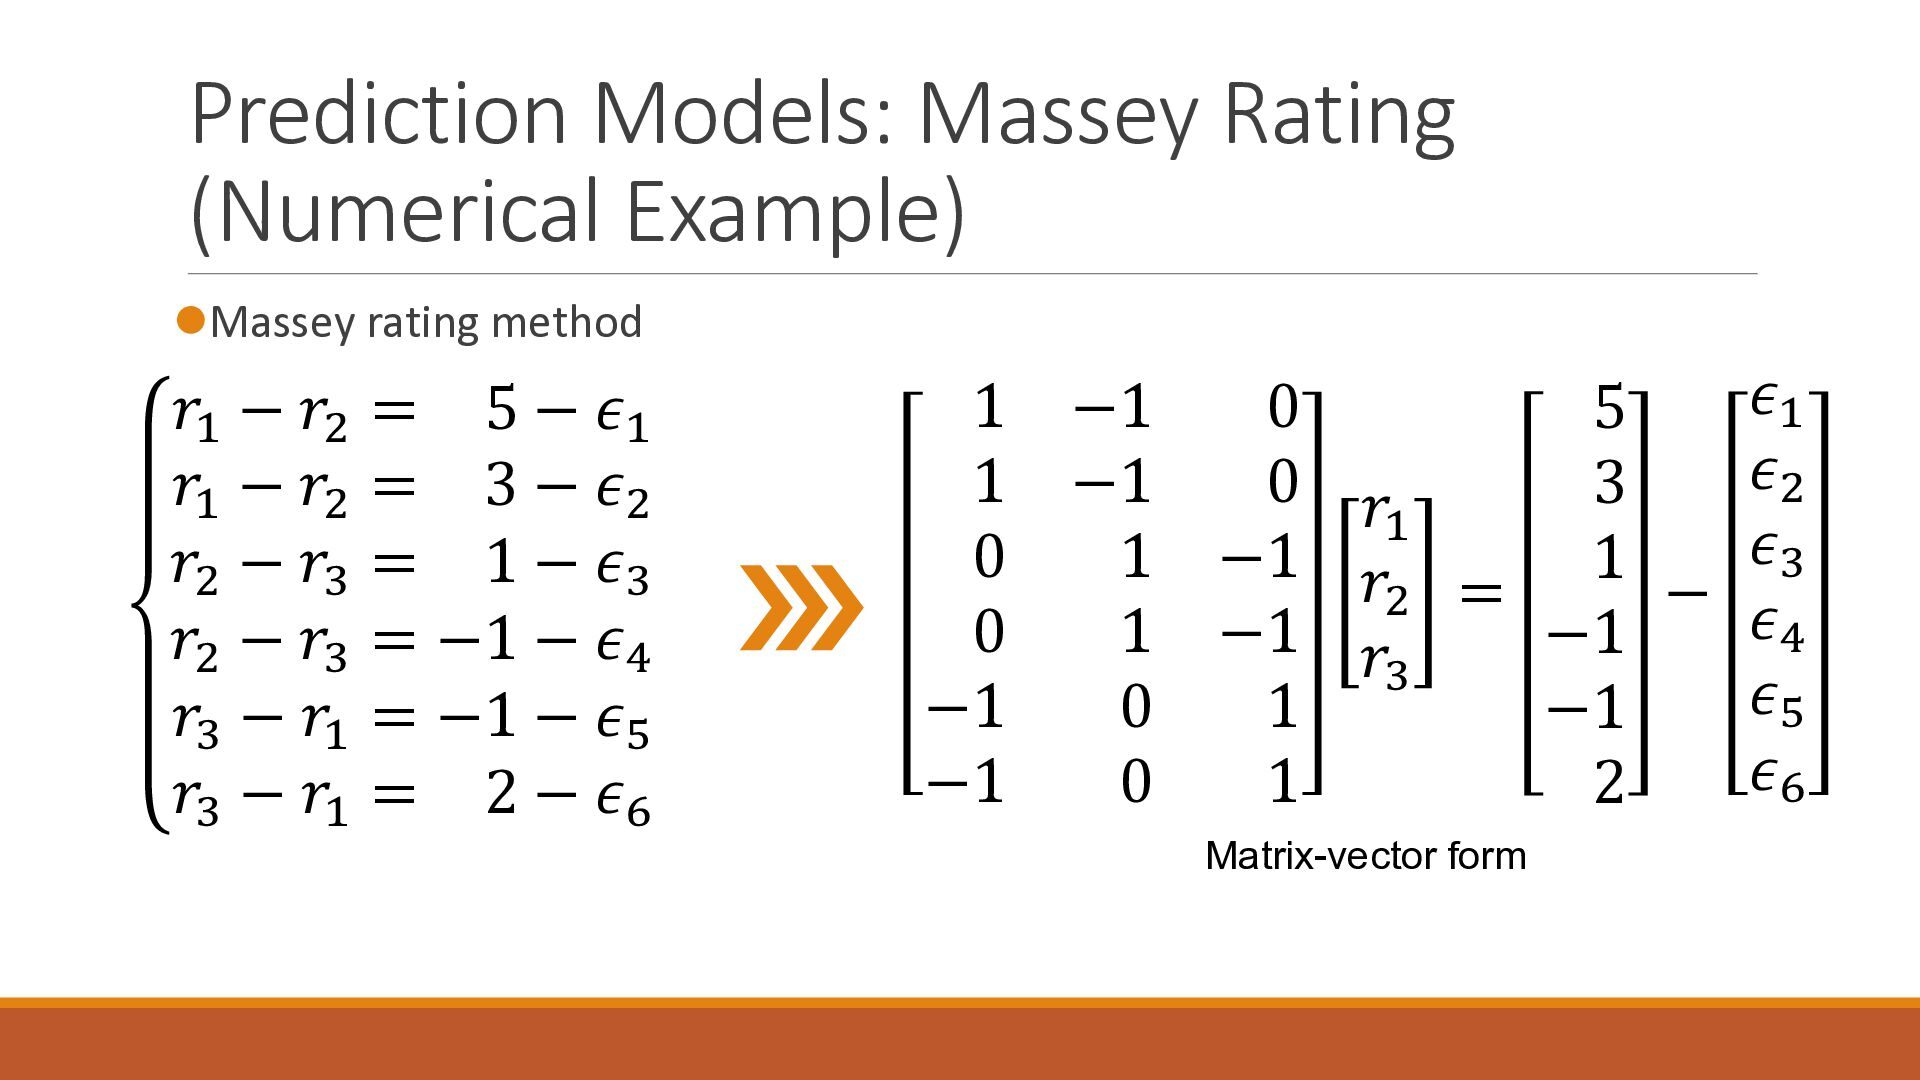
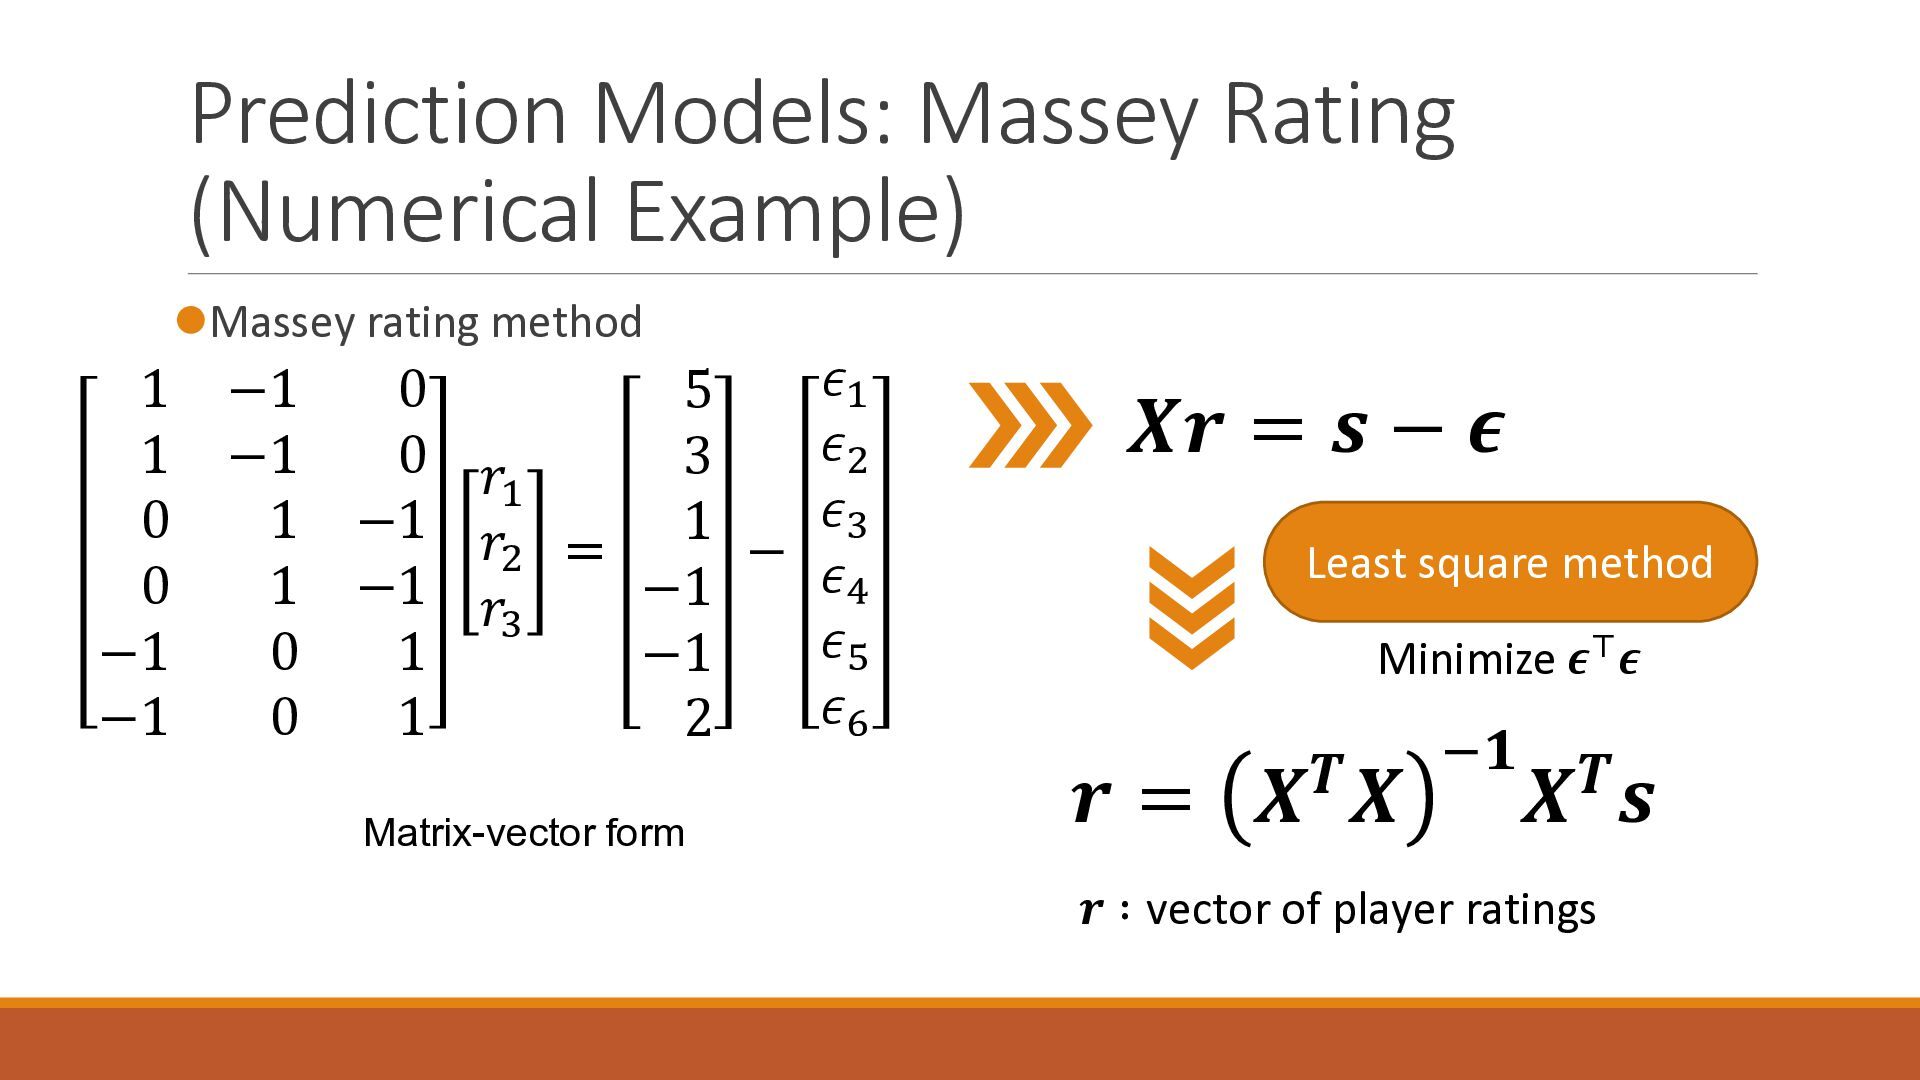
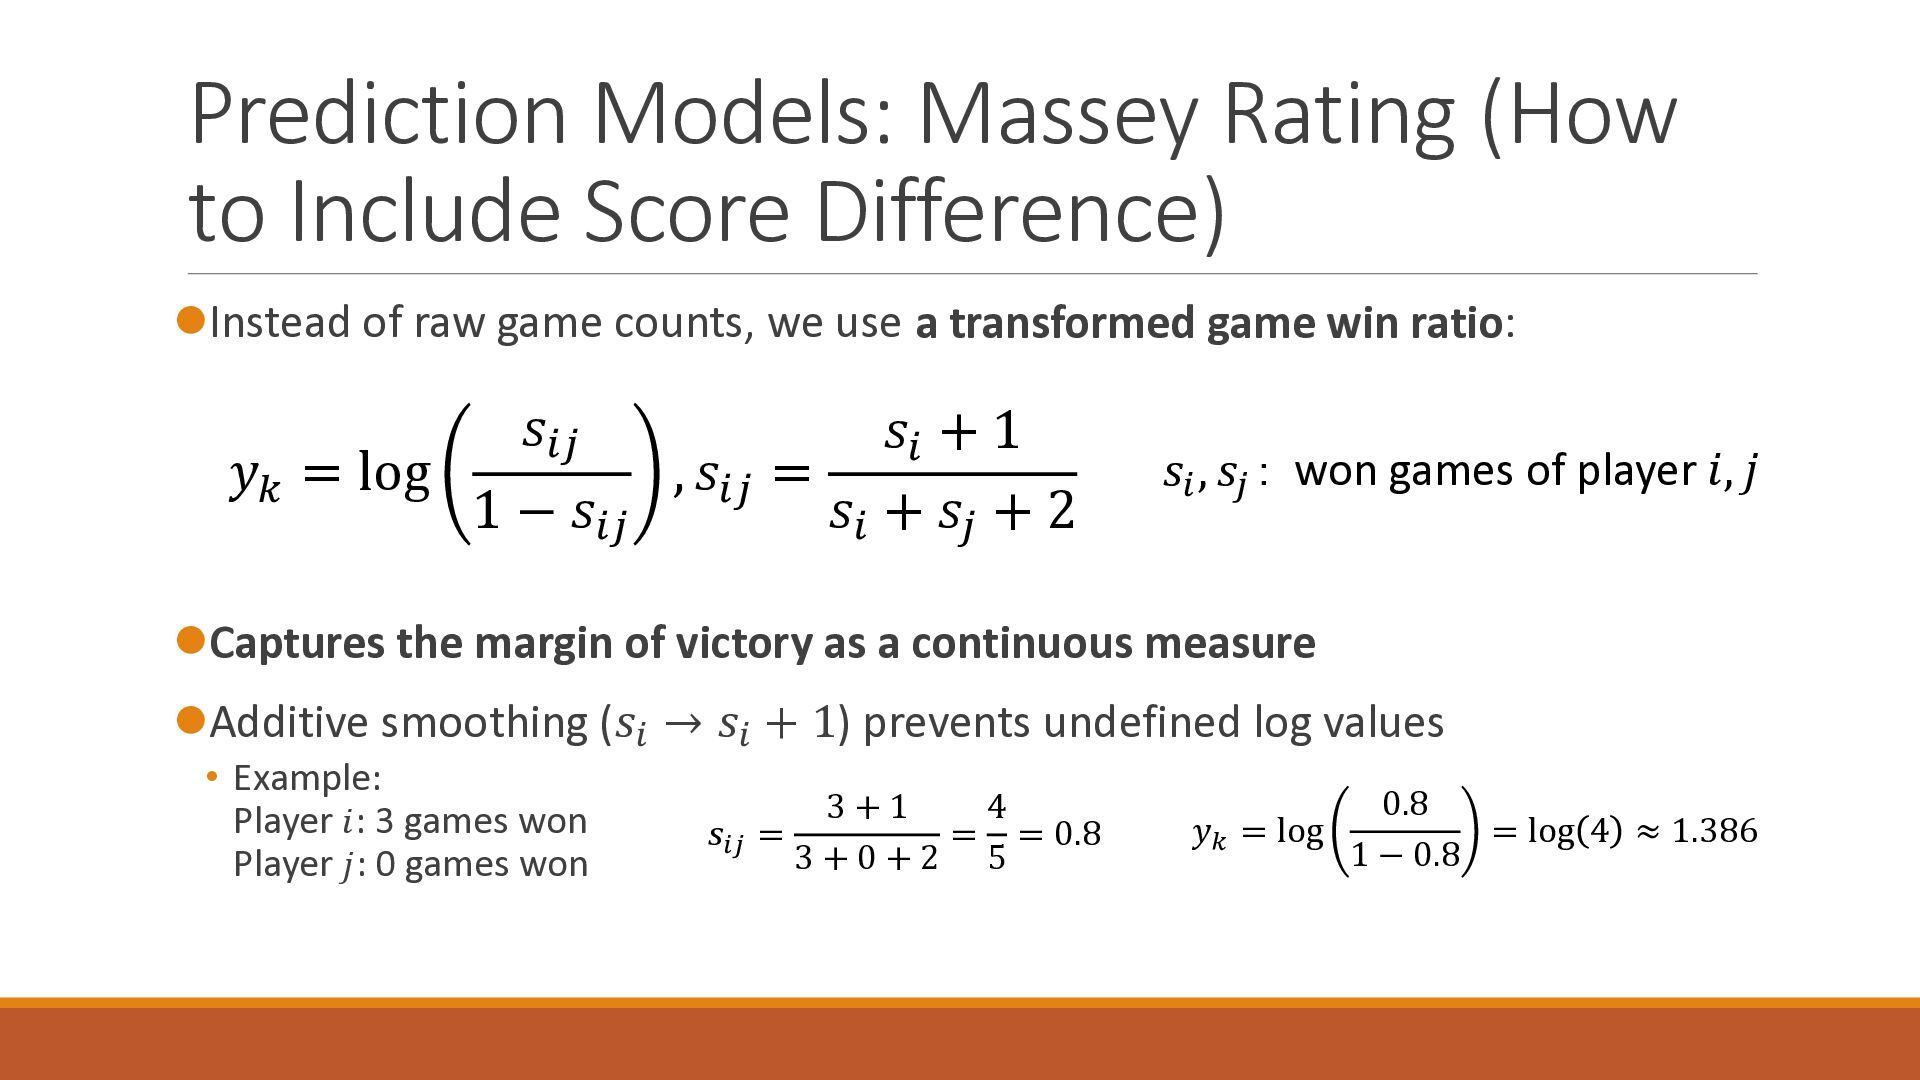
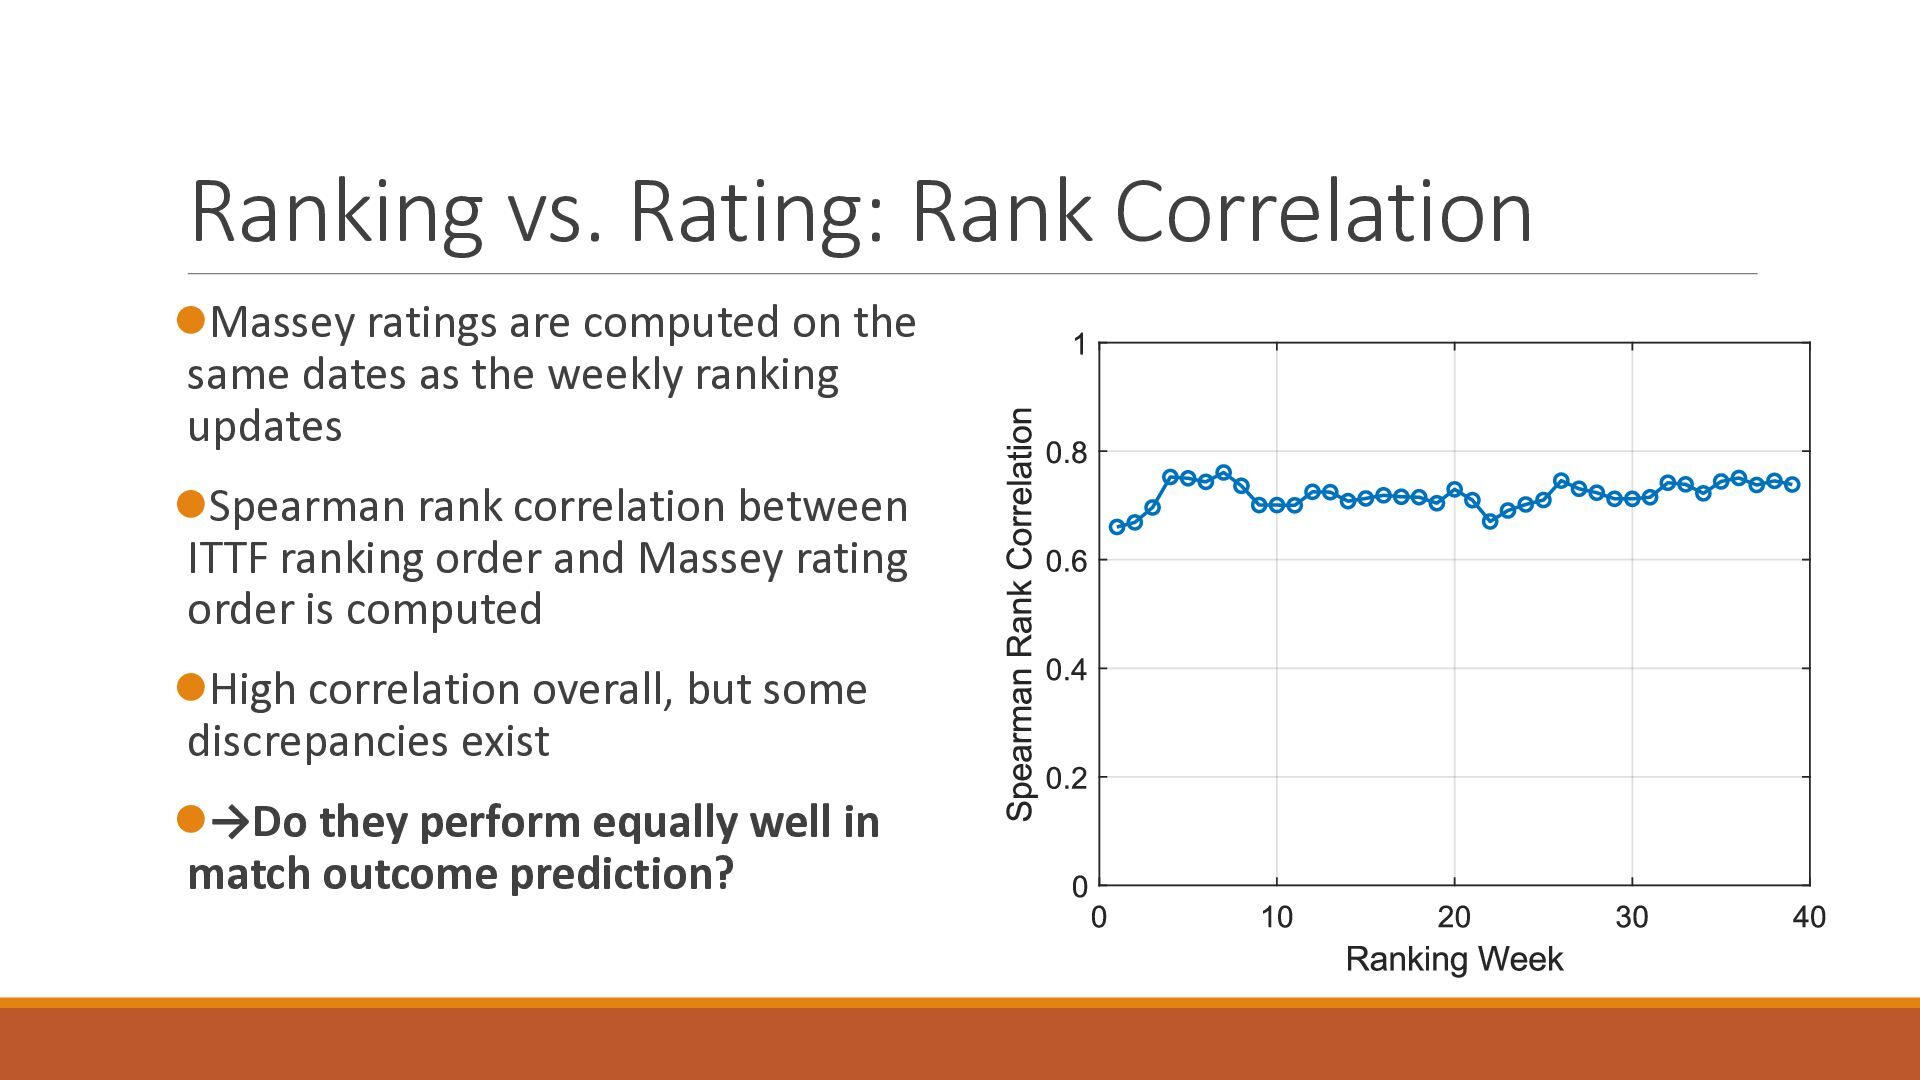
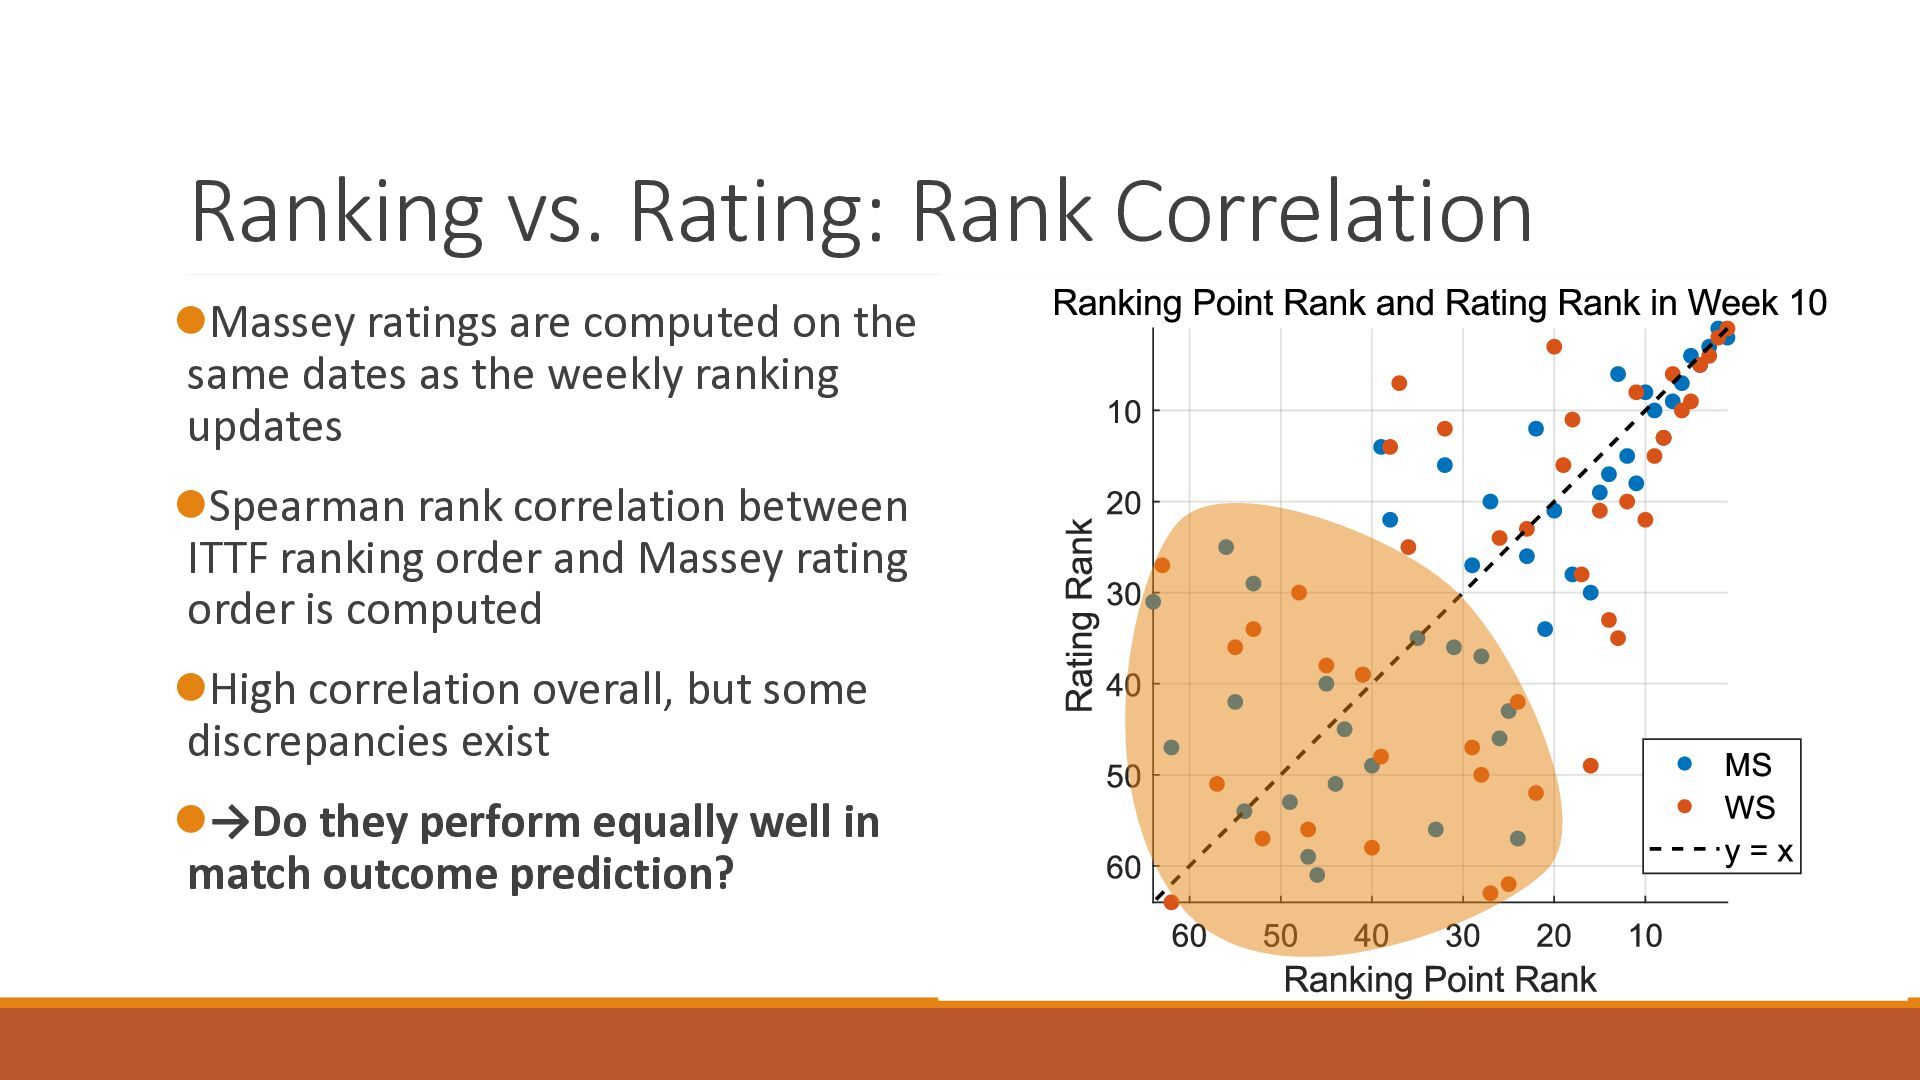
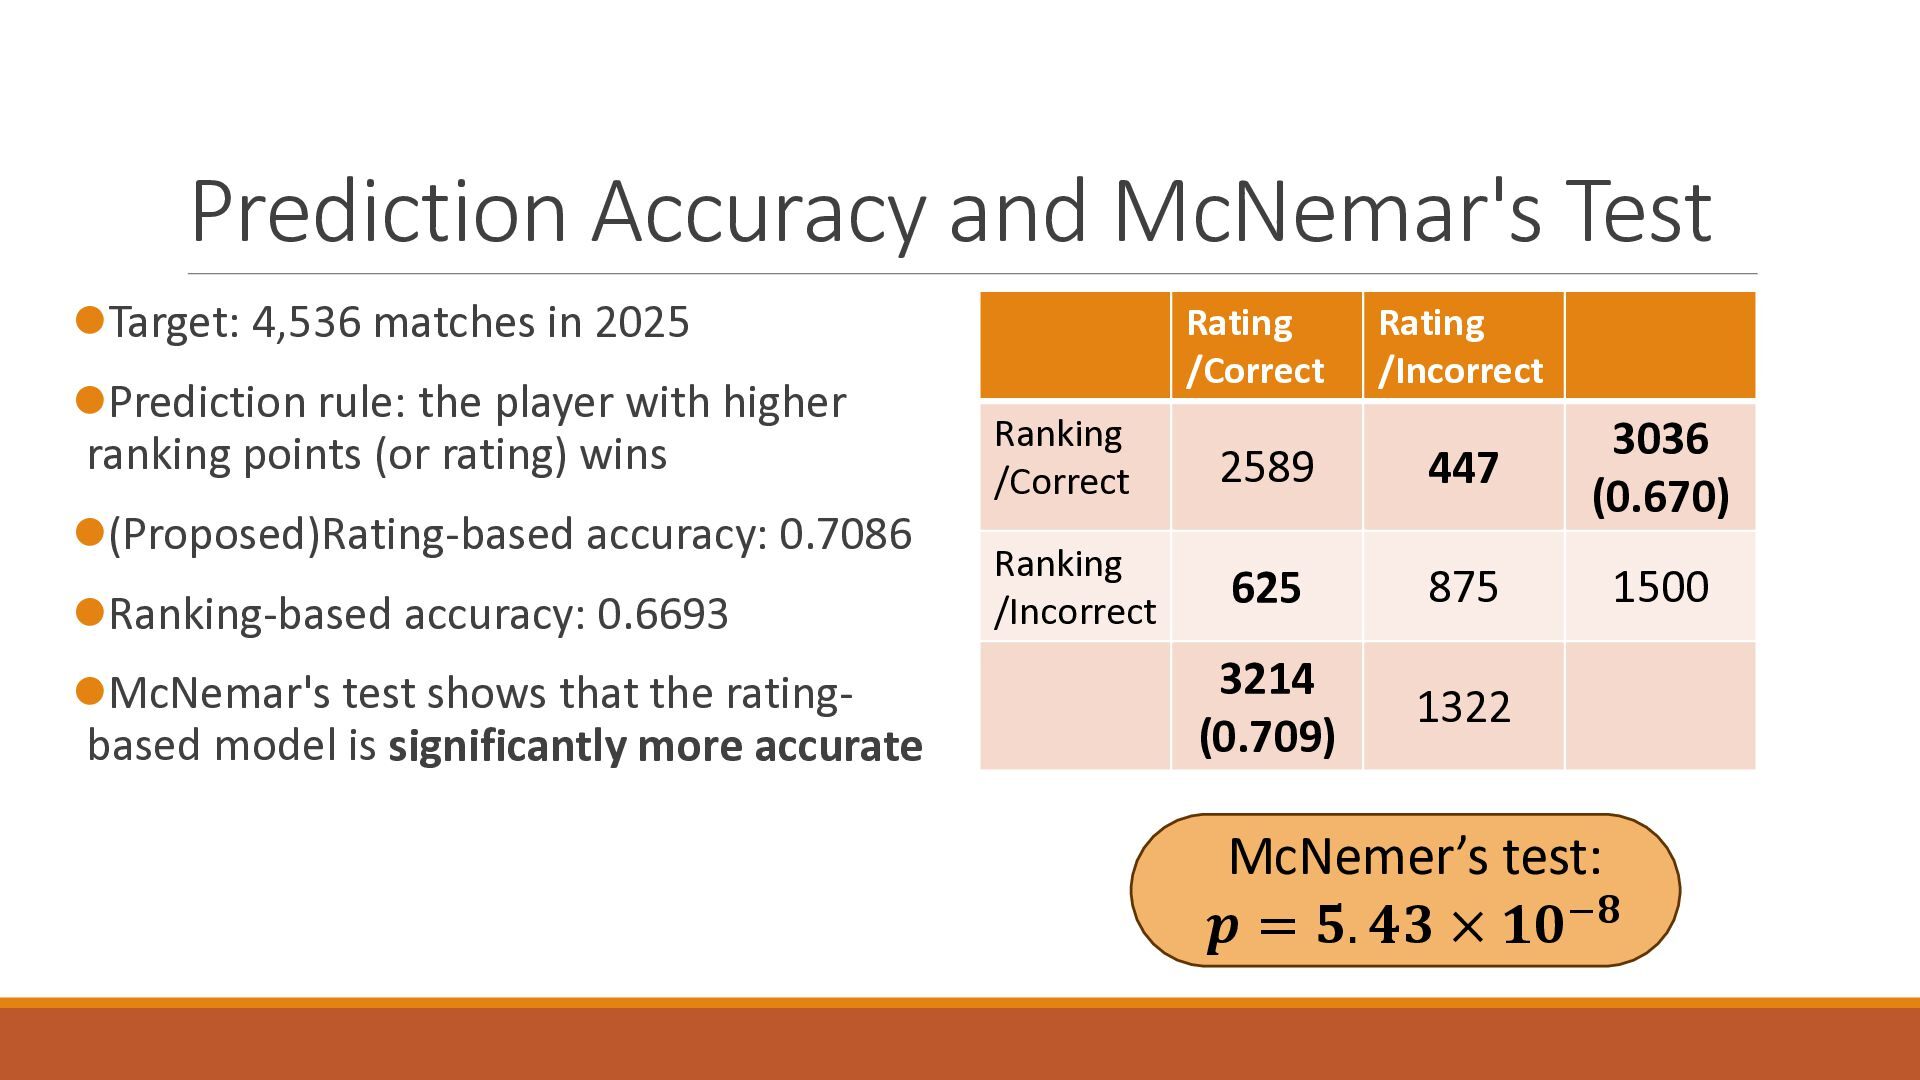
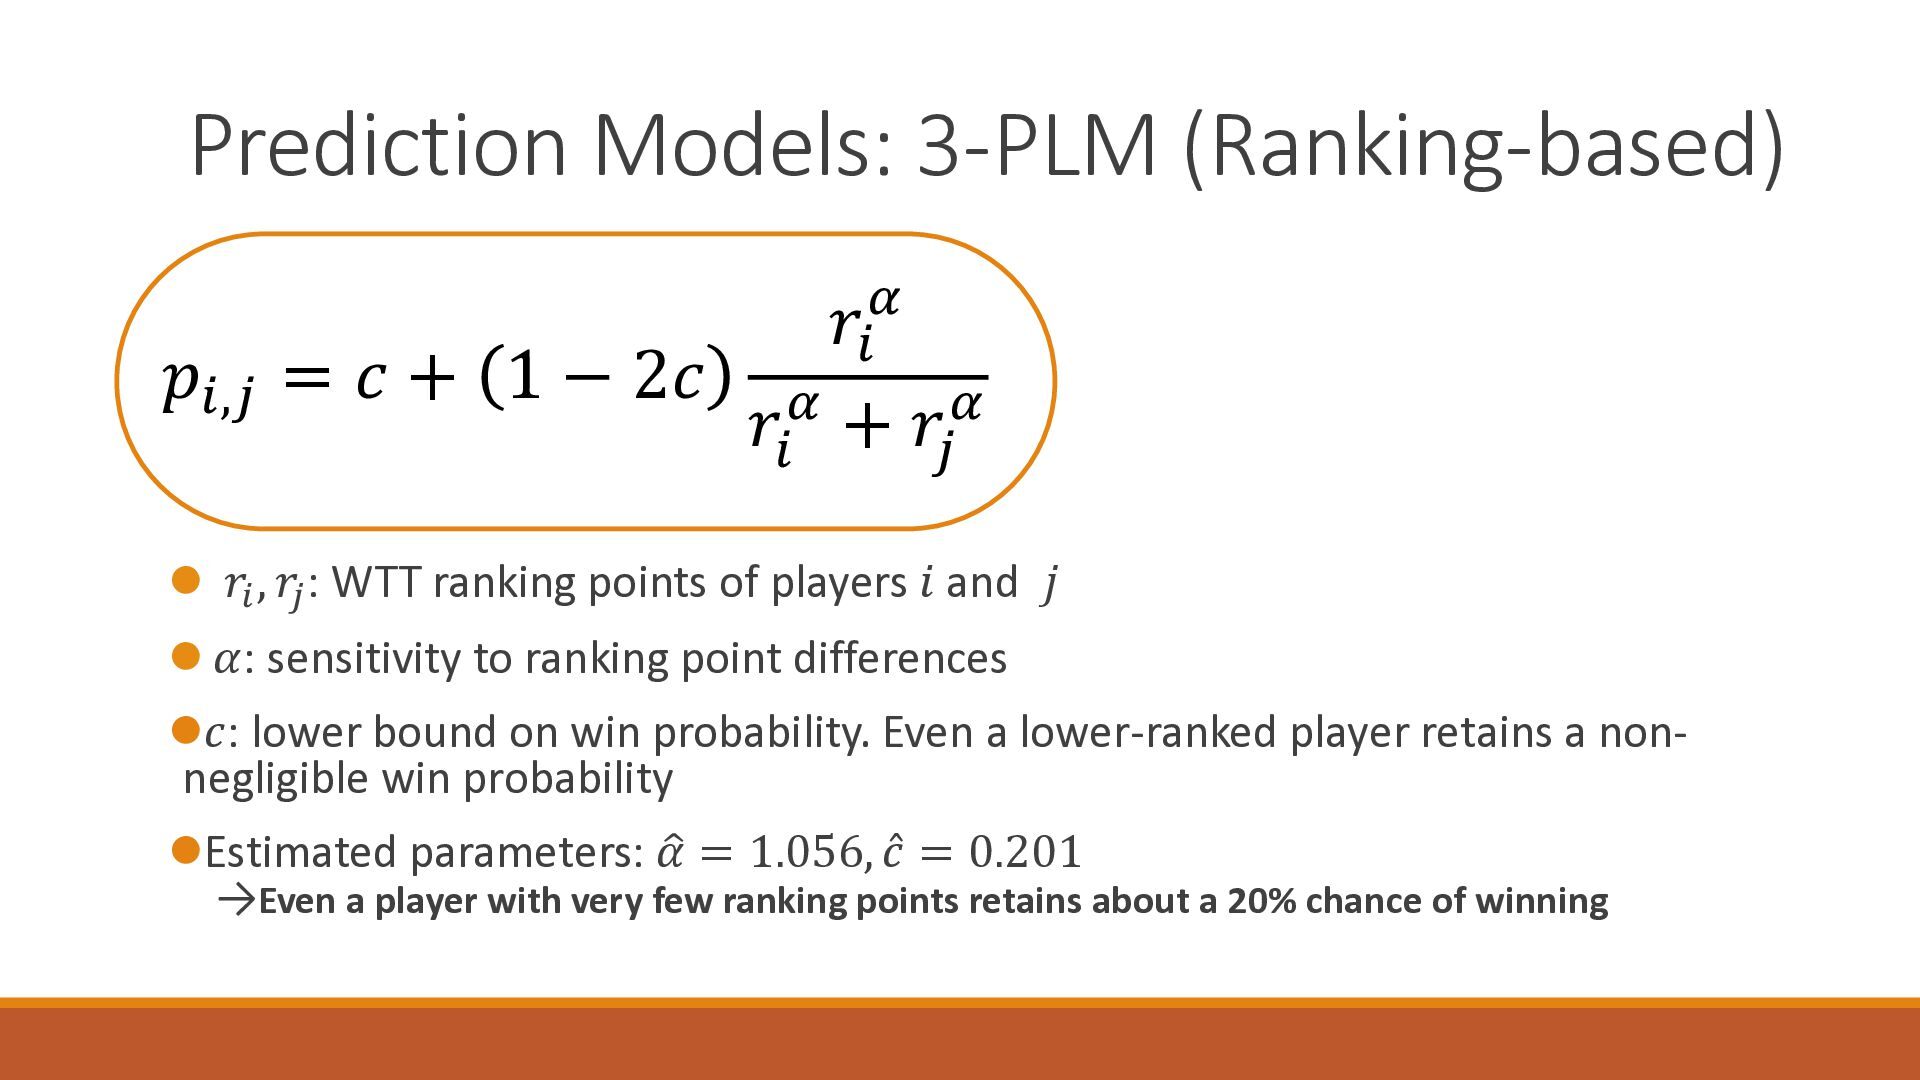
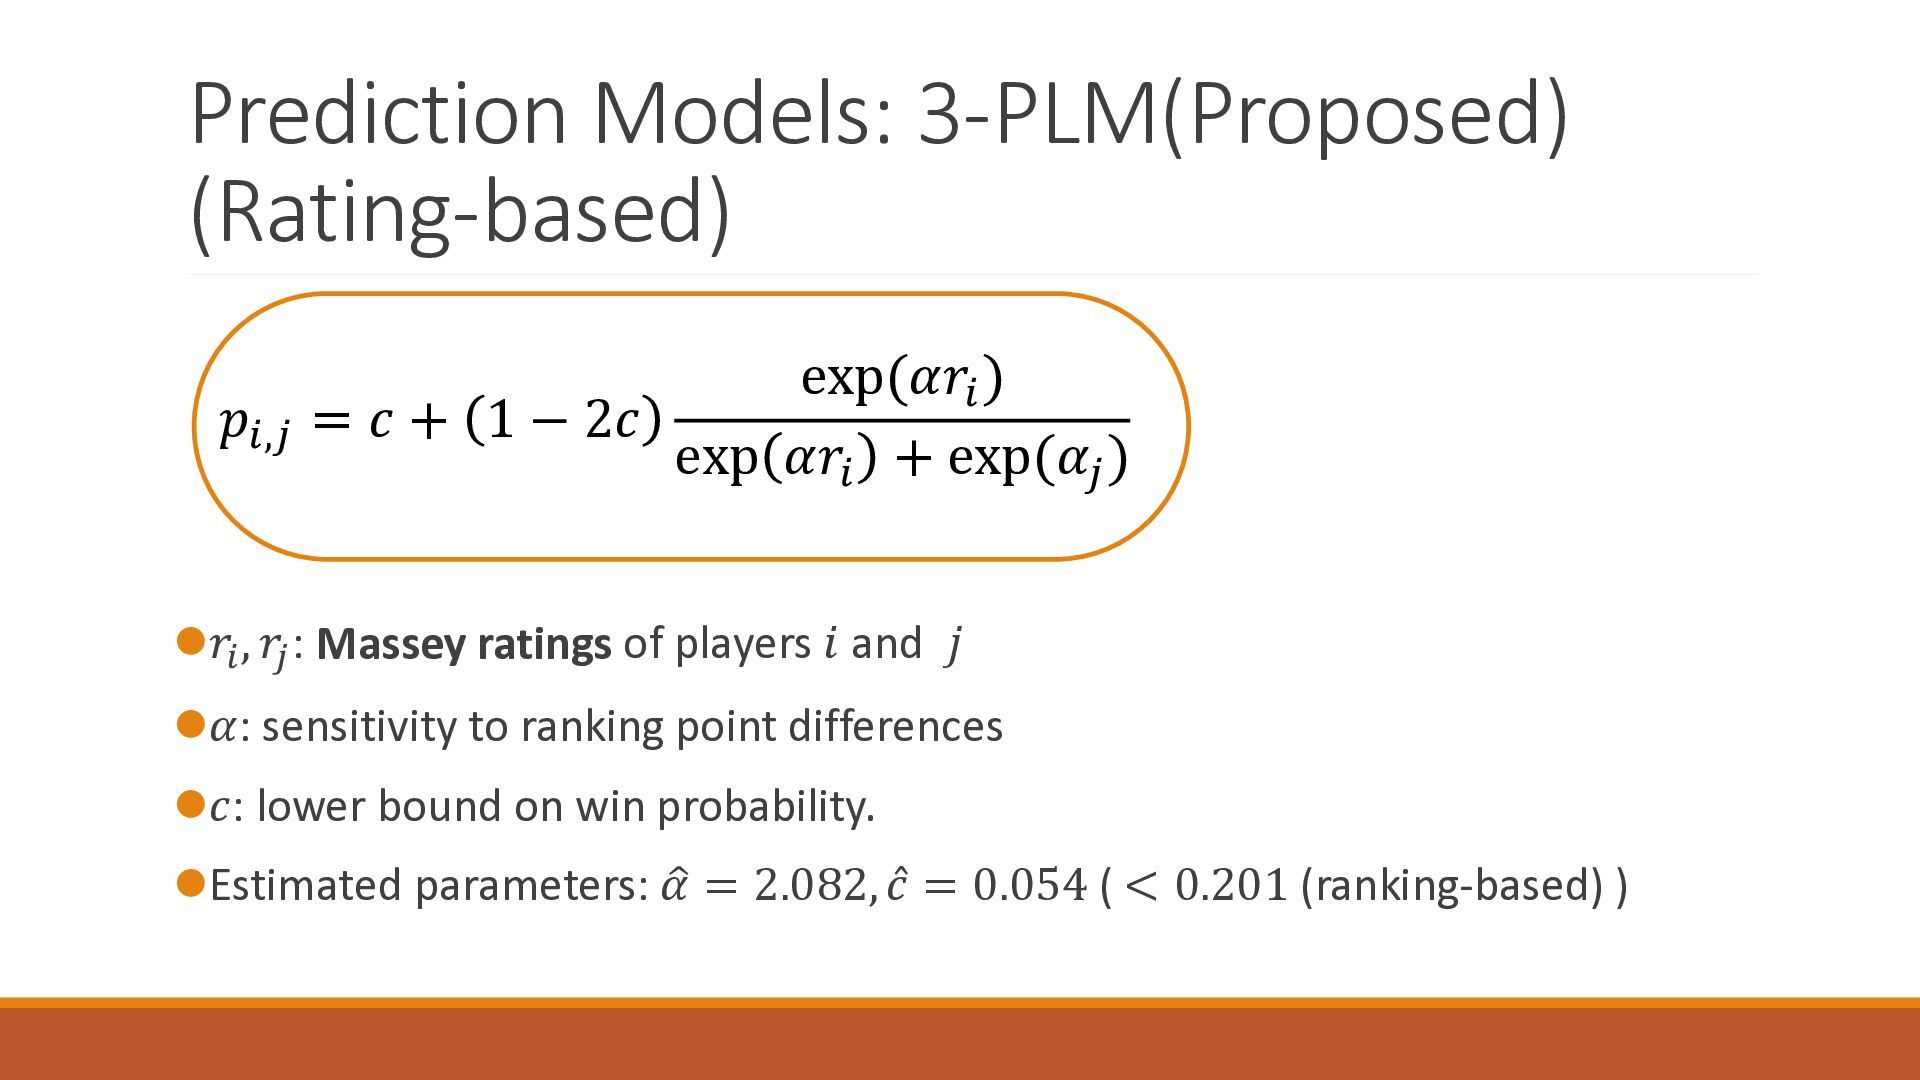
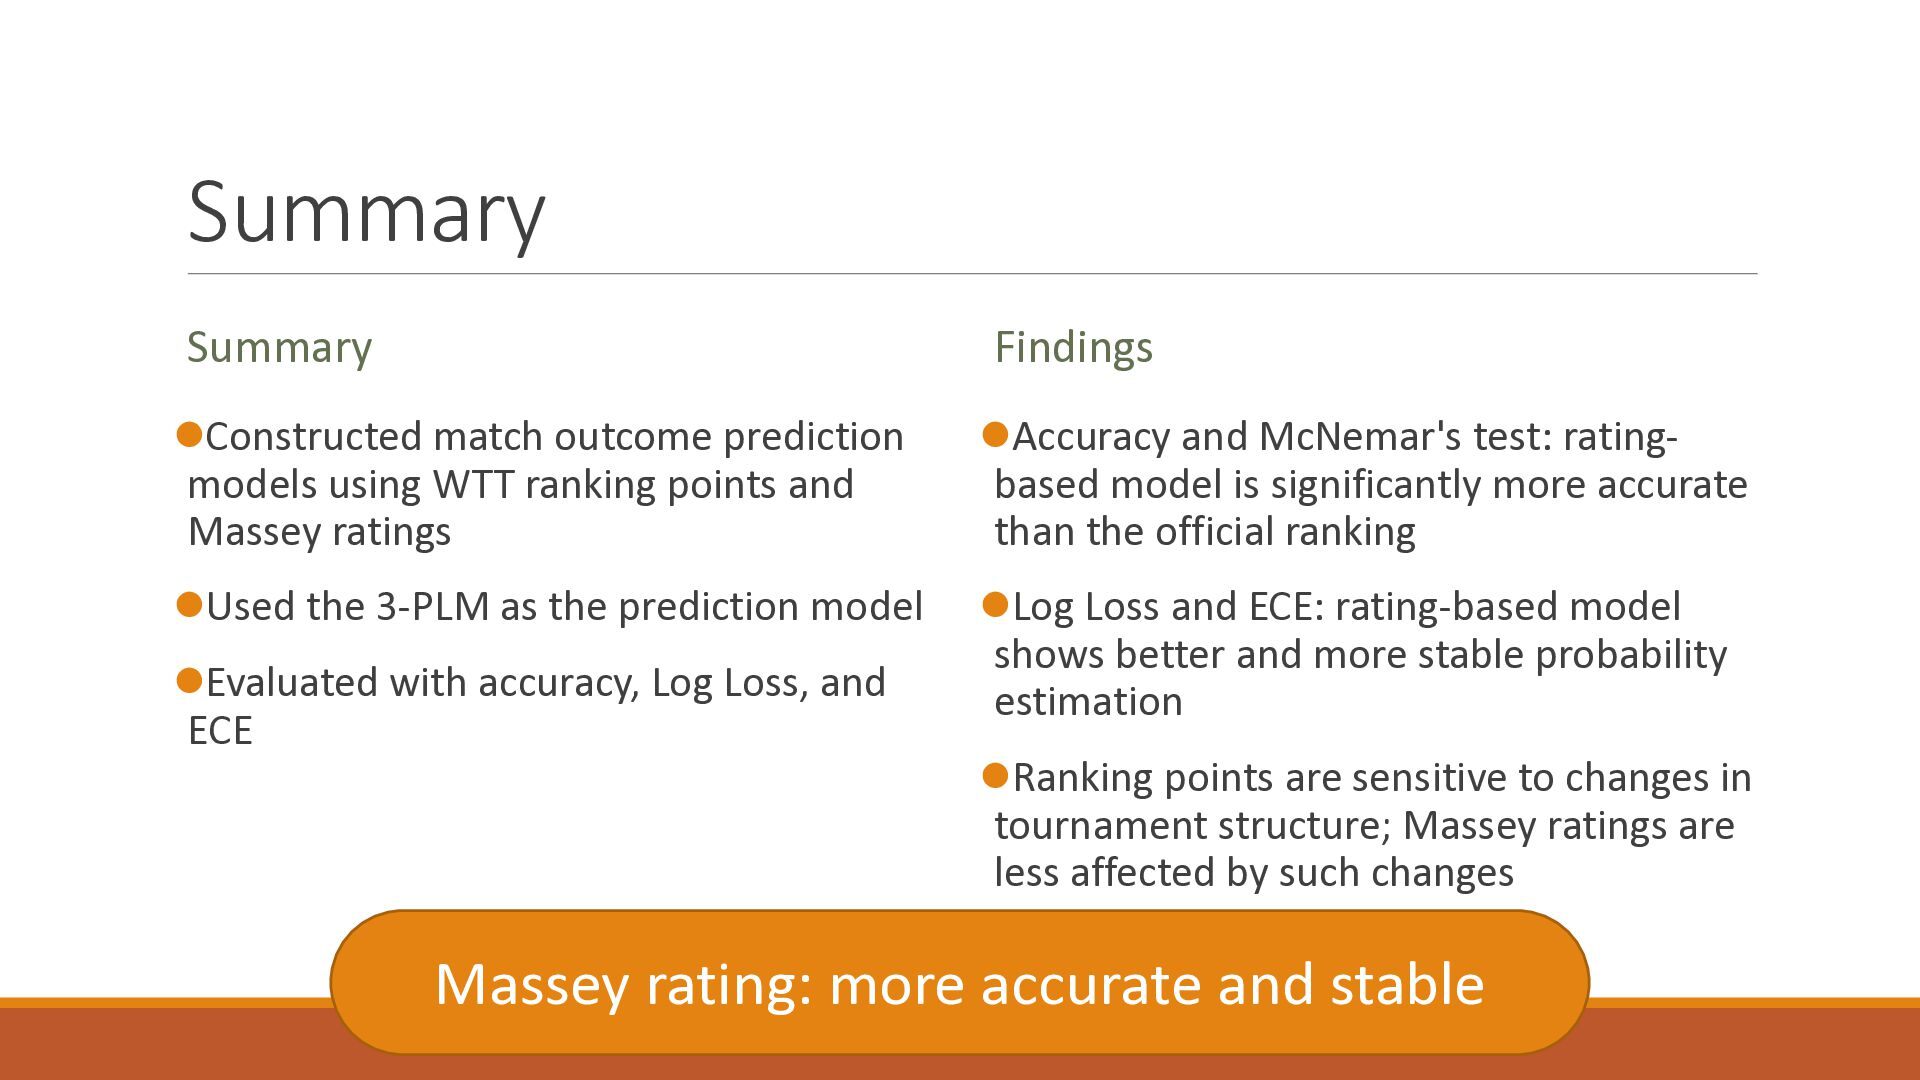
The 18th Australasian Conference on Mathematics and Computers in Sport (2026/7/1-3) で大学院生が発表したスライドです.卓球の世界ランキングの予測能力を定量的に分析したのち,ゲーム数を考慮したMassey法が予測能力を改善することを確認しました.

https://www.anziam.org.au/The+18th+Australasian+Conference+on+Mathematics+and+Computers+in+Sport

Avatar for konakalab

konakalab

July 01, 2026

More Decks by konakalab

Other Decks in Science

Transcript

  1. Massey Ratings for Match Outcome Prediction in Table Tennis: Evidence

    of Greater Stability than the ITTF World Ranking YUKI TAKASAKI , EIJI KONAKA (MEIJO UNIVERSITY, JAPAN)
  2. Outline 1. Background 2. Research Objective 3. Prediction Models 4.

    Evaluation Metrics 5. Results and Discussion 6. Summary
  3. Outline 1. Background 2. Research Objective 3. Prediction Models 4.

    Evaluation Metrics 5. Results and Discussion 6. Summary
  4. Background: Player Strength Estimation in Sports ⚫Numerical indicators of player

    strength (rankings) are essential in competitive sports ⚫Used for seeding, participation eligibility, and fan engagement ⚫Representative examples ⚫Tennis → ATP / WTA Rankings, Table Tennis → ITTF World Ranking Ref. B) Ref. A)
  5. Background: The ITTF World Ranking System ⚫Official world ranking established

    by the ITTF ⚫Ranking points earned across tournaments of varying tier and point allocation ⚫Rankings determined by points accumulated over the past 52 weeks ⚫Only the best 8 tournament results count toward the ranking ⚫Rankings shown: Week 44, 2025 ⚫Tomokazu Harimoto: 4th (5,500 pts) ⚫Sora Matsushima: 15th (↑1)
  6. Background: WTT Tournament Structure WHAT IS WTT? Tier Category I

    Grand Smash II WTT WTT Finals III WTT Champions IV WTT Star Contender V WTT Contenders WTT TOURNAMENT STRUCTURE ⚫The WTT tour, operated by the ITTF's commercial arm, WTT, was launched in 2021 ⚫Points are awarded based on the round reached in each event ⚫Grand Smash winner: 2,000 pts ⚫Champions winner: 1,000 pts
  7. Background: WTT Point Allocation •Points increase proportionally with each additional

    win •Higher-tier events award more points → Does this ranking system accurately reflect player strength? W F SF QF R16 R32 … Grand Smash 2000 1400 700 350 175 90 … Champions 1000 700 350 175 90 15 … Star Contender 600 420 210 105 55 25 … Contender 400 280 140 70 35 4 … ≃× 1.4 =× 2 =× 2 ≃× 2
  8. Outline 1. Background 2. Research Objective 3. Prediction Models 4.

    Evaluation Metrics 5. Results and Discussion 6. Summary
  9. Research Objective ⚫The ITTF ranking is widely used as a

    measure of player strength. ⚫However, its predictive validity has not been rigorously examined ⚫Ranking points reflect only the round reached, not the margin of victory ⚫Our approach: Ratings derived from match results can capture the margin of victory. Objective: Build prediction models based on both approaches and compare their predictive performance.
  10. Outline 1. Background 2. Research Objective 3. Prediction Models 4.

    Evaluation Metrics 5. Results and Discussion 6. Summary
  11. Prediction Models: Two Approaches Ranking-based (Proposed)Rating-based Input WTT ranking points

    Massey ratings Training data 2022-2024 (12494 matches) 2023-2024 (10488 matches) Test data 2025 (4536 matches) 2025 (5221 matches) Common to both approaches: • Models: 3-PLM • Evaluation: Accuracy, Log Loss, ECE • Source: 19,477 matches from WTT tournaments and the Olympics (2022–Sep 2025)
  12. Prediction Models: Massey Rating ⚫Massey rating method ⚫Simple algorithm. No

    prior ranking required ⚫Finds the rating (strength estimate) for each player ⚫Rating differences correspond to expected score differences 𝑟𝑖 − 𝑟𝑗 + 𝜀𝑘 = 𝑠𝑘 • 𝑟𝑖 , 𝑟 𝑗 : ratings of players 𝑖 and 𝑗 • 𝑠𝑘 : score difference in match 𝑘 • 𝜖𝑘 : error term
  13. Prediction Models: Massey Rating (Numerical Example) ⚫Massey rating method 𝑟𝑖

    − 𝑟𝑗 + 𝜀𝑘 = 𝑠𝑘 • 𝑟𝑖 , 𝑟 𝑗 : ratings of players 𝑖 and 𝑗 • 𝑠𝑘 : score difference in match 𝑘 • 𝜖𝑘 : error term 𝒊 𝒋 𝒔𝒊 𝒔𝒋 𝒔𝒌 1 2 5 0 5 1 2 4 1 3 2 3 3 2 1 2 3 1 2 -1 3 1 0 1 -1 3 1 4 2 2 𝑟𝑖 − 𝑟 𝑗 = 𝑠𝑘 − 𝜀𝑘 Example: 𝑟1 − 𝑟2 = 5 − 𝜖1 𝑟1 − 𝑟2 = 3 − 𝜖2 𝑟2 − 𝑟3 = 1 − 𝜖3 𝑟2 − 𝑟3 = −1 − 𝜖4 𝑟3 − 𝑟1 = −1 − 𝜖5 𝑟3 − 𝑟1 = 2 − 𝜖6
  14. Prediction Models: Massey Rating (Numerical Example) ⚫Massey rating method Matrix-vector

    form 1 −1 0 1 −1 0 0 1 −1 0 1 −1 −1 0 1 −1 0 1 𝑟1 𝑟2 𝑟3 = 5 3 1 −1 −1 2 − 𝜖1 𝜖2 𝜖3 𝜖4 𝜖5 𝜖6 𝑟1 − 𝑟2 = 5 − 𝜖1 𝑟1 − 𝑟2 = 3 − 𝜖2 𝑟2 − 𝑟3 = 1 − 𝜖3 𝑟2 − 𝑟3 = −1 − 𝜖4 𝑟3 − 𝑟1 = −1 − 𝜖5 𝑟3 − 𝑟1 = 2 − 𝜖6
  15. Prediction Models: Massey Rating (Numerical Example) ⚫Massey rating method 𝑿𝒓

    = 𝒔 − 𝝐 𝒓 = 𝑿𝑻𝑿 −𝟏 𝑿𝑻𝒔 Matrix-vector form Minimize 𝝐⊤𝝐 𝒓 ∶ vector of player ratings Least square method 1 −1 0 1 −1 0 0 1 −1 0 1 −1 −1 0 1 −1 0 1 𝑟1 𝑟2 𝑟3 = 5 3 1 −1 −1 2 − 𝜖1 𝜖2 𝜖3 𝜖4 𝜖5 𝜖6
  16. Prediction Models: Massey Rating (How to Include Score Difference) ⚫Instead

    of raw game counts, we use a transformed game win ratio: ⚫Captures the margin of victory as a continuous measure ⚫Additive smoothing (𝑠𝑖 → 𝑠𝑖 + 1) prevents undefined log values • Example: Player 𝑖: 3 games won Player 𝑗: 0 games won 𝑦𝑘 = log 𝑠𝑖𝑗 1 − 𝑠𝑖𝑗 , 𝑠𝑖𝑗 = 𝑠𝑖 + 1 𝑠𝑖 + 𝑠𝑗 + 2 𝑠𝑖 , 𝑠𝑗 : won games of player 𝑖, 𝑗 𝑠𝑖𝑗 = 3 + 1 3 + 0 + 2 = 4 5 = 0.8 𝑦𝑘 = log 0.8 1 − 0.8 = log 4 ≈ 1.386
  17. Ranking vs. Rating: Rank Correlation ⚫Massey ratings are computed on

    the same dates as the weekly ranking updates ⚫Spearman rank correlation between ITTF ranking order and Massey rating order is computed ⚫High correlation overall, but some discrepancies exist ⚫→Do they perform equally well in match outcome prediction?
  18. Ranking vs. Rating: Rank Correlation ⚫Massey ratings are computed on

    the same dates as the weekly ranking updates ⚫Spearman rank correlation between ITTF ranking order and Massey rating order is computed ⚫High correlation overall, but some discrepancies exist ⚫→Do they perform equally well in match outcome prediction?
  19. Prediction Accuracy and McNemar's Test ⚫Target: 4,536 matches in 2025

    ⚫Prediction rule: the player with higher ranking points (or rating) wins ⚫(Proposed)Rating-based accuracy: 0.7086 ⚫Ranking-based accuracy: 0.6693 ⚫McNemar's test shows that the rating- based model is significantly more accurate Rating /Correct Rating /Incorrect Ranking /Correct 2589 447 3036 (0.670) Ranking /Incorrect 625 875 1500 3214 (0.709) 1322 McNemer’s test: 𝒑 = 𝟓. 𝟒𝟑 × 𝟏𝟎−𝟖
  20. Limitations of Prediction Accuracy ⚫Accuracy and McNemar's test confirm the

    rating-based model is significantly more accurate than the official ranking ⚫However, accuracy only evaluates whether the winner was correctly predicted ⚫It does not assess the quality of the predicted probabilities → Construct probabilistic prediction models for both approaches and compare predicted probabilities using Log Loss and ECE
  21. ⚫ 𝑟𝑖 , 𝑟 𝑗 : WTT ranking points of

    players 𝑖 and 𝑗 ⚫ 𝛼: sensitivity to ranking point differences ⚫𝑐: lower bound on win probability. Even a lower-ranked player retains a non- negligible win probability ⚫Estimated parameters: ො 𝛼 = 1.056, Ƹ 𝑐 = 0.201 →Even a player with very few ranking points retains about a 20% chance of winning Prediction Models: 3-PLM (Ranking-based) 𝑝𝑖,𝑗 = 𝑐 + 1 − 2𝑐 𝑟𝑖 𝛼 𝑟𝑖 𝛼 + 𝑟𝑗 𝛼
  22. Prediction Models: 3-PLM(Proposed) (Rating-based) ⚫𝑟𝑖 , 𝑟 𝑗 : Massey

    ratings of players 𝑖 and 𝑗 ⚫𝛼: sensitivity to ranking point differences ⚫𝑐: lower bound on win probability. ⚫Estimated parameters: ො 𝛼 = 2.082, Ƹ 𝑐 = 0.054 ( < 0.201 (ranking-based) ) 𝑝𝑖,𝑗 = 𝑐 + 1 − 2𝑐 exp(𝛼𝑟𝑖 ) exp 𝛼𝑟𝑖 + exp(𝛼𝑗 )
  23. Outline 1. Background 2. Research Objective 3. Prediction Models 4.

    Evaluation Metrics 5. Results and Discussion 6. Summary
  24. Evaluation Metrics LogLoss ⚫Quality of predicted probabilities ⚫Smaller → predicted

    probabilities closer to true outcomes ⚫Penalizes overconfident wrong predictions ECE (Expected Calibration Error) ⚫Reliability of predicted probabilities ⚫Smaller → predicted probability matches empirical win rate ⚫Example: predicted 0.8, actual win rate 80% → good calibration Both metrics: smaller is better
  25. Outline 1. Background 2. Research Objective 3. Prediction Models 4.

    Evaluation Metrics 5. Results and Discussion 6. Summary
  26. Results: Training (Ranking-point-based) ⚫Trained on 2022–2024 data ⚫Horizontal and vertical

    axes: log ranking point ratio and win rate, respectively ⚫Lower histogram: number of matches per bin ⚫Empirical win rate is unstable at extreme ranking point ratios due to small sample sizes
  27. Results: Training (Ranking-point-based) ⚫The 3-PLM captures the empirical win rate

    closely ⚫→ Apply the trained model to 2025 test data
  28. Results: Training (Proposed-Rating-based) ⚫Trained on 2023–2024 data ⚫Horizontal and vertical

    axes: rating difference and win rate, respectively ⚫Lower histogram: number of matches per bin ⚫The 3-PLM captures the empirical win rate closely ⚫Compared to the ranking-based model, the empirical win rate is more stable ⚫→ Apply the trained model to 2025 test data
  29. Results: Evaluation Summary ⚫ (Proposed)Rating-based model achieves lower Log Loss

    on test data → more accurate probability predictions ⚫Rating-based model achieves lower ECE on test data → better calibration Train Test (2025) Methods LogLoss ECE LogLoss ECE Ranking 0.9165 0.0026 0.8871 0.0192 Rating 0.8201 0.0026 0.8341 0.0155 The proposed rating-based model outperformed the ranking-based model
  30. Results: Discussion ⚫ Rating-based model achieved higher accuracy and smaller

    ECE → more stable win rate estimation ⚫Ranking points are affected by year- to-year changes in tournament composition (right Table) ⚫Massey ratings are updated from match results only → less affected by tournament structure changes ‘21 ‘22 ‘23 ‘24 ‘25 (9/25) Grand Smash 0 1 1 3 4 Champions 0 2 3 5 4 Star Contender 2 2 4 4 4 Contender 5 8 11 10 7 Feeder 1 11 15 19 15
  31. Outline 1. Background 2. Research Objective 3. Prediction Models 4.

    Evaluation Metrics 5. Results and Discussion 6. Summary
  32. Summary Summary ⚫Constructed match outcome prediction models using WTT ranking

    points and Massey ratings ⚫Used the 3-PLM as the prediction model ⚫Evaluated with accuracy, Log Loss, and ECE Findings ⚫Accuracy and McNemar's test: rating- based model is significantly more accurate than the official ranking ⚫Log Loss and ECE: rating-based model shows better and more stable probability estimation ⚫Ranking points are sensitive to changes in tournament structure; Massey ratings are less affected by such changes Massey rating: more accurate and stable
  33. Evaluation Metric: Log Loss • A smaller Log Loss indicates

    that the predicted probabilities are closer to the actual outcomes • It imposes a large penalty on predictions that assign a low probability to the true outcome • Lower values indicate better probabilistic predictions • We use Log Loss to evaluate the performance of probabilistic predictions • Let 𝑦𝑖 ∈ 0 1 be the true outcome of match 𝑖(win = 1, loss = 0), and let 𝑝𝑖 ∈ 0 1 be the predicted probability of winning Log Loss evaluates not only whether the predicted winner is correct, but also how well the predicted probability reflects the actual outcome LogLoss = − 1 𝑁 ෍ 𝑖=1 𝑁 𝑦𝑖 log2 𝑝𝑖 + 1 − 𝑦𝑖 log2 1 − 𝑝𝑖
  34. Evaluation Metric: Expected Calibration Error (ECE) • Lower ECE indicates

    better calibration • A well-calibrated model satisfies: Predicted probability = 0.8 → Observed win rate ≈ 80% Predicted probability = 0.8 → Observed win rate = 60% → Overconfident prediction • Expected Calibration Error (ECE) evaluates how well the predicted probabilities match the observed win rates (calibration) conf 𝑚 = 1 𝑛𝑚 ෍ 𝑖∈𝐵𝑚 𝑝𝑖 acc 𝑚 = 1 𝑛𝑚 ෍ 𝑖∈𝐵𝑚 𝑦𝑖 ECE = ෍ 𝑚=1 𝑀 𝑛𝑚 𝑁 acc 𝑚 − conf 𝑚 • Divide the prediction probability range [0 , 1] into M bins • Let 𝐵𝑚 denote the set of matches in bin 𝑚, and let 𝑛𝑚 be the number of matches in that bin • conf 𝒎 :Average predicted win probability in bin 𝑚 • acc 𝒎 : Observed win rate in bin 𝑚 In this study, the prediction probabilities were divided into 10 bins to calculate ECE