Upgrade to Pro — share decks privately, control downloads, hide ads and more …

Data-driven Identification of Total RNA Expression Genes (TREGs) for Estimation of RNA Abundance in Heterogeneous Cell Types

Data-driven Identification of Total RNA Expression Genes (TREGs) for Estimation of RNA Abundance in Heterogeneous Cell Types

Short talk at BioC22 Conference, July 2022

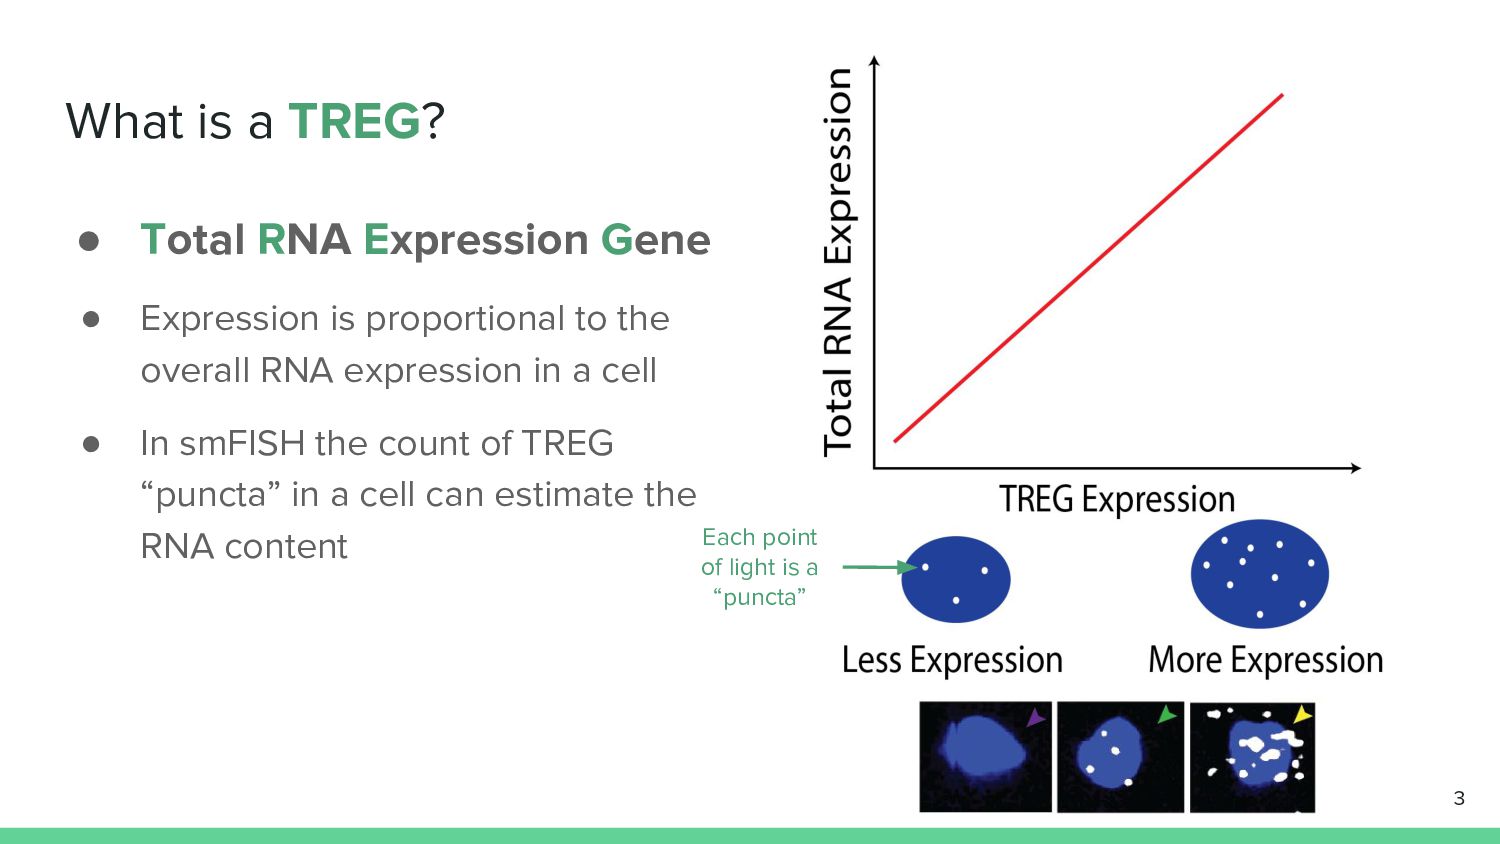
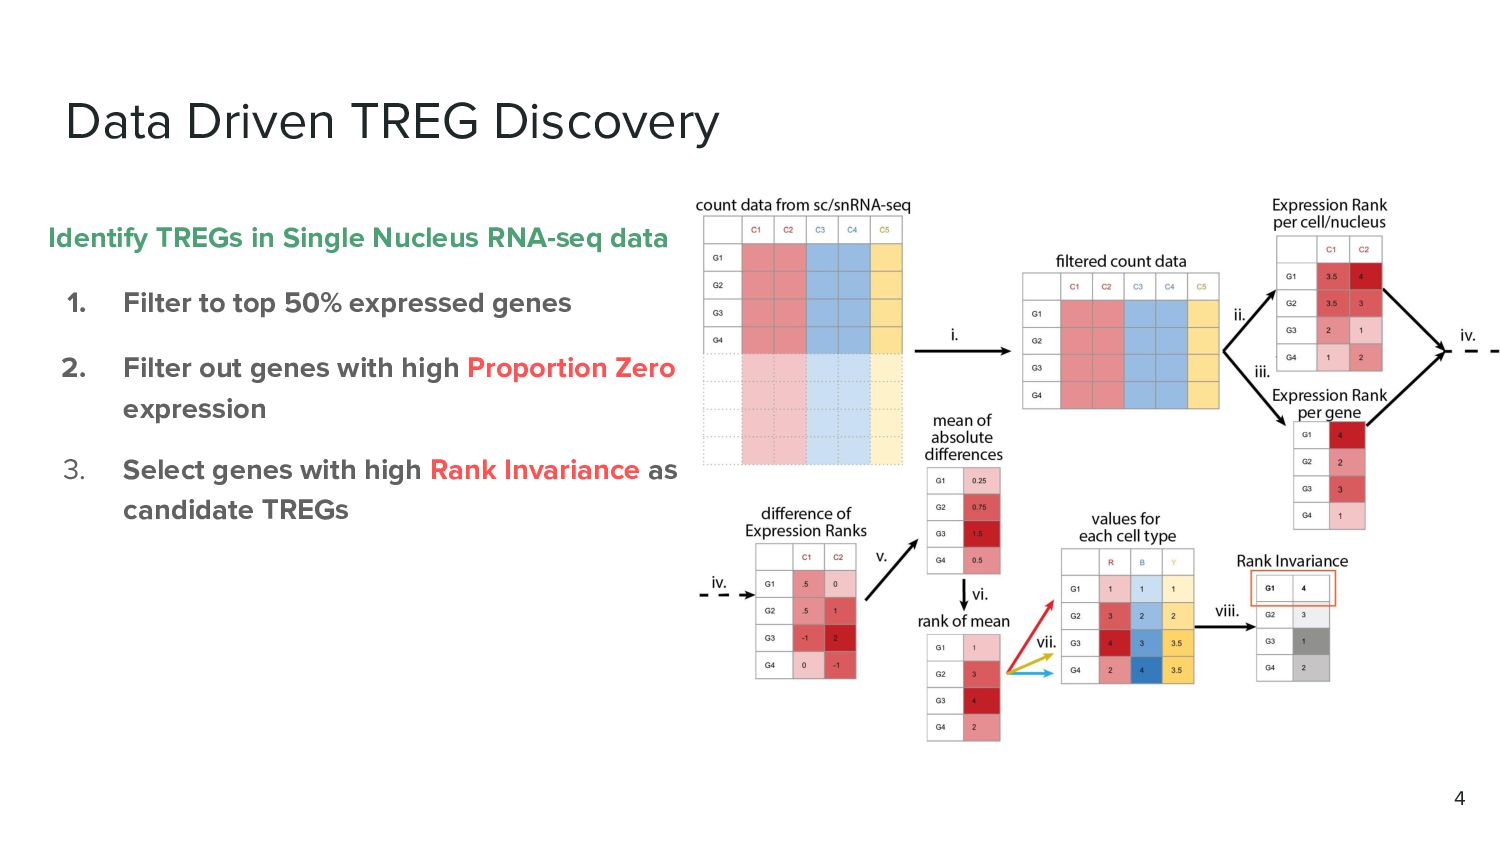
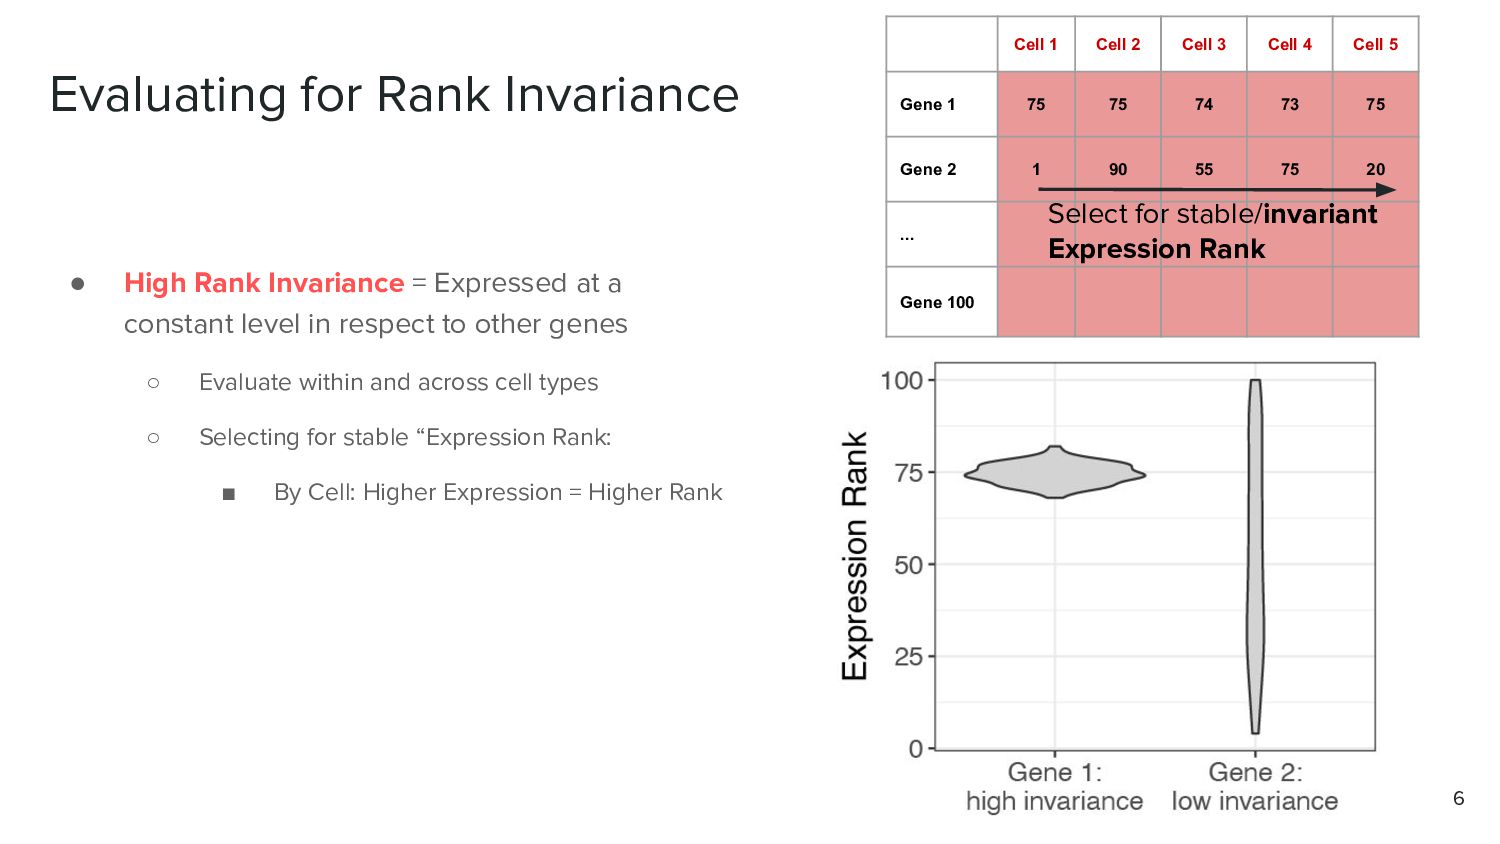
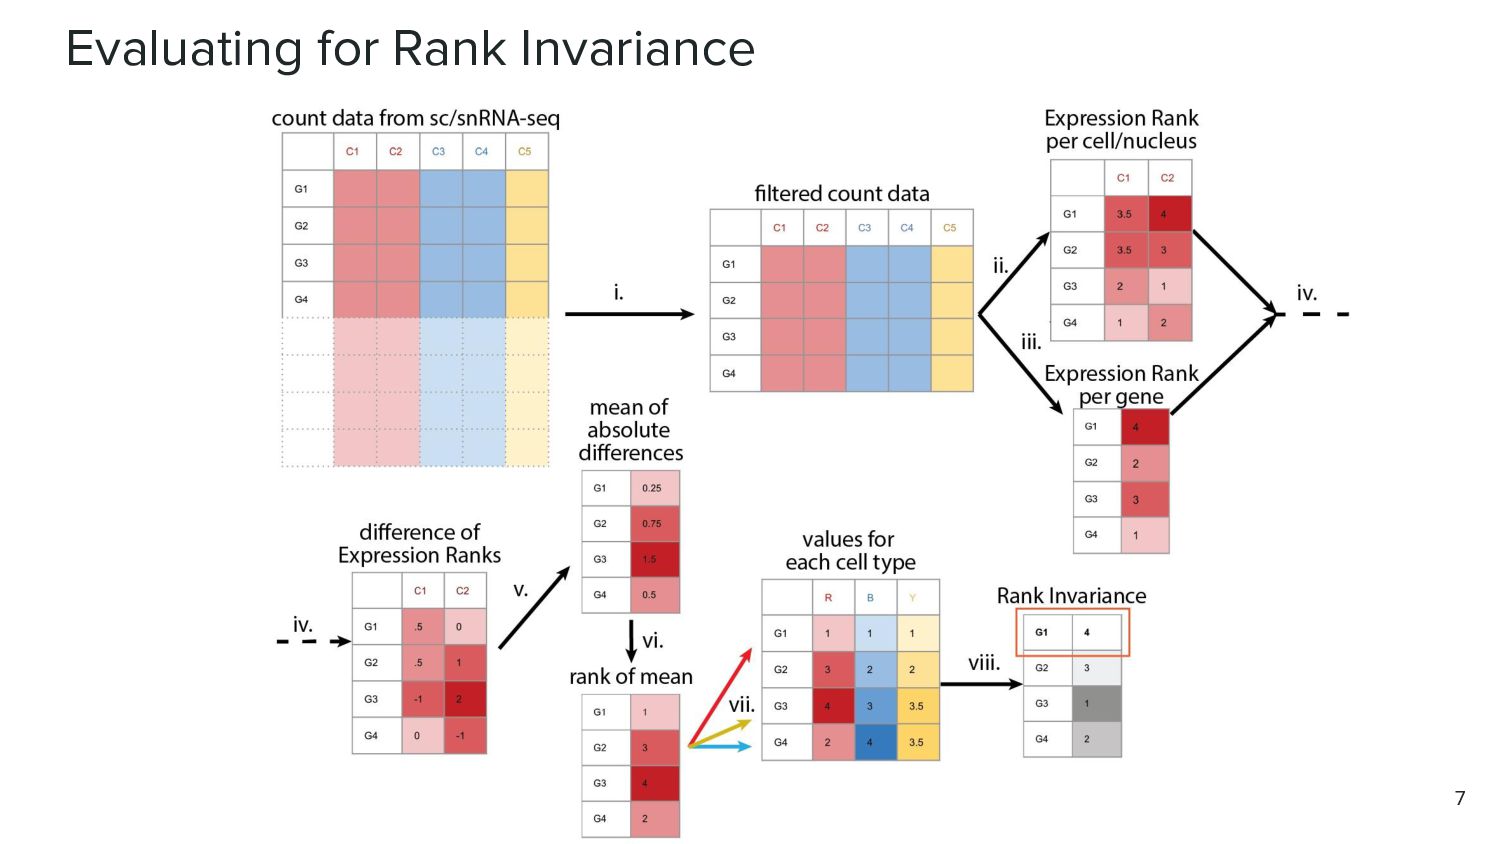
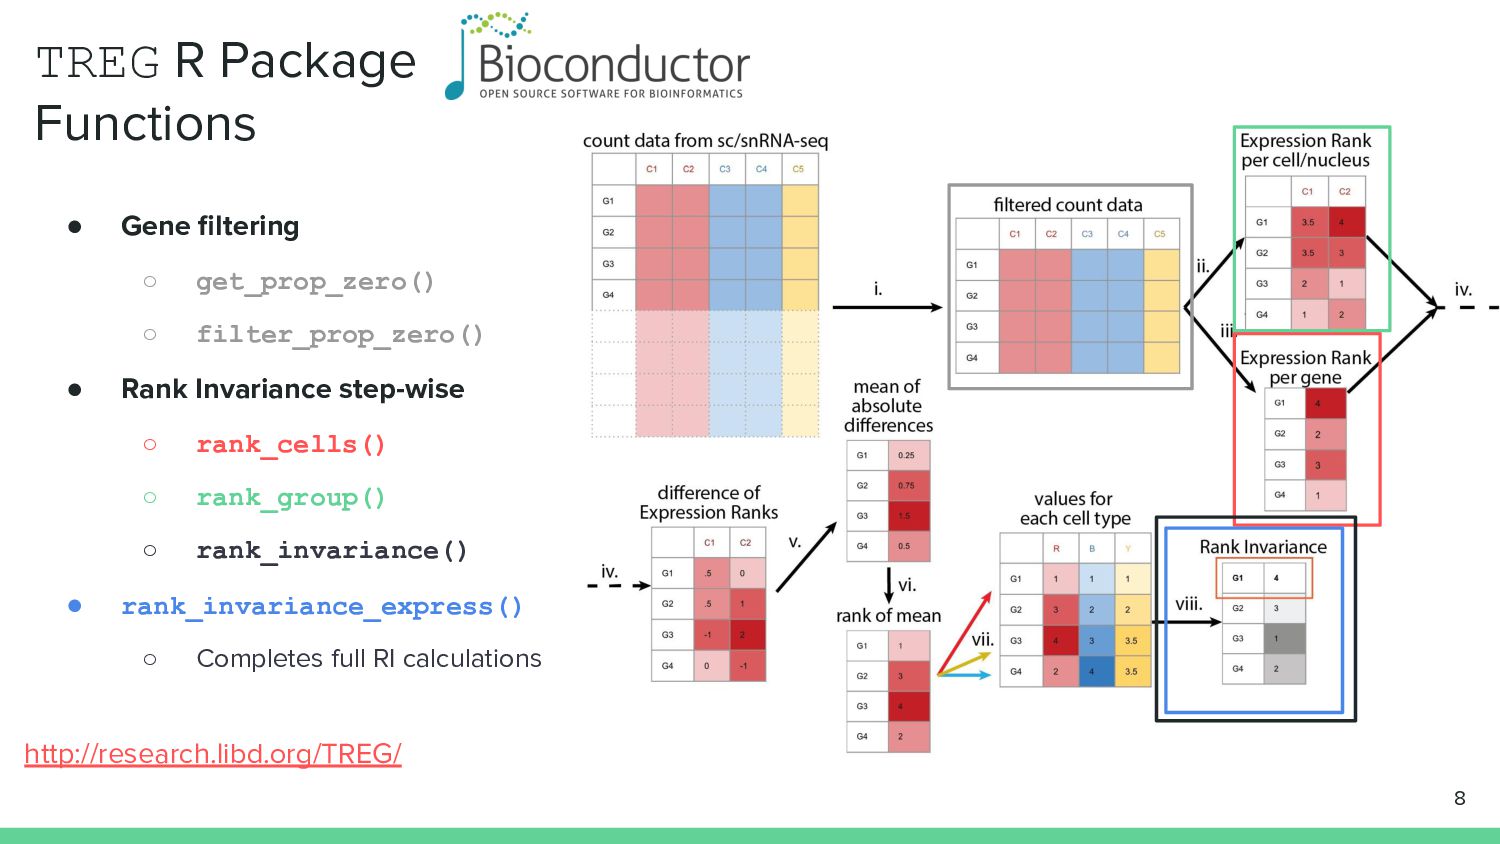
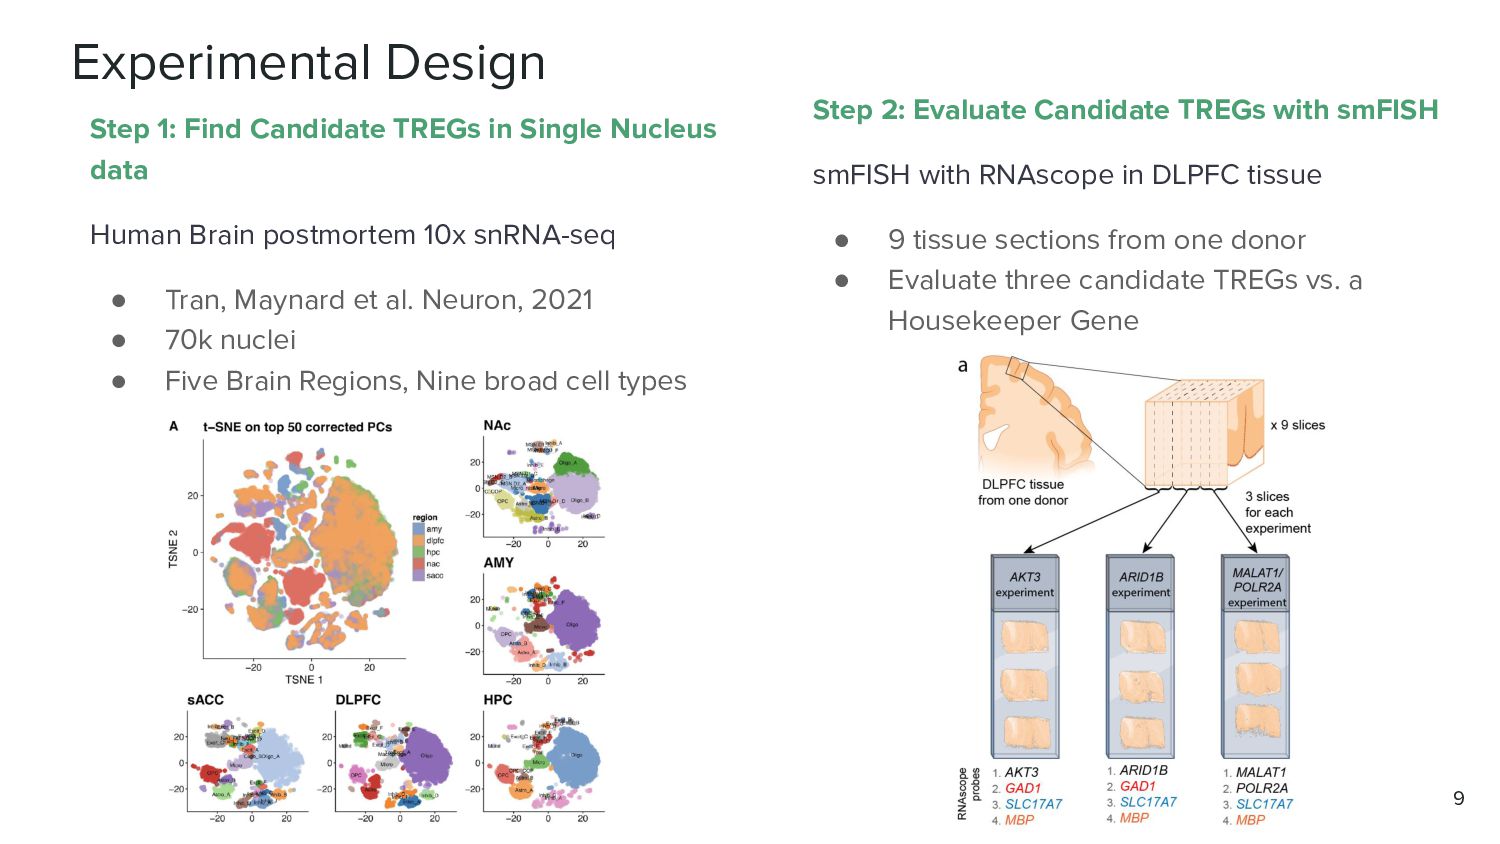
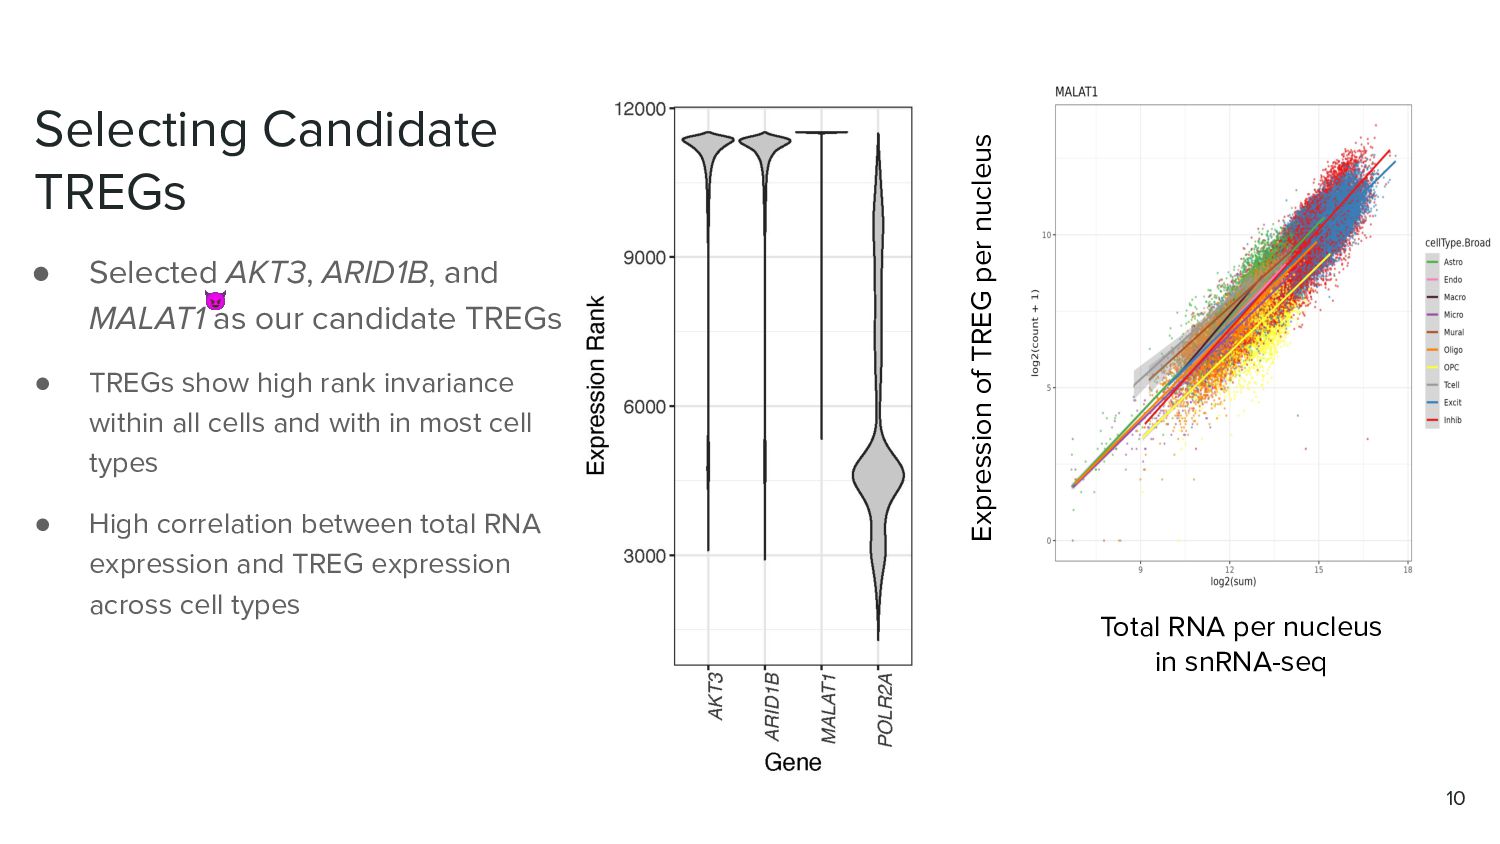
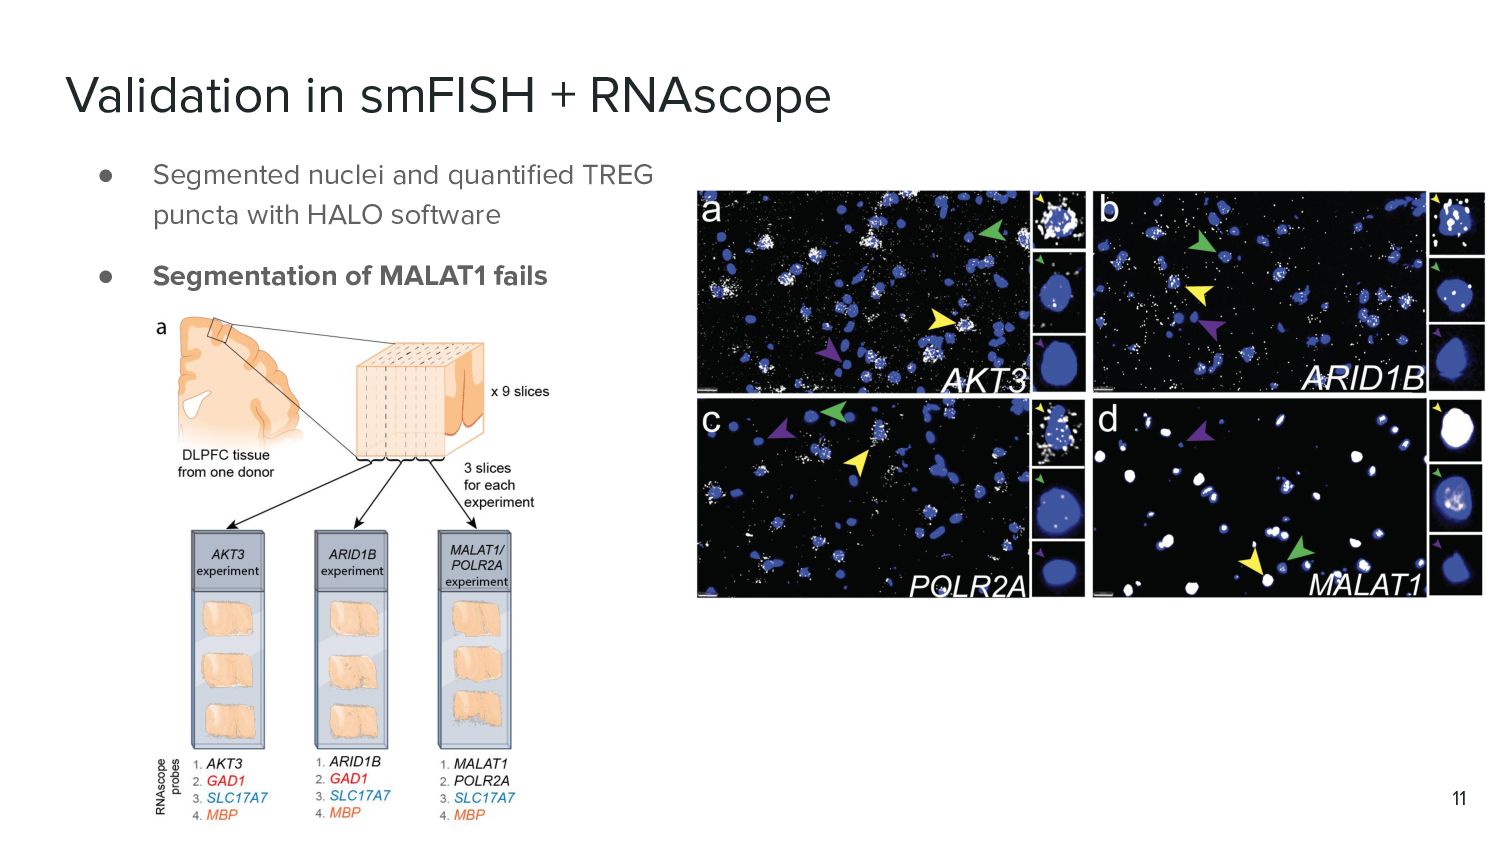
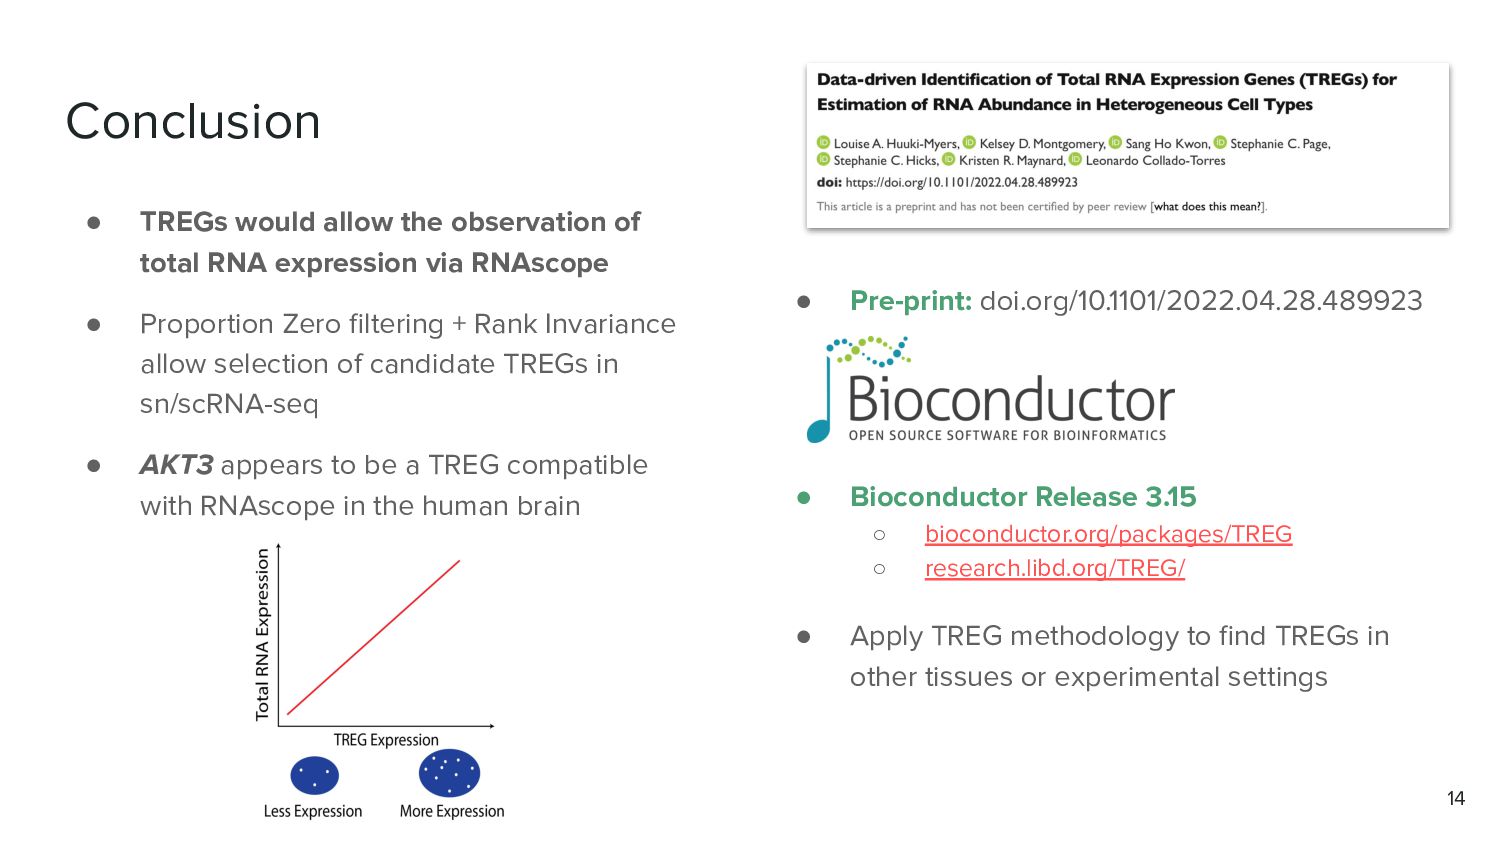
Next generation sequencing technologies have facilitated data-driven identification of gene sets with different features including housekeeping genes, cell-type specific expression, or spatially variable expression. Here, we sought to identify a new class of "control" genes called Total RNA Expression Genes (TREGs), which correlate with total RNA abundance in heterogeneous cell types of different sizes and transcriptional activity. We provide a data-driven method to identify TREGs from single nucleus RNA-seq data (snRNA-seq), available as an R/Bioconductor package at http://research.libd.org/TREG/.

Related to biorxiv.org/content/10.1101/2022.04.28.489923v1

Louise Huuki-Myers

July 28, 2022
Tweet

More Decks by Louise Huuki-Myers

Other Decks in Science

Transcript

  1. Data-driven Identification of Total RNA Expression Genes (TREGs) for Estimation

    of RNA Abundance in Heterogeneous Cell Types Louise Huuki-Myers Staff Scientist Lieber Institute for Brain Development @lahuuki 1
  2. Motivation • Study different cell types in the human brain

    using smFISH with RNAscope ◦ Cell size ◦ Spatial organization in tissue • Interested in total RNA expression of different cell types • Can only measure four genes at a time with smFISH How do we measure total RNA content of a cell if we can only observe a few genes at a time? Use a TREG 2
  3. What is a TREG? • Total RNA Expression Gene •

    Expression is proportional to the overall RNA expression in a cell • In smFISH the count of TREG “puncta” in a cell can estimate the RNA content Each point of light is a “puncta” 3
  4. Data Driven TREG Discovery Identify TREGs in Single Nucleus RNA-seq

    data 1. Filter to top 50% expressed genes 2. Filter out genes with high Proportion Zero expression 3. Select genes with high Rank Invariance as candidate TREGs 4
  5. Evaluating for Rank Invariance • High Rank Invariance = Expressed

    at a constant level in respect to other genes ◦ Evaluate within and across cell types ◦ Selecting for stable “Expression Rank: ▪ By Cell: Higher Expression = Higher Rank 5 75 1 2 3 Cell 1 Cell 2 Cell 3 Cell 4 Cell 5 Gene 1 75 Gene 2 1 ... 3 Gene 100 50 For each cell: rank genes = Expression Rank
  6. • High Rank Invariance = Expressed at a constant level

    in respect to other genes ◦ Evaluate within and across cell types ◦ Selecting for stable “Expression Rank: ▪ By Cell: Higher Expression = Higher Rank Evaluating for Rank Invariance 6 75 1 2 3 Cell 1 Cell 2 Cell 3 Cell 4 Cell 5 Gene 1 75 75 74 73 75 Gene 2 1 90 55 75 20 ... Gene 100 Select for stable/invariant Expression Rank
  7. TREG R Package Functions 8 • Gene filtering ◦ get_prop_zero()

    ◦ filter_prop_zero() • Rank Invariance step-wise ◦ rank_cells() ◦ rank_group() ◦ rank_invariance() • rank_invariance_express() ◦ Completes full RI calculations http://research.libd.org/TREG/
  8. Experimental Design Step 2: Evaluate Candidate TREGs with smFISH smFISH

    with RNAscope in DLPFC tissue • 9 tissue sections from one donor • Evaluate three candidate TREGs vs. a Housekeeper Gene Step 1: Find Candidate TREGs in Single Nucleus data Human Brain postmortem 10x snRNA-seq • Tran, Maynard et al. Neuron, 2021 • 70k nuclei • Five Brain Regions, Nine broad cell types 9
  9. Selecting Candidate TREGs • Selected AKT3, ARID1B, and MALAT1 as

    our candidate TREGs • TREGs show high rank invariance within all cells and with in most cell types • High correlation between total RNA expression and TREG expression across cell types 10 Total RNA per nucleus in snRNA-seq Expression of TREG per nucleus 😈
  10. Validation in smFISH + RNAscope • Segmented nuclei and quantified

    TREG puncta with HALO software • Segmentation of MALAT1 fails 11
  11. TREG quantification across DLPFC tissue 12 • We observed more

    TREG expression in transcriptionally active grey matter ◦ Aligns with location of neurons • Follows with expected pattern of RNA expression
  12. Patterns of Observed Puncta over Cell Types • TREGs were

    expressed in most cells • AKT3 tracks really well with pattern of expression across cell types seen in snRNA-seq ◦ ARID1B also performs well RNAscope Gene Mean Prop. Cells with Expression Prop. non-zero in dlpfc snRNA Standard β (sn = -1.33) AKT3 0.88 0.92 -1.07 ARID1B 0.86 0.94 -0.77 MALAT1 0.98 1.00 -0.8 POLR2A 0.78 0.30 -1.05 13
  13. Conclusion • TREGs would allow the observation of total RNA

    expression via RNAscope • Proportion Zero filtering + Rank Invariance allow selection of candidate TREGs in sn/scRNA-seq • AKT3 appears to be a TREG compatible with RNAscope in the human brain • Pre-print: doi.org/10.1101/2022.04.28.489923 • Bioconductor Release 3.15 ◦ bioconductor.org/packages/TREG ◦ research.libd.org/TREG/ • Apply TREG methodology to find TREGs in other tissues or experimental settings 14
  14. Acknowledgements Leonardo Collado-Torres Kristen Maynard Stephanie C Hicks LIBD Johns

    Hopkins 15 Kelsey Montgomery Sang Ho Kwon Pre-print: doi.org/10.1101/2022.04.28.489923 Stephanie Page Say hi on Twitter! @lahuuki