Christine Y. Zhang was a guest lecturer for Leonardo's #RStats JHBPSH class. Christine gave a talk for the 140.776 Statistical Computing class in the 2025-2026 academic year at Johns Hopkins Bloomberg School of Public Health. You can watch a recording of this talk at https://youtu.be/SeLucCb05Dk.
For more information on Christine Y. Zhang, check https://christineyzhang.com/ and https://www.one-tab.com/page/wazgGeFlRA6O-aDeRqTgtw.
For more information about the materials discussed in this video, check the slides available at https://speakerdeck.com/lcolladotor/data-viz-talk-cz-2025. See also the class website at https://lcolladotor.github.io/jhustatcomputing/.
For more information about the Leonardo, check https://bsky.app/profile/lcolladotor.bsky.social.
Zoom AI summary:
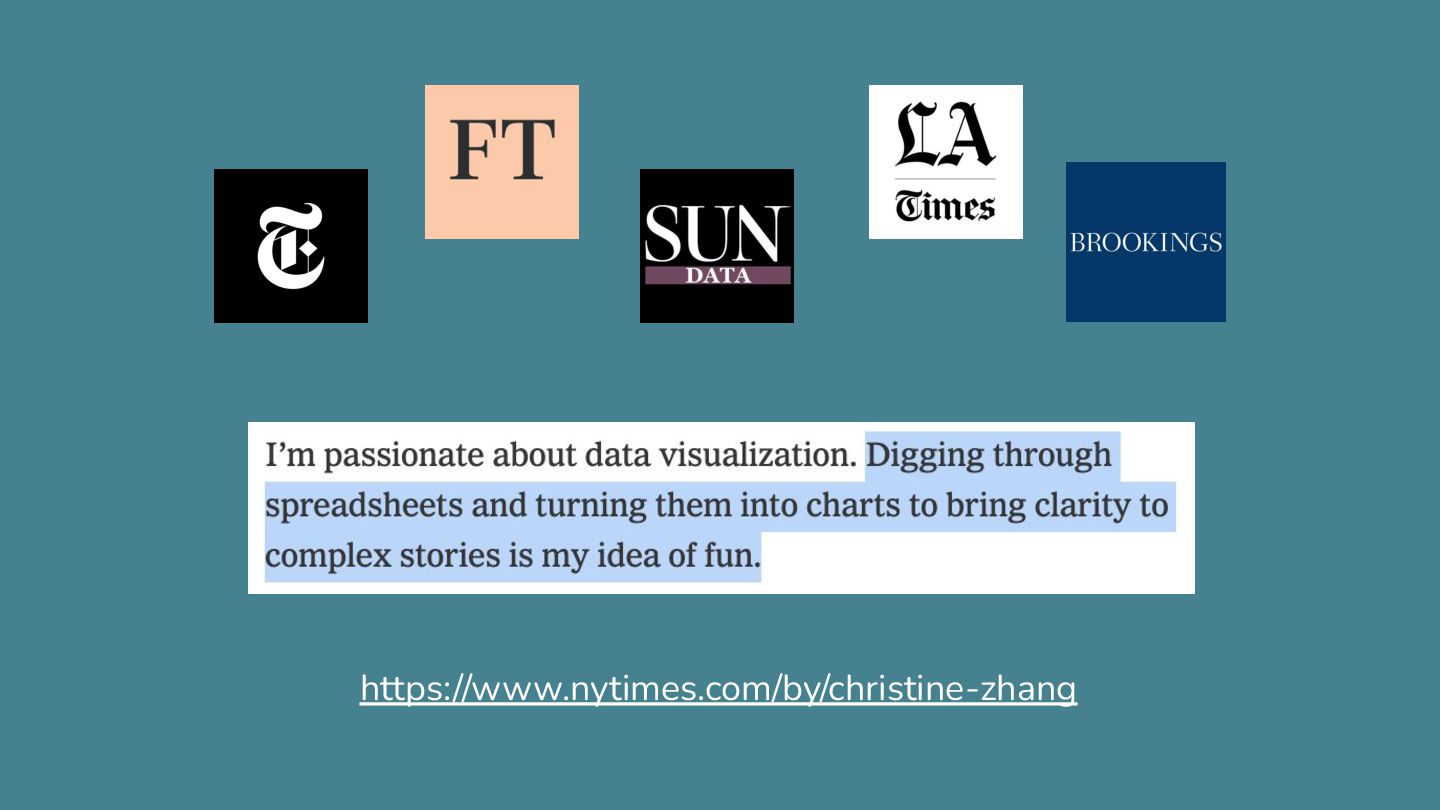
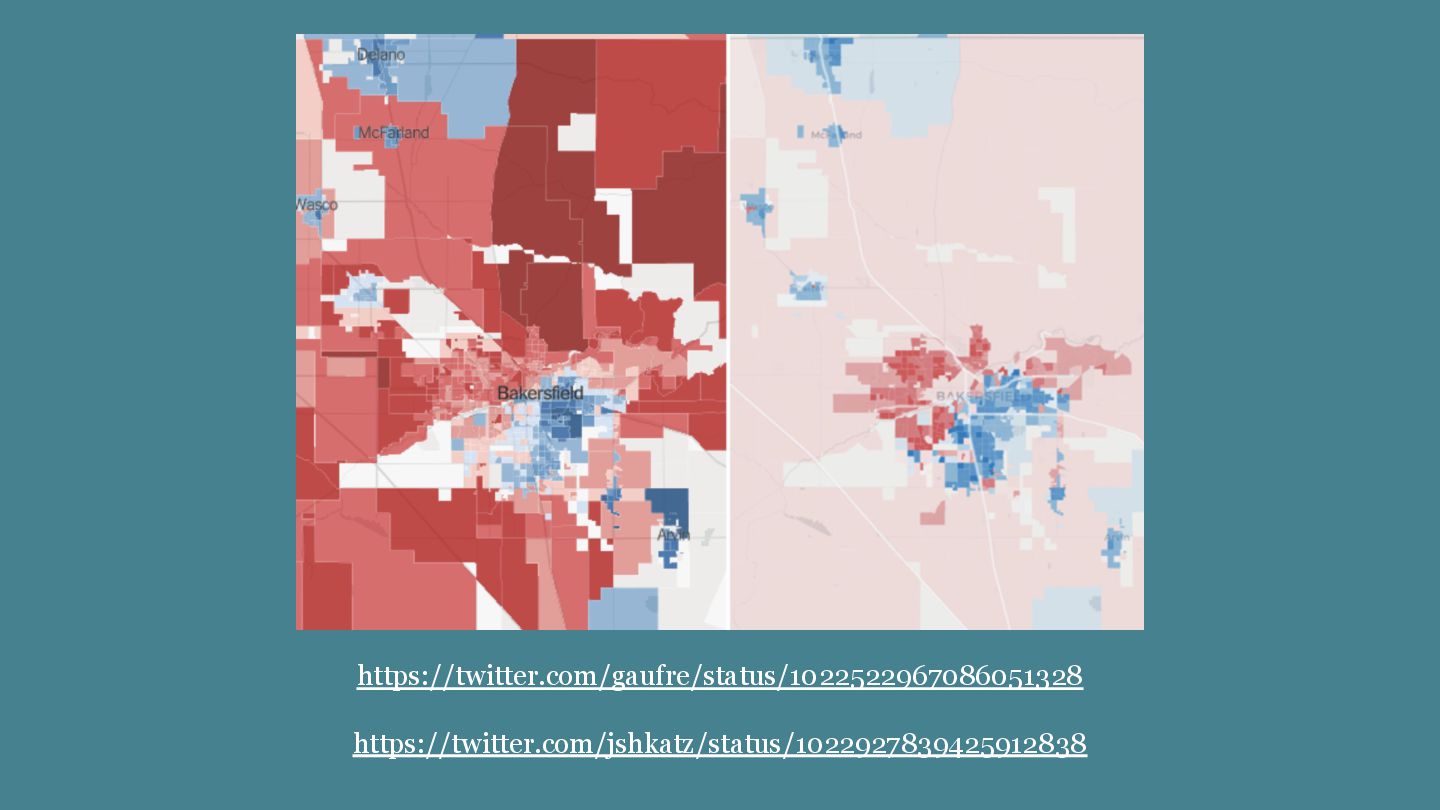
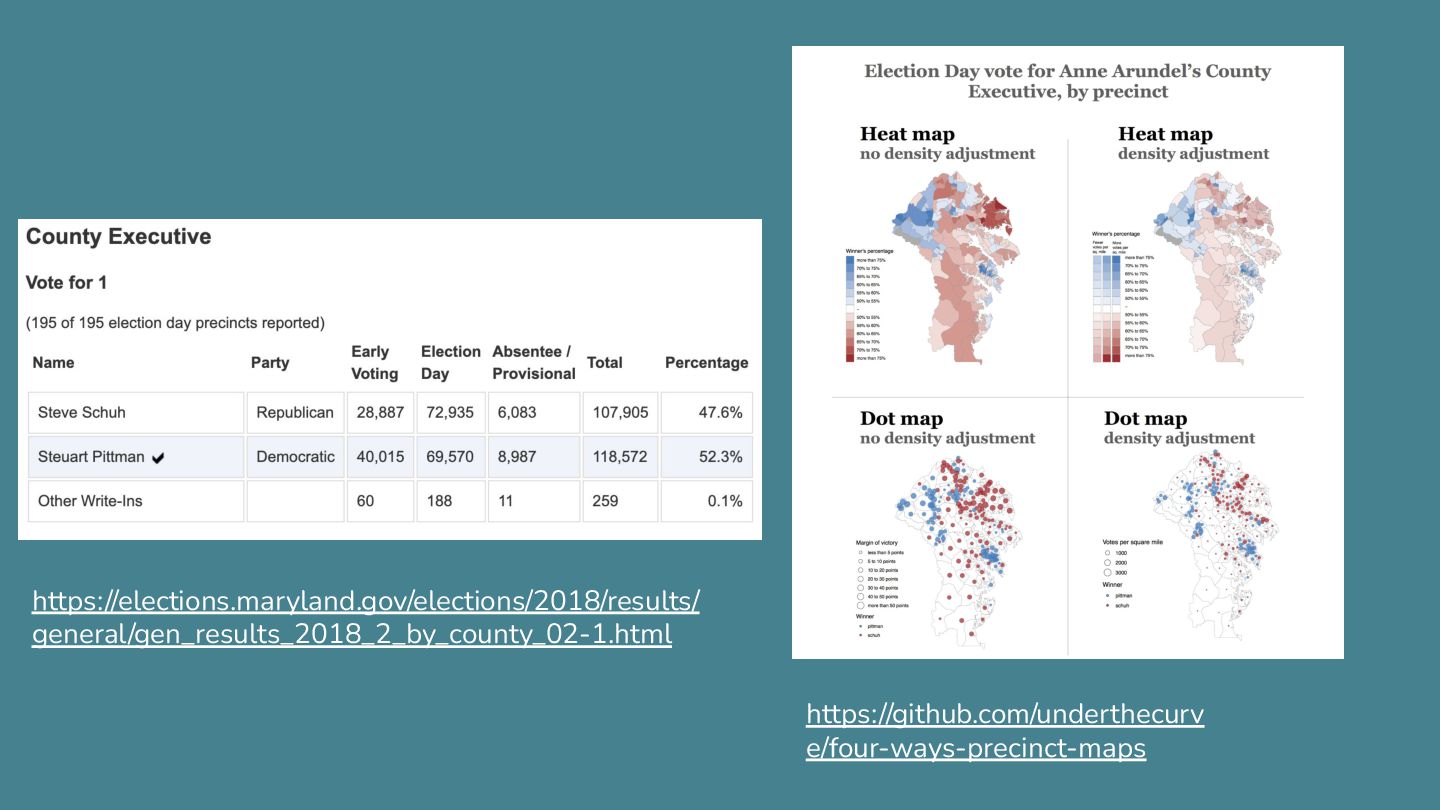
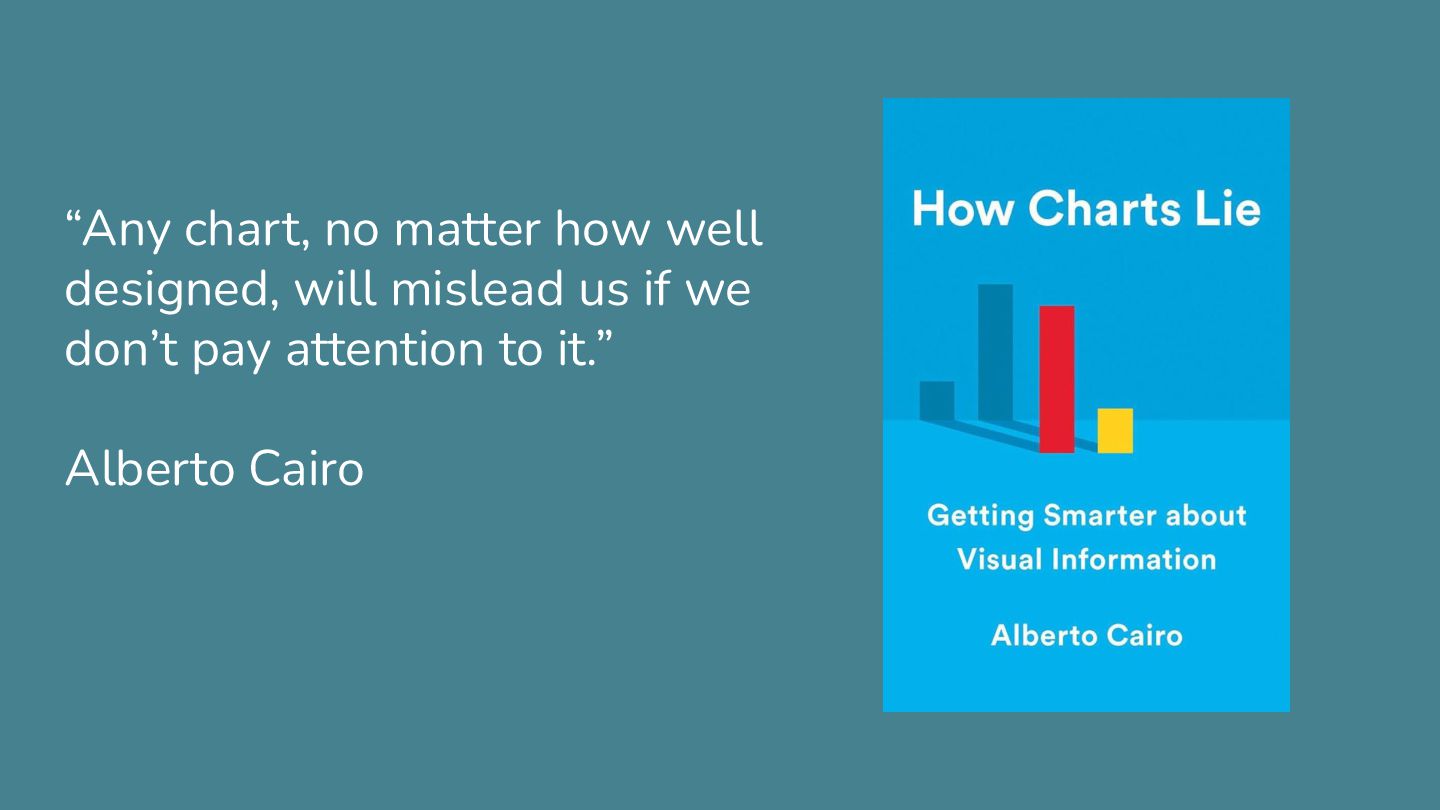
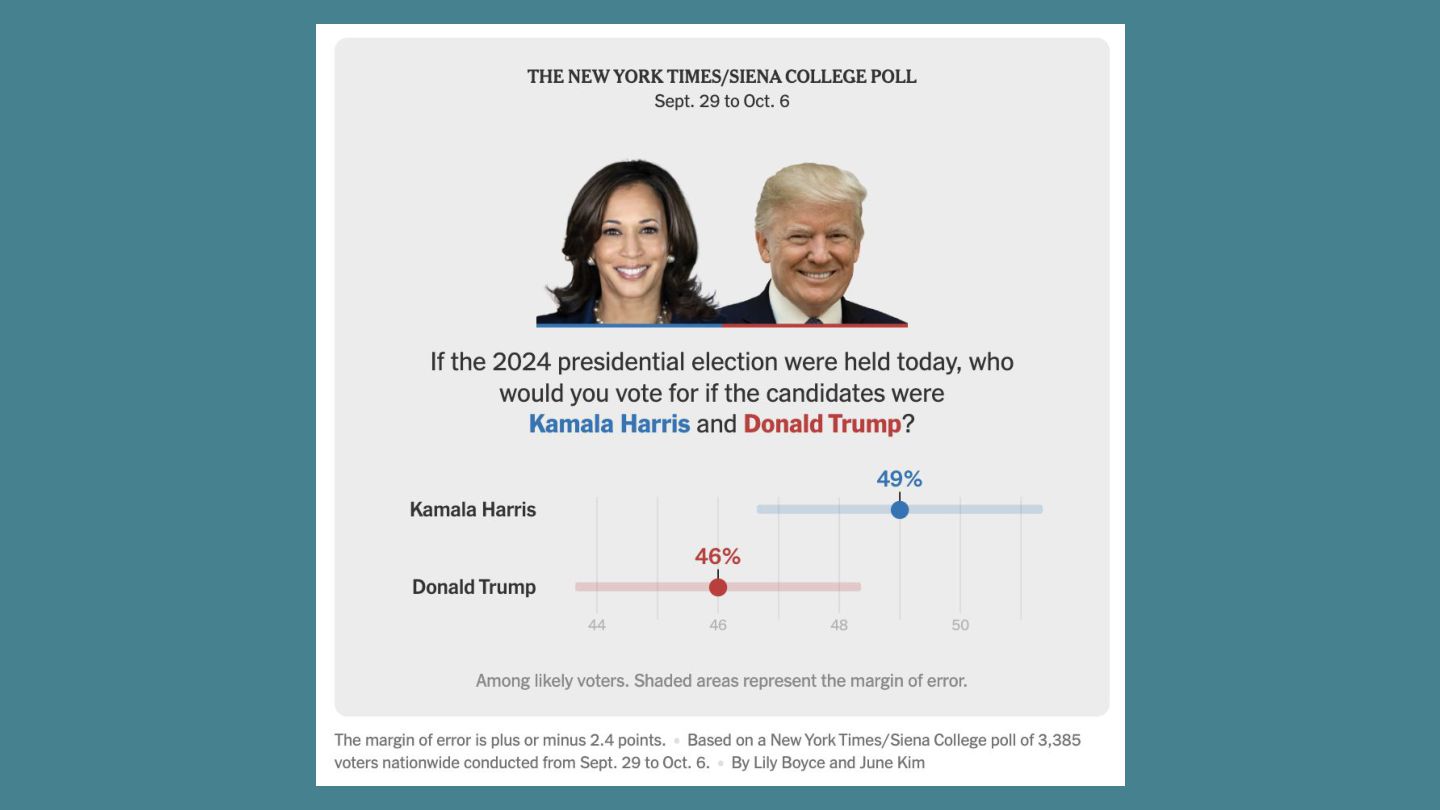
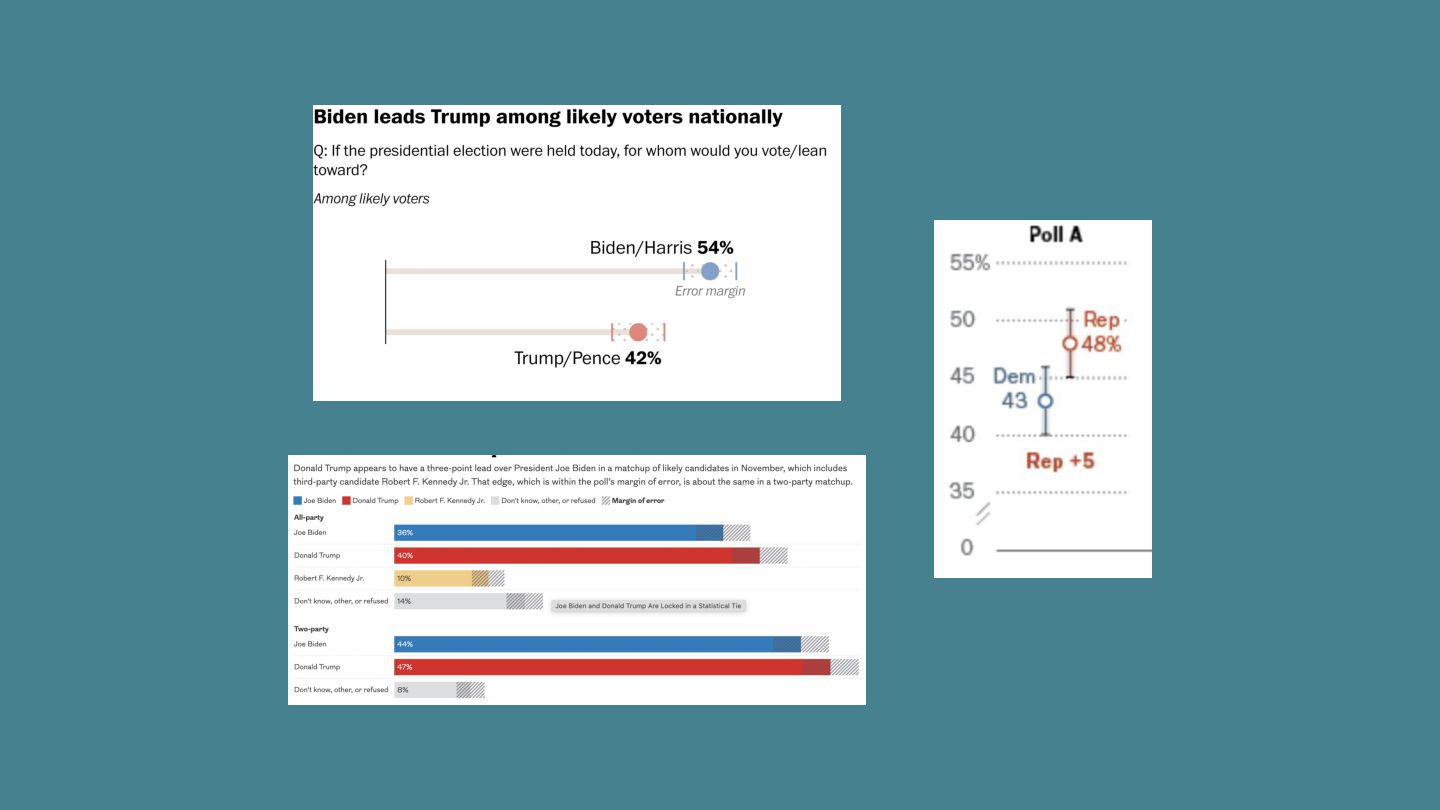
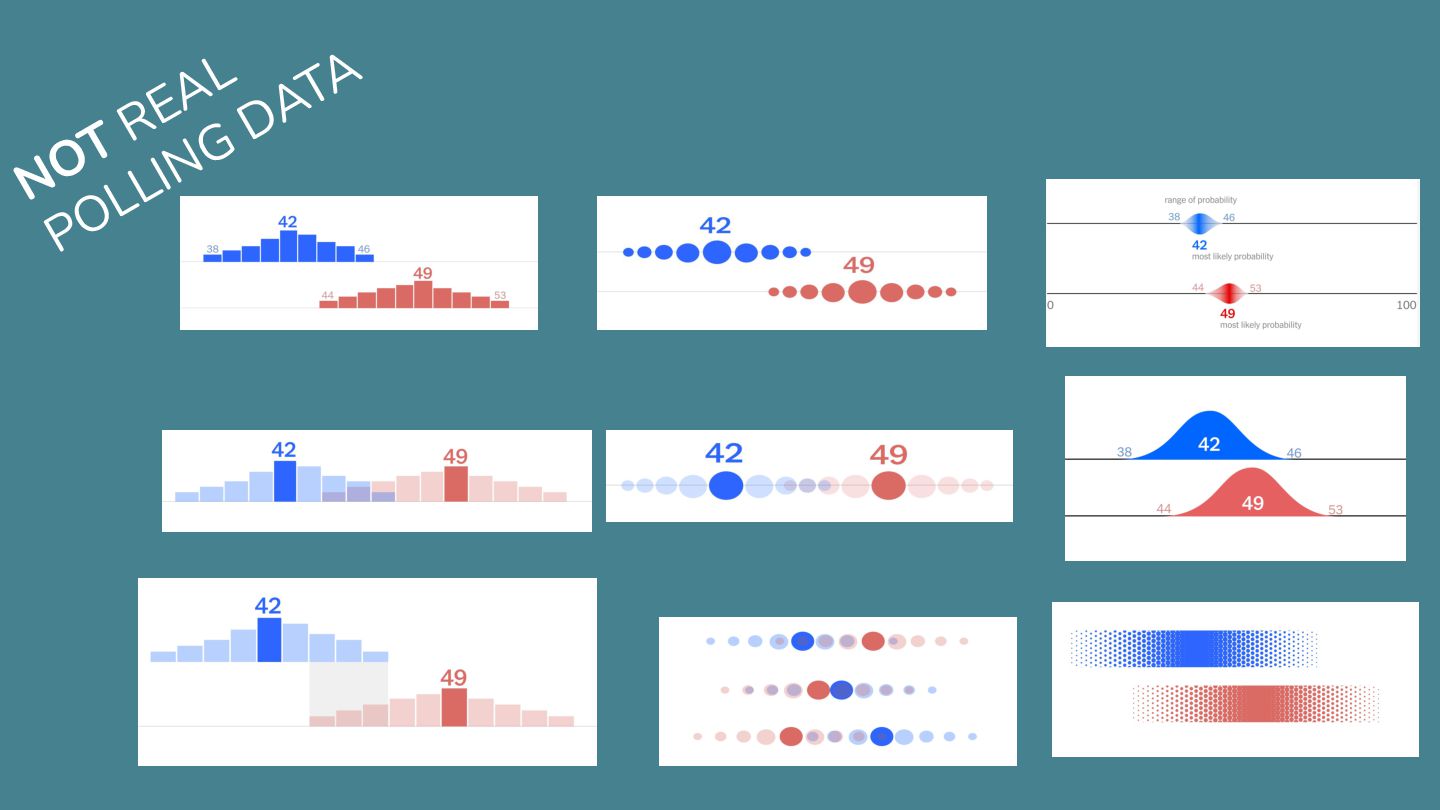
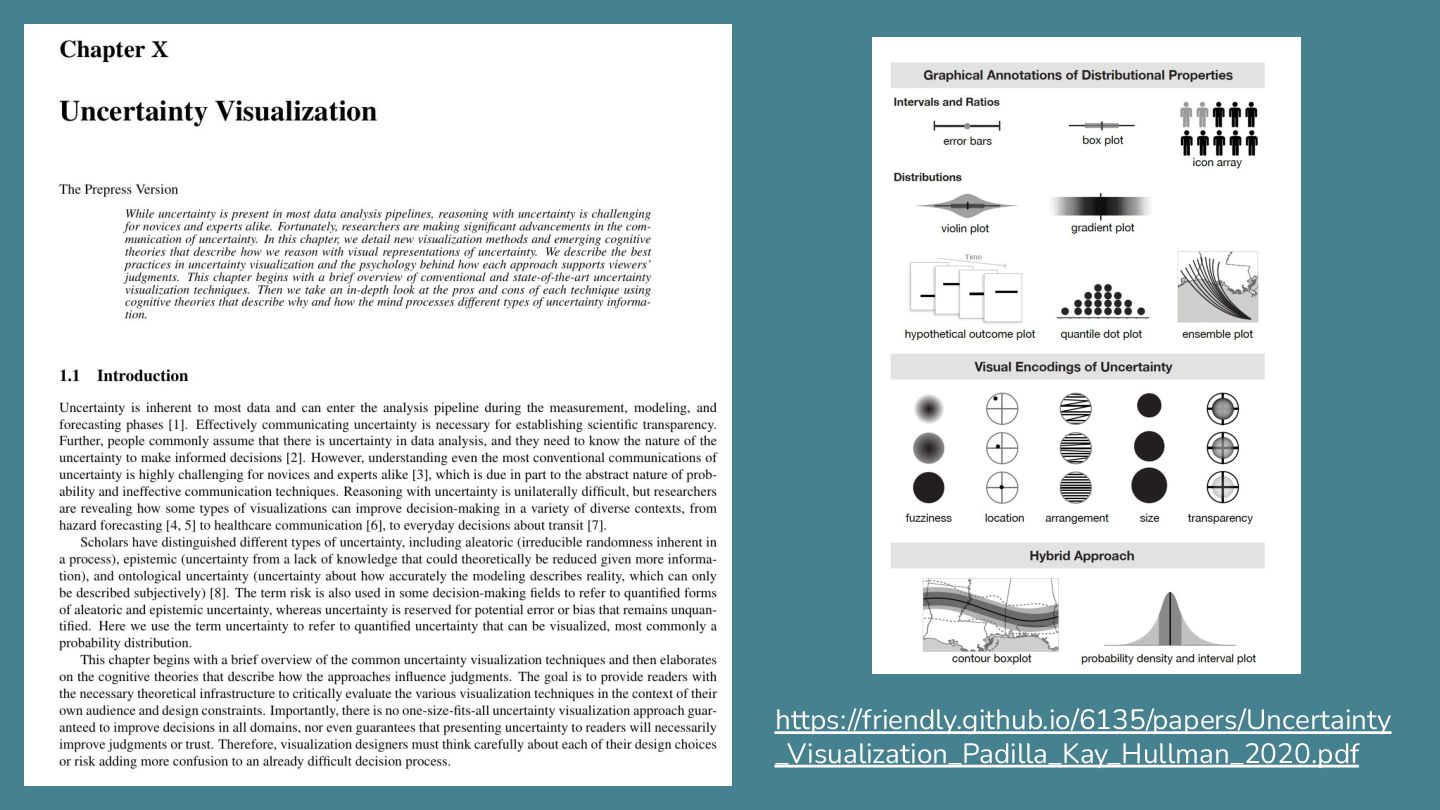
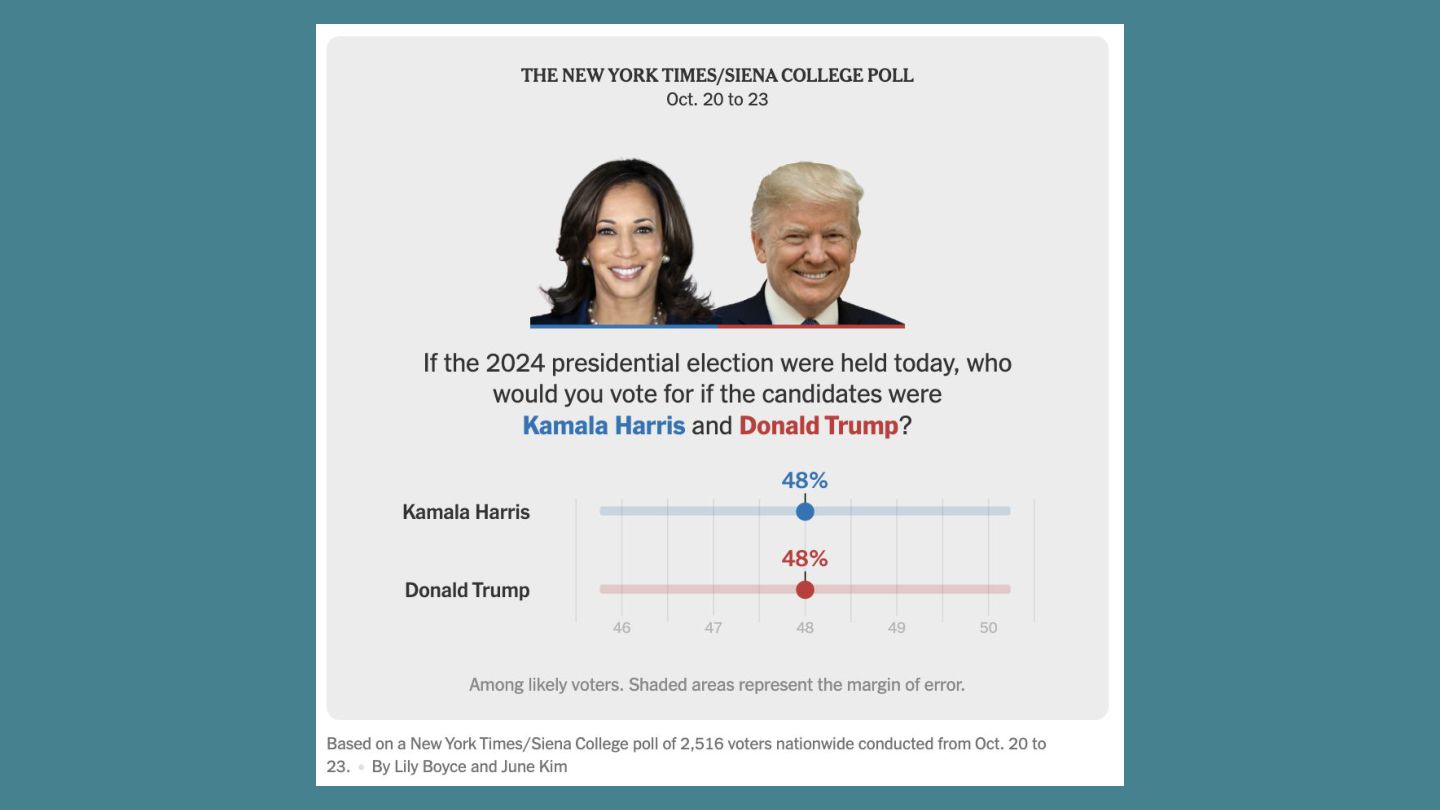
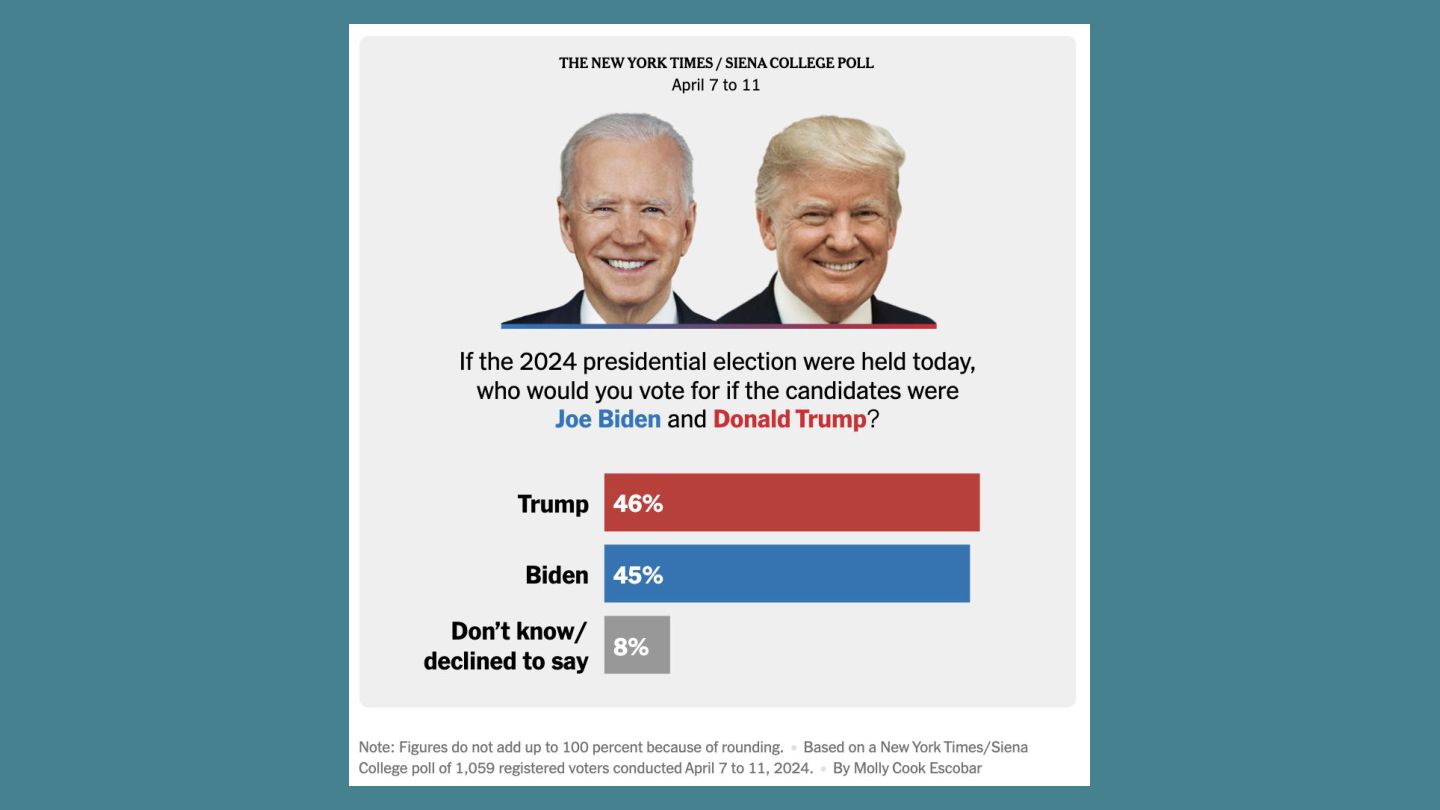
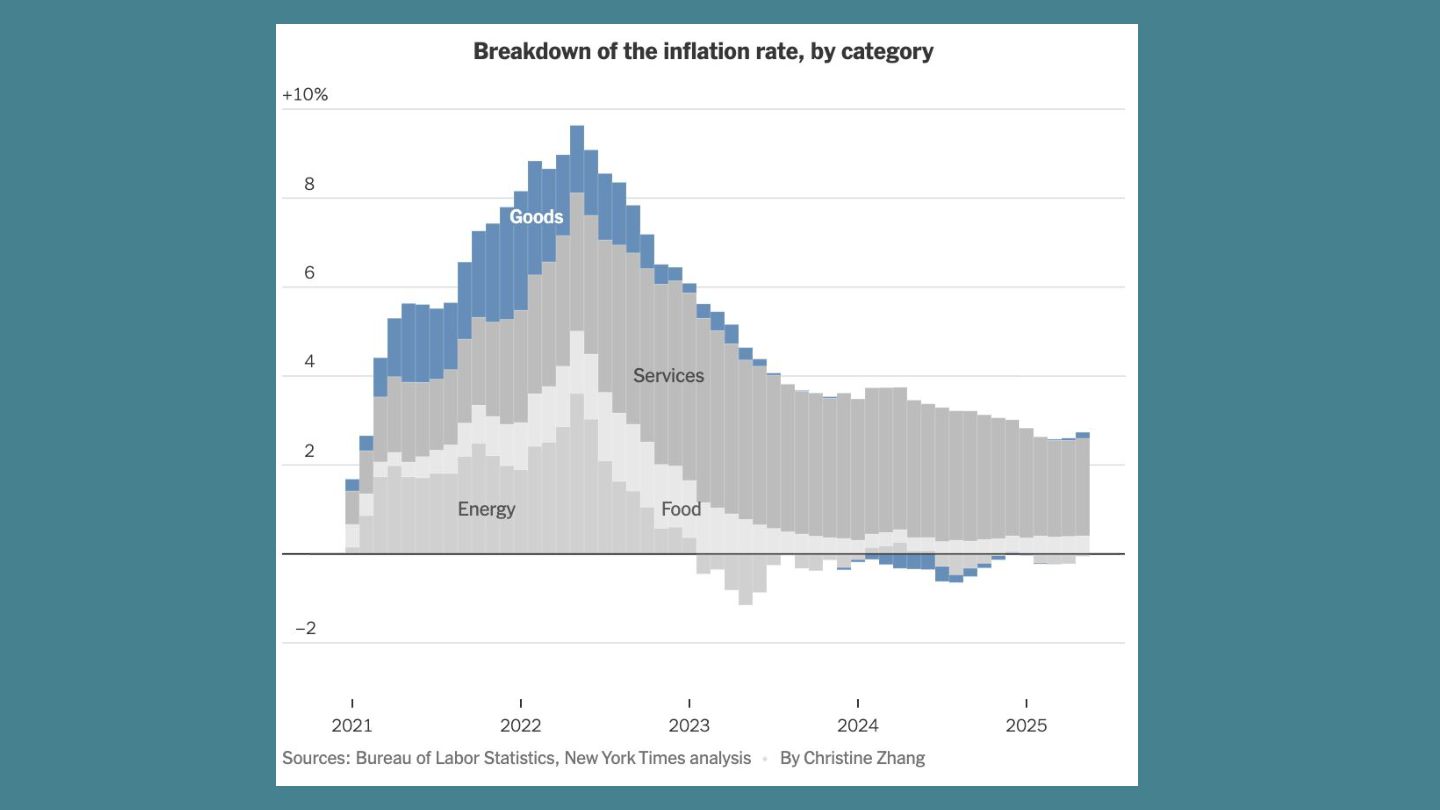
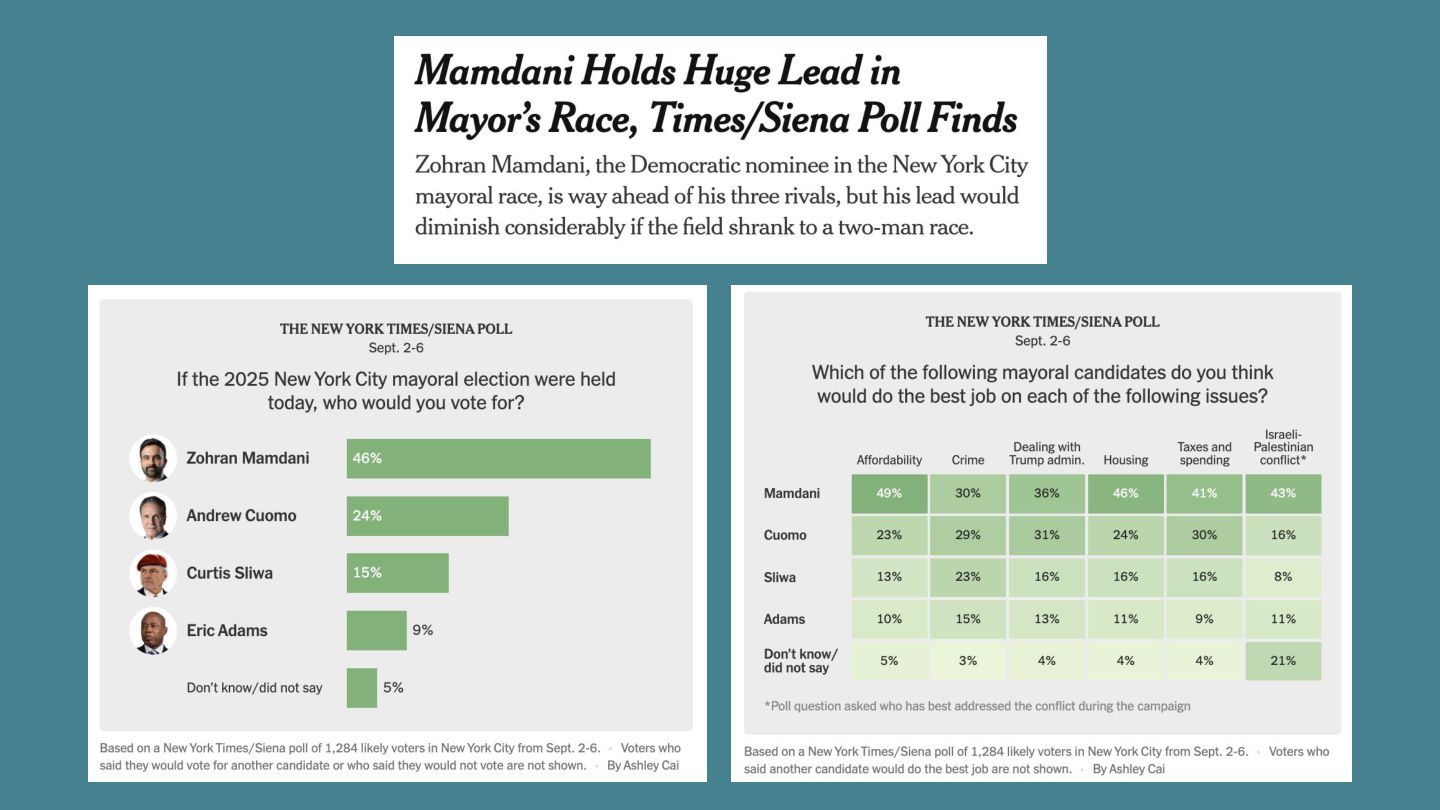
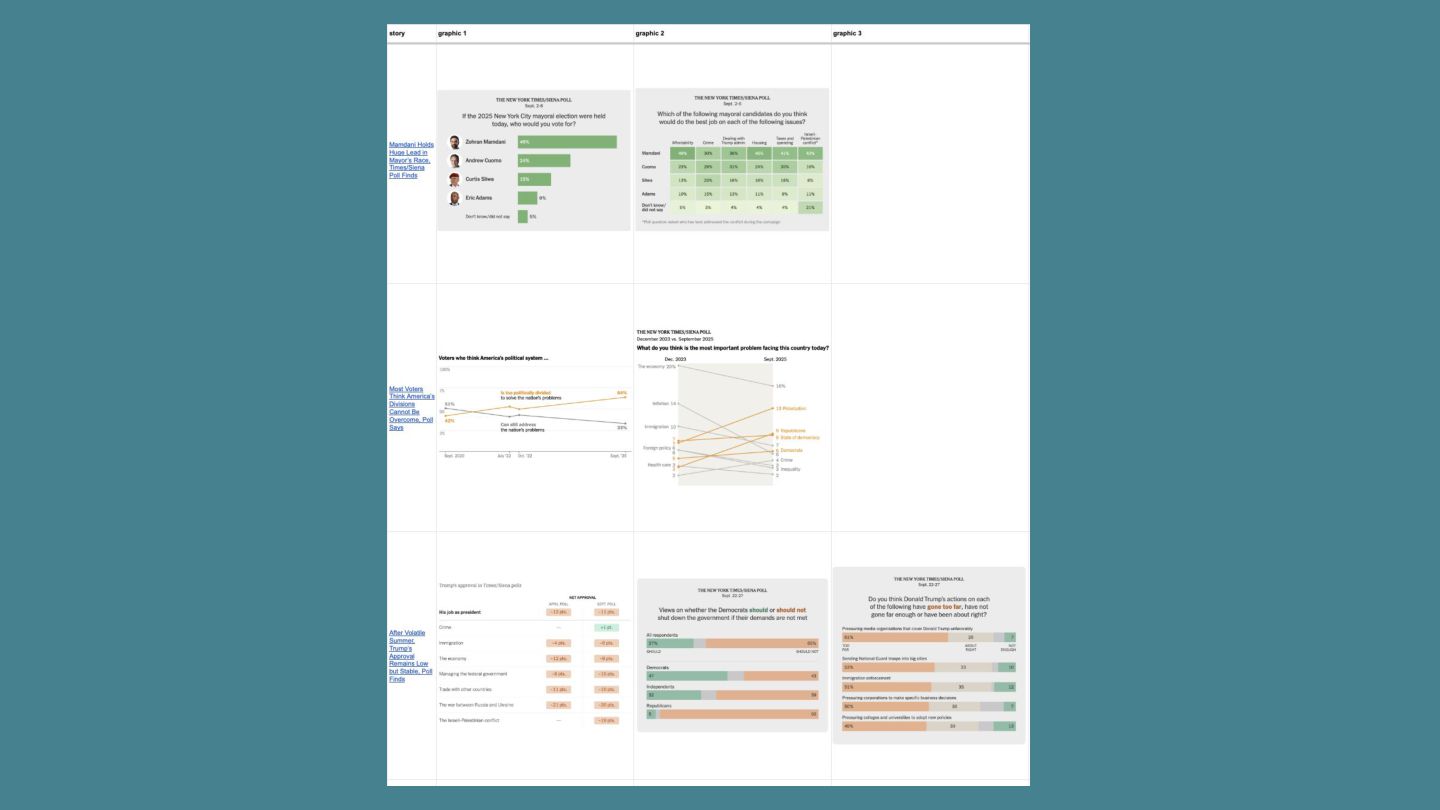
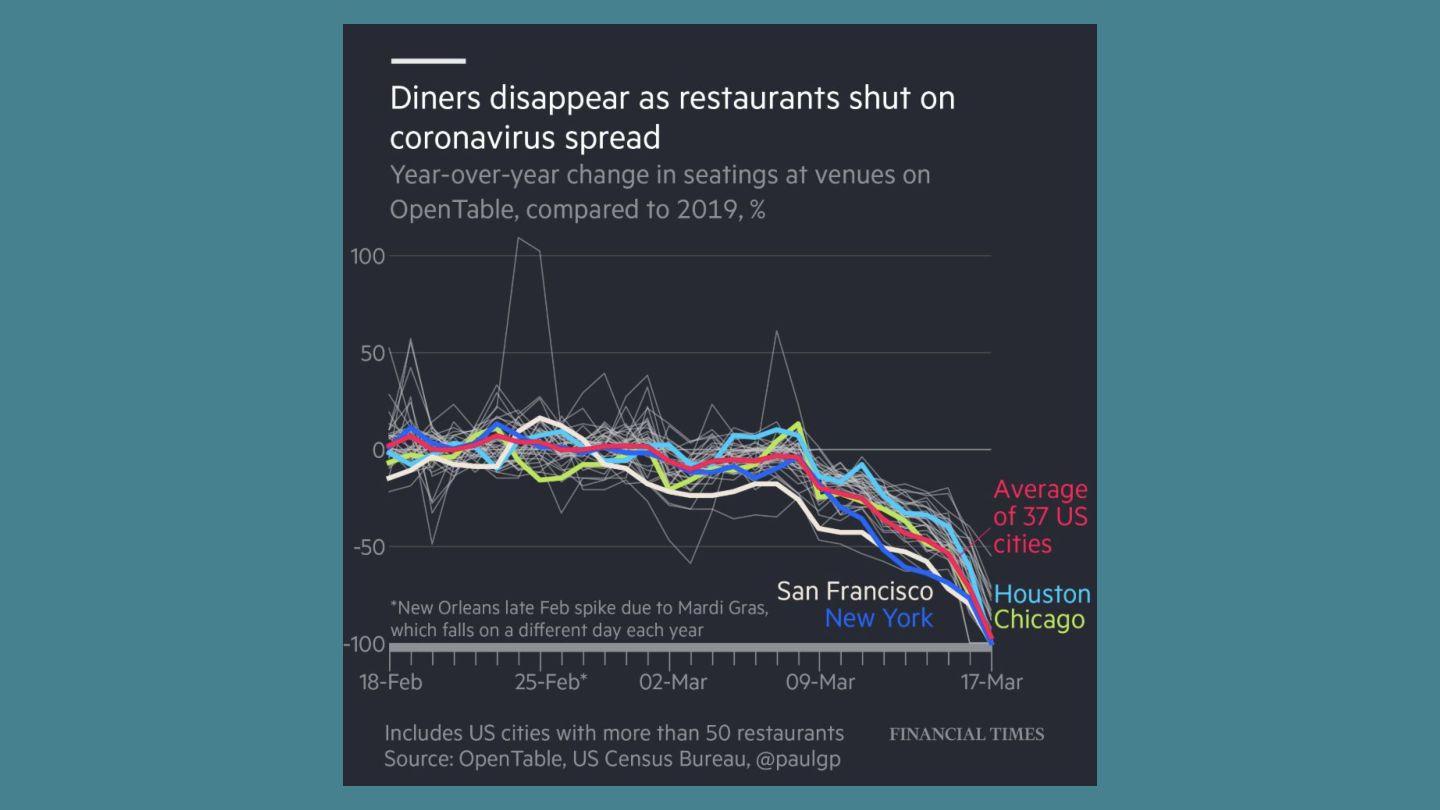
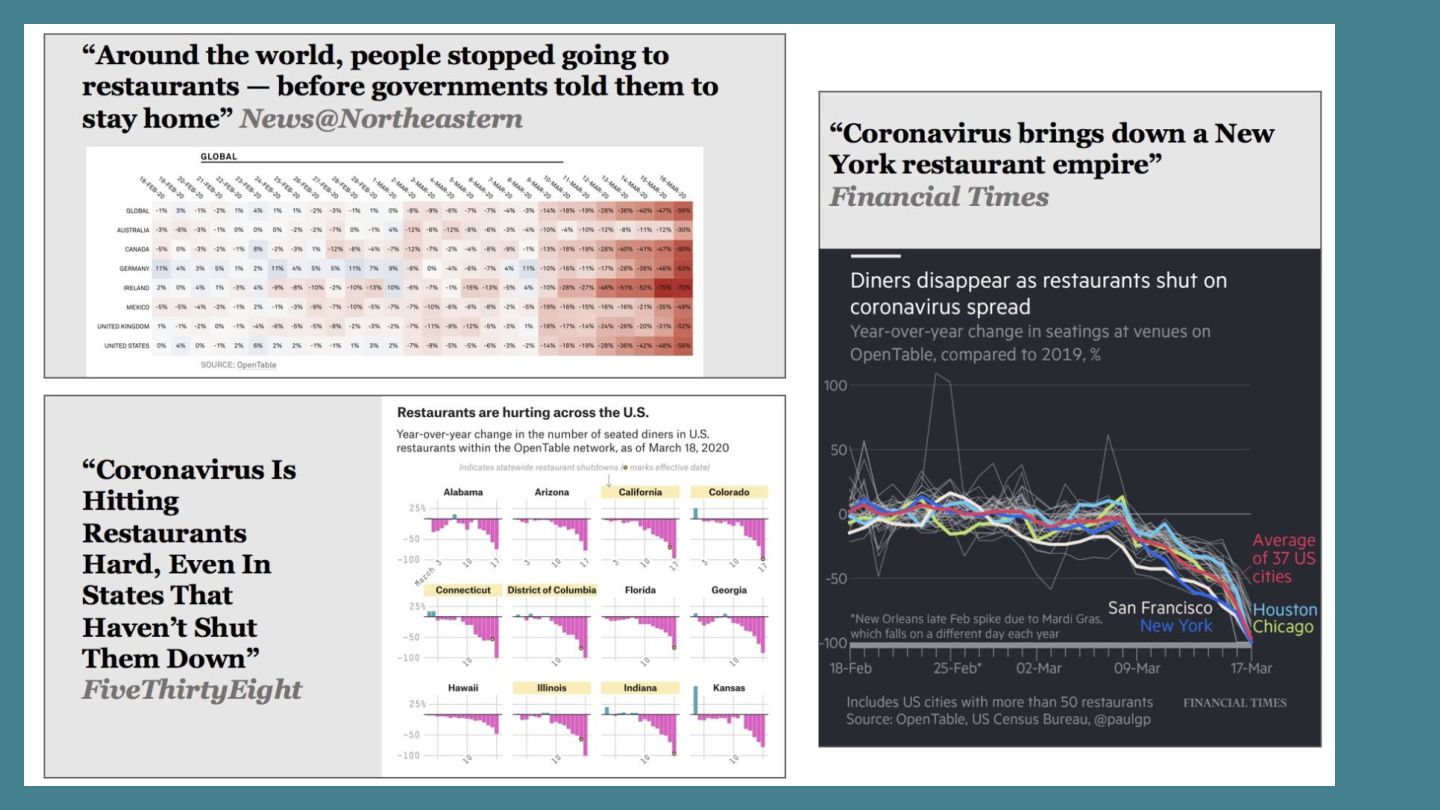
Christine Zhang, a data journalist and graphics editor at the New York Times, discussed the importance of community in the R programming language and shared her experience with data visualization principles and election result mapping. She explored various visualization techniques, including the use of color scales, annotations, and uncertainty representation in election polls, while emphasizing the importance of accurate data representation and visual consistency. Christine also shared examples of creative data visualizations and discussed the collaboration between graphics editors and reporters in creating effective visual storytelling across different platforms.
Zoom AI next steps:
1. Students to explore the GitHub repo Christine created for the Anne Arundel County election map project.
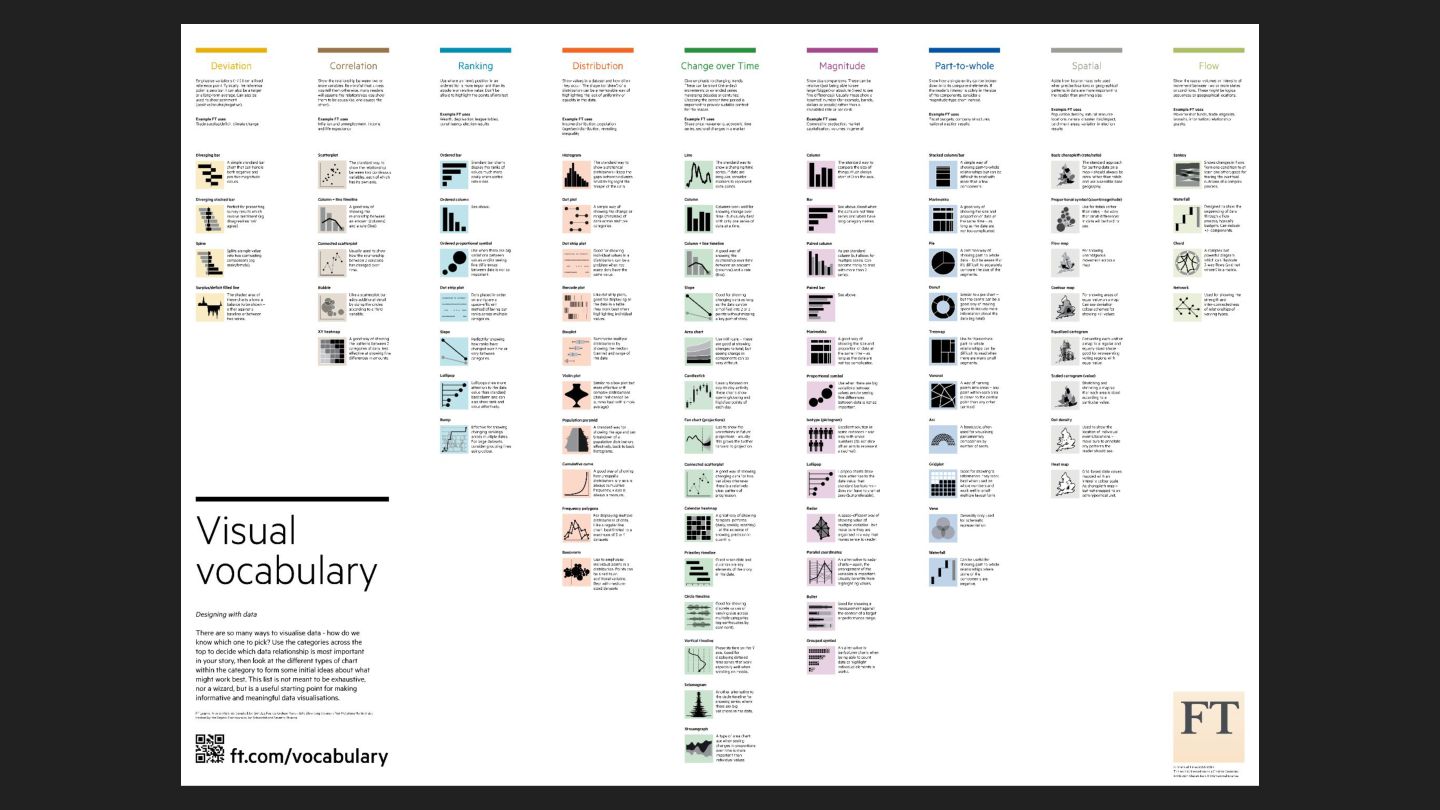
2. Students to review the Visual Vocabulary poster at https://ft.com/vocabulary for guidance on chart selection.
Tools mentioned by Christine:
* R: https://cran.r-project.org/
* ggplot2: https://ggplot2.tidyverse.org/
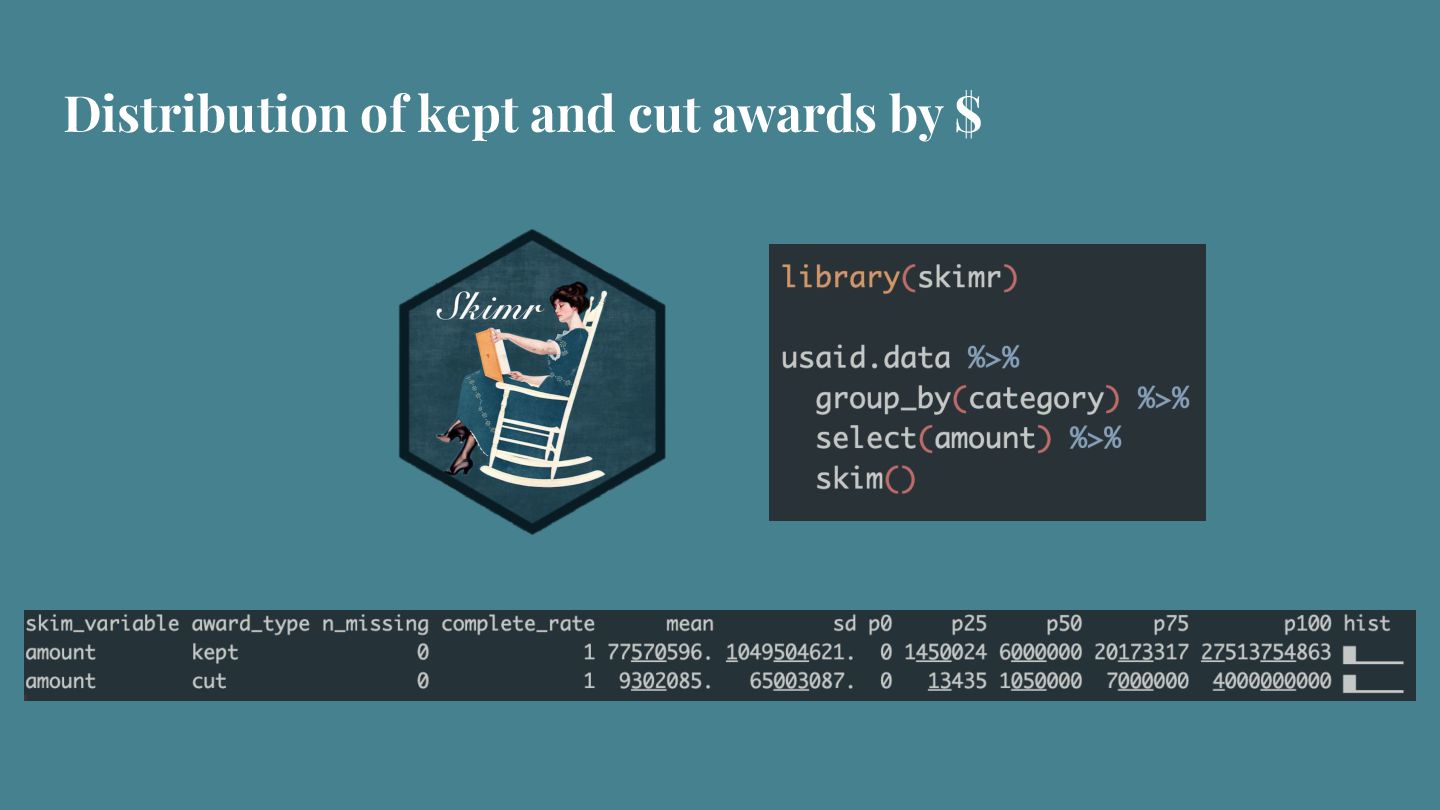
* skimr: https://docs.ropensci.org/skimr/
* Adobe Illustrator: https://www.adobe.com/products/illustrator.html
* rawgraphs: https://www.rawgraphs.io/
* Datawrapper: https://www.datawrapper.de/
* Layer Cake: https://layercake.graphics/
Self practice links:
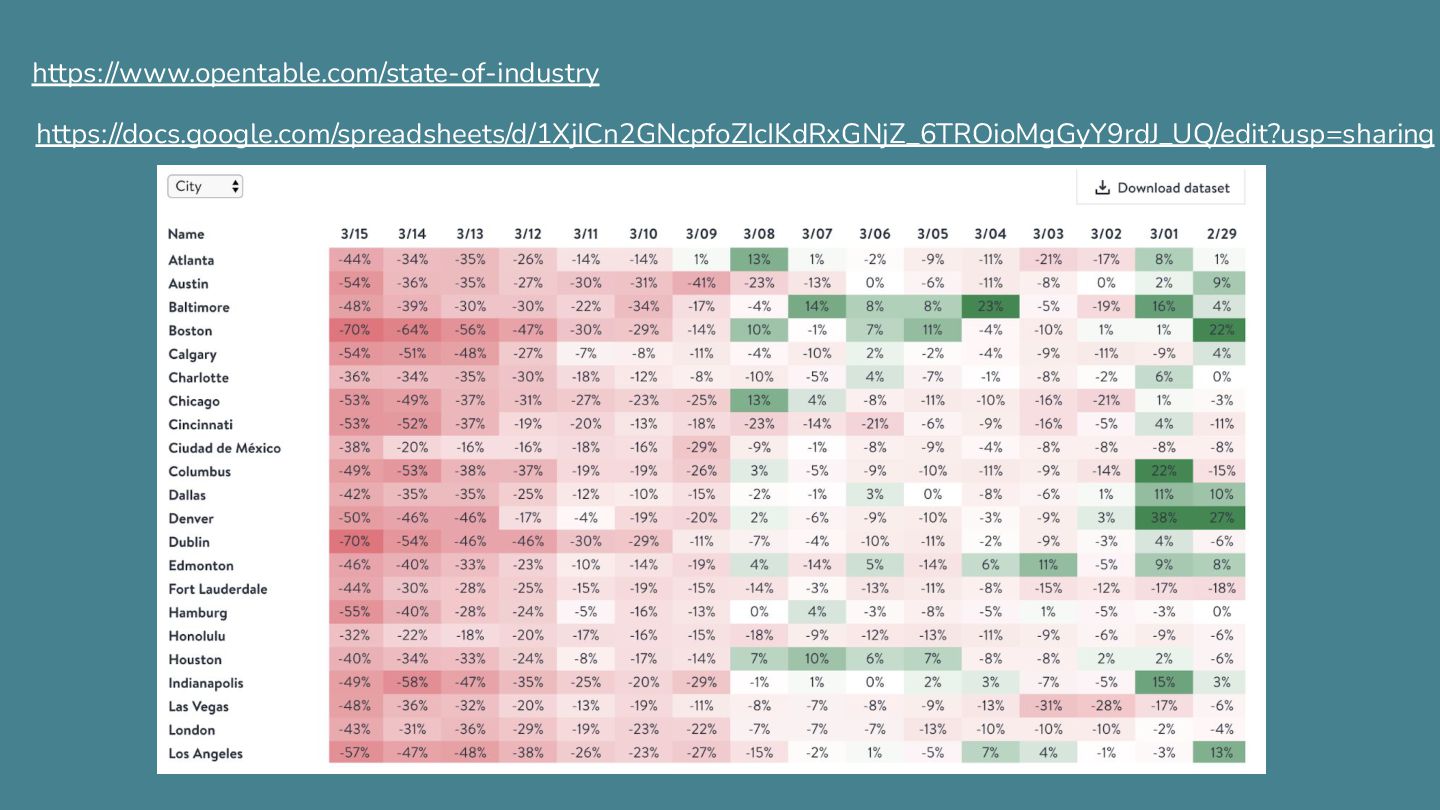
* OpenTable data https://www.opentable.com/c/state-of-industry/ and https://docs.google.com/spreadsheets/d/1XjICn2GNcpfoZIcIKdRxGNjZ_6TROioMgGyY9rdJ_UQ/edit?usp=sharing
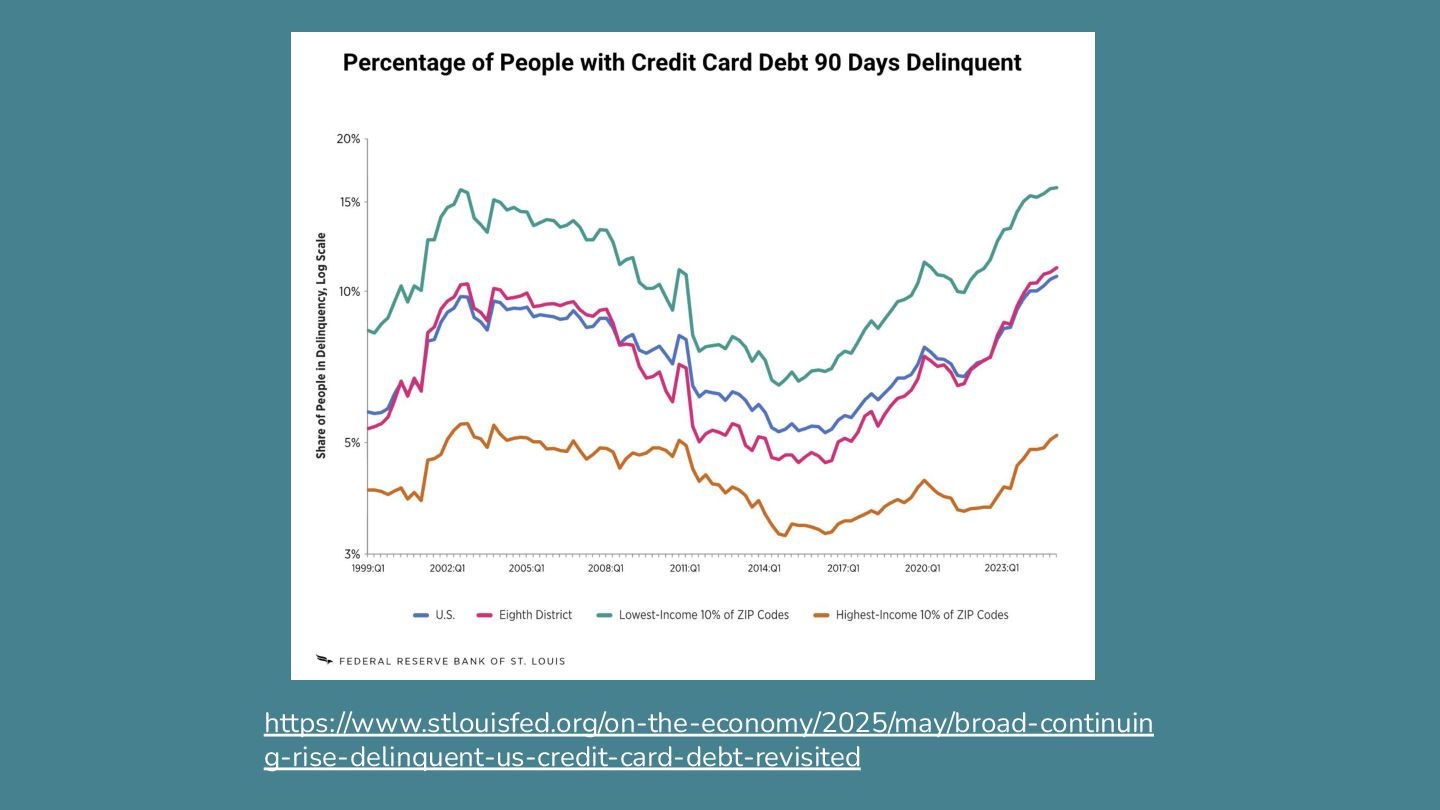
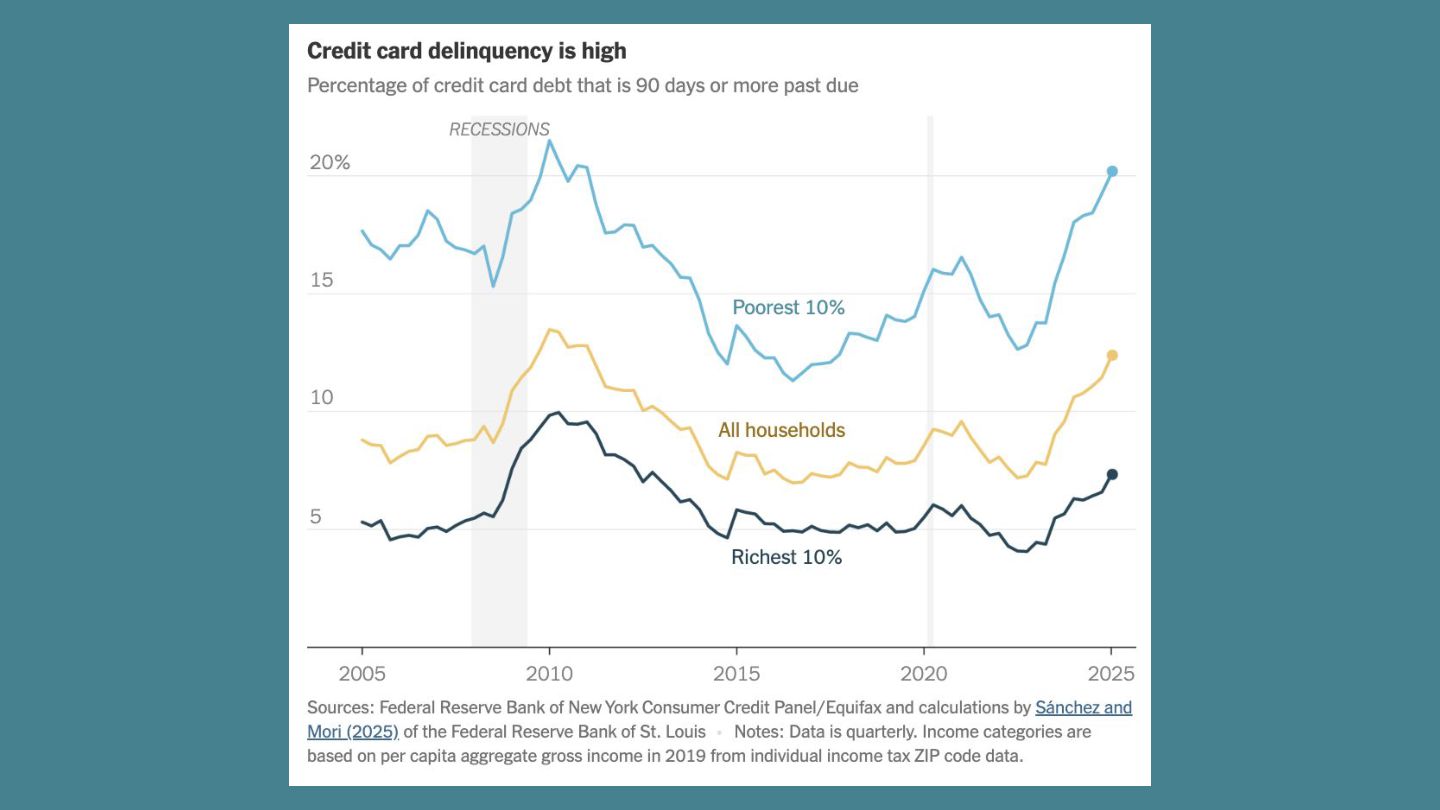
* https://www.stlouisfed.org/on-the-economy/2025/may/broad-continuing-rise-delinquent-us-credit-card-debt-revisited
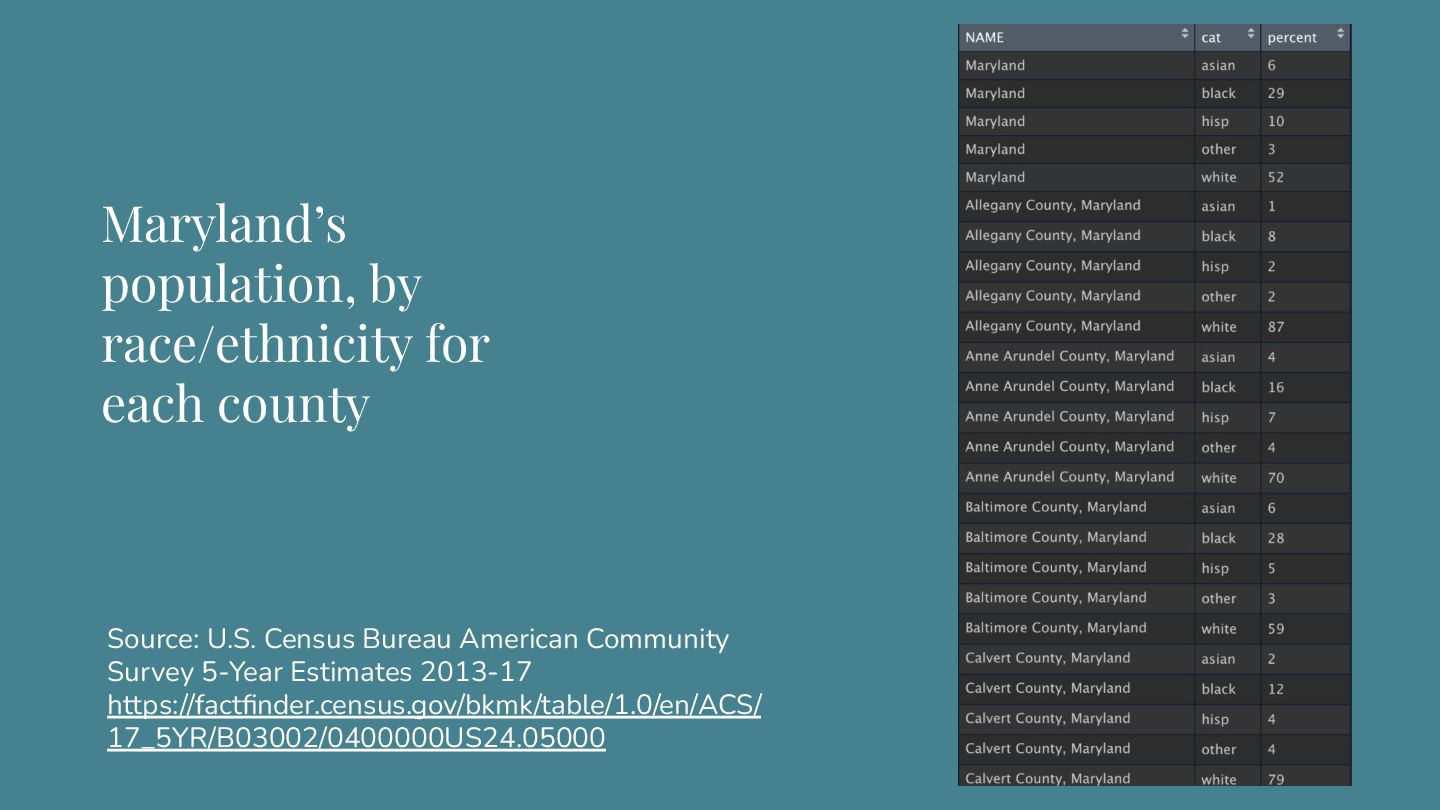
* https://factfinder.census.gov/bkmk/table/1.0/en/ACS/17_5YR/B03002/0400000US24.05000
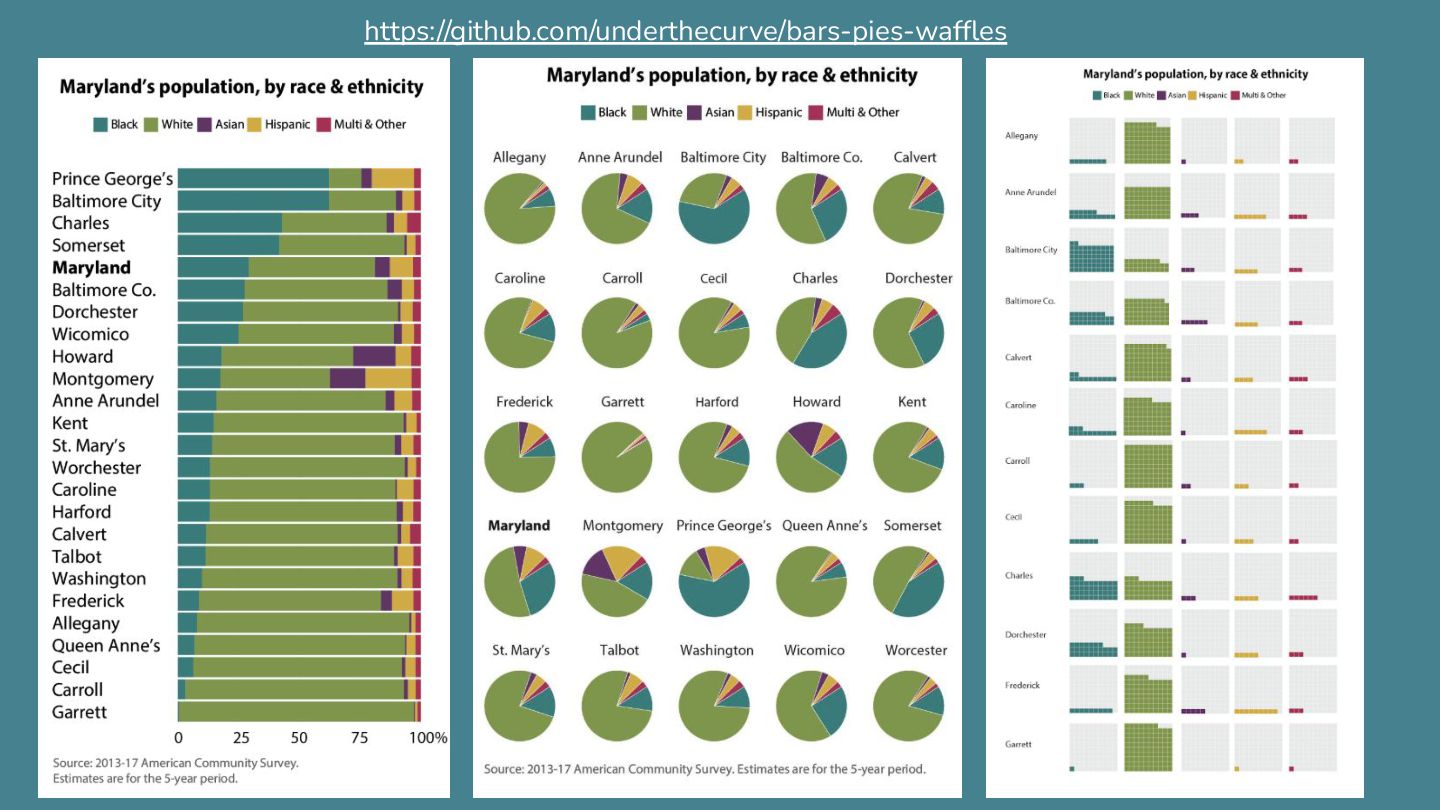
* https://github.com/underthecurve/bars-pies-waffles
Other recommended resources by Christine:
* https://learn.r-journalism.com/en/