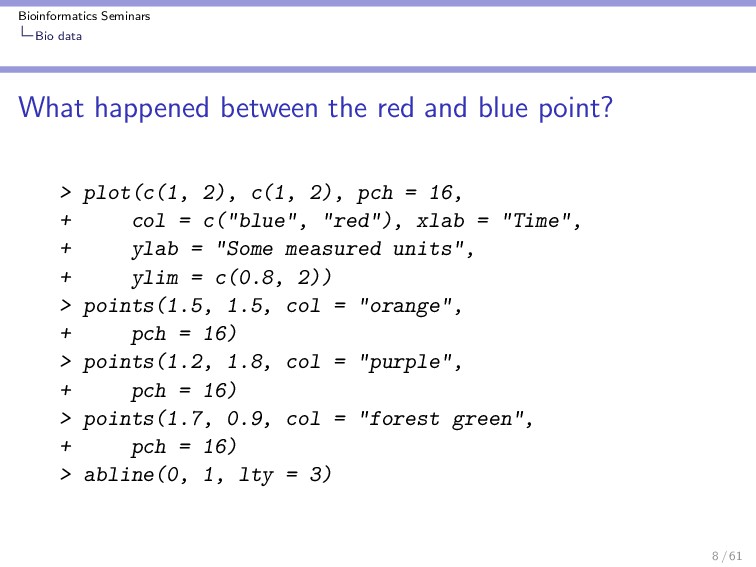
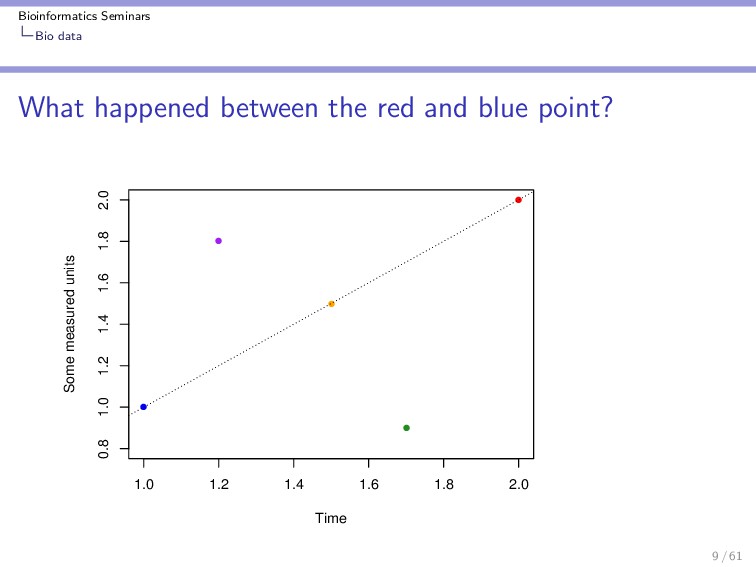
on Genomic Sciences, you are definitely interested in Biology. Well, I hope so! So, what is Biology? It’s the study of living beings, right? So, how do we study? You are already part of academia as an undergrad student. Your voice counts and we’d love to listen to your ideas. If you think that you are not in academia, well at least laugh at http://sotak.info/sci.jpg 3 / 61
Wikipedia: Scientific method refers to a body of techniques for investigating phenomena, acquiring new knowledge, or correcting and integrating previous knowledge. To be termed scientific, a method of inquiry must be based on gathering empirical and measurable evidence subject to specific principles of reasoning. The Oxford English Dictionary says that scientific method is: a method of procedure that has characterized natural science since the 17th century, consisting in systematic observation, measurement, and experiment, and the formulation, testing, and modification of hypotheses. 4 / 61
date? In a way, yes it’s old. You don’t have to formulate a hyphotesis before exploring the data. For a more complete phylosophical discussion look at the paper by Glass and Hall 2008, Cell. An interesting book is The Grand Design by Stephen Hawking and Leonard Mlodinow. 5 / 61
will surely be interested in the new development of medicines thanks to our understanding of Immunology. You like animals and/or microbes and/or plants and you think that studying their genome will allow us to understand them better? Because it’s new? Sounds fancy? My case: I liked math and computing, and biology was going to provide me with the interesting and complicated problems to solve using math and computers. Anyhow, you’ll notice that Genomics is just a big name and you can pretty much major in any hard-science of your choice: biochem, molecular bio, biocomputing, . . . biostatistics? 6 / 61
that we are studying something of your interest and we observe the object at time 1 and at time 2. Can you tell me what happened between time 1 and 2? 7 / 61
much of what happened in between. One solution? More data! More observations! Why we didn’t do it before? Technological limitations (some existed but were hella expensive). That’s why Biology (and many other areas including your social network) has gone high-throughput! Note that it does not depend on whether what you are studying is discrete or continuous. 10 / 61
everywhere. Your PCRs Brain imaging Genomics, proteomics, . . . Why? Biology: not all cells have the same number of molecules. Bias: technological, who is measuring, etc Artifacts 11 / 61
fun to play with data :) Datasets are huge! Unless you can tell me that you can read the human genome in a couple seconds. I’ll even give you 5 minutes! You need the tools 1 to actually explore the data in a sensible way. Of course, you can always team up with a Biostatistician and have him analyze your data. Though, LCG is an interdisciplinary program so you should at least be able to speak the same language. 1Biostatistical methods. 12 / 61
values from a Normal distribution with mean 0 and standard deviation 4. Plot the 10 thousand values. What is the mean of the 10 thousand values? 13 / 61
example and the mean is not that hard to get, but that’s the starting point. Imagine analyzing 200 million short-sequences on the 3.2 gb human genome. 17 / 61
person and just thinking about integrals gives me headaches . . . So, I’ll collaborate with a Biostatistician and problem solved :) Hm, ok. At least understand the language. After all, a Bio-statistician also understands (or should) the biological language. Ok. I know what a P-value is so I’m good, right? 18 / 61
that I observe a value more extreme than the one I’m observing under the distribution from my data. So, what’s the P-value of observing a value greater than 2 in a standard Normal distribution 2 ? Now, what’s the P-value of observing a value more extreme than |2| in a standard Normal dist? Note that a Normal distribution is symmetric :) 2Standard Normal dist has mean 0 and standard deviation 1. 19 / 61
here to tell you that you need to know more than what a P-value is. First of all, there are 3 schools in Biostatistics: frequentism, likelihood-based and Bayesian. 23 / 61
the frequency that we observe an event tells us it’s probability. In statistical inference (when we observe some data and want to estimate the dist parameters), we imagine that we repeated the experiment many many times such that we can extrapolate from our single experiment and estimate the parameters of the underlying distribution. The practice of using un-observed data sounds fishy! 24 / 61
distribution informs of the most likely value for the parameters of the distribution. Doesn’t make bold statements with un-observed data but then again, it only tells us the basic information of the parameters. 25 / 61
the concept of conditional probability: P(A|B) = P(A ∩ B) P(B) P(B|A) = P(A ∩ B) P(A) P(A|B) = P(B|A)P(A) P(B) The idea is that you believe that your parameter has a given distribution (a priori) and you’ll update your beliefs with what you observed from your data giving you the posterior distribution. 26 / 61
priori distribution? It’s subjective although you can argue in many situations that it will not affect as much the posterior distribution. This is what keeps some from going to Bayesian stats. 27 / 61
term before. For example, what is the 95% confidence interval for the mean of 1000 random values from a standard normal? > x <- rnorm(1000) > mean(x) - qnorm(0.975) * sd(x)/sqrt(1000) [1] 9.491511e-05 > mean(x) + qnorm(0.975) * sd(x)/sqrt(1000) [1] 0.1212455 Can you tell me what is the probability that the mean of the underlying distribution is inside the 95% confidence interval? If you do, Ale and Carlos will give you full grades for the semester! 28 / 61
(frequentist) interval we constructed does not tell us anything about the probability that the true parameter is contained in the interval. From the frequentist approach, it is basically telling us that if we were to repeat the experiment many many many many times, 95% of the times the mean (or whatever statistic we are interested in) will be inside the interval. 30 / 61
probability that the mean is inside the 95% CI is either 0 or 1. Which one is it? We cannot know. A bayesian credible interval does tell us the probability that the parameter is inside the interval. But remember that this is based on our a priori beliefs. 31 / 61
can see, the three schools of Statistics have their pro’s and con’s and you’ll eventually have to choose which one you like. There are tricky ways, like using Bayesian statistics to construct methods but use them in a Frequentist setting. 32 / 61
to understand the Statistical language, you’ll need to review your math before. Calculus (derivation, integration, change of variables), linear algebra, Real Analysis, are helpful. You don’t have to get too deep if you don’t want to, but at least take a course in statistics and another one in probability :) 33 / 61
my data set? Thanks to the Central Limit Theorem, many (large) data sets are analyzable using the Normal distribution and associated methods. What is the CLT? Well, for n randomly sampled values from Xi identically distributed random variables with mean µ and variance σ2, ¯ X = Xi /n is distributed as a N(µ, σ2/n). However, in this high-throughput biological world new methods are needed. The goal is to keep things simple! If you like the idea consider studying a masters or PhD in Biostats! 34 / 61
be random uniform distributions from 0 to 1. As you can see in http://en.wikipedia.org/wiki/ Uniform_distribution_(continuous) the mean of each Xi will be µ = 0.5 and the variance is σ2 = 1/12. Next, we will get 10 random values from each Xi and do this 1,000 times. Then, we’ll calculate the mean for each of the 1,000 Xi . Finally, we’ll plot the distribution of ¯ X and compare it to the theoretical distribution of a Normal distribution with mean µ and variance σ2/n. 35 / 61
Windows, Mac, Linux/Unix. Easily to customize and expand, specially with packages Fairly straightforward to reproduce results. After all, in academia and enterprises we seek reproducibility. 38 / 61
I hear about R before? In high-school you probably didn’t need anything more than Excel. Note that Excel is not great with large datasets and has limited analysis tools. The learning curve for R can be steep. However, I’m confident that more people are using R! It’s already a requirement in many jobs in the bioinformatics field. 39 / 61
of biologically-related R packages which are required to be well documented including a pdf file explaining how to link the functions and what they do (this is the vignette). Other repositories: CRAN, Rforge. There you’ll find nice infraestructure tools to manage your high-throughput data, new methods to analyze it, and interesting ways to visualize it! Again, it’s free to use. 40 / 61
L A TEXand the final product is a nice pdf file with text, the code, and the output from R. Stangle 4 creates R files so others don’t have to type the code or extract it from the pdf file. If you run the same code on any computer using the same version of R (and packages), you will produce the same results :) 3Rnw extension 4R extension: a simple R code file 41 / 61
to do? The key plotting functions in R are: plot: great for plotting x-values vs y-values hist: short for histogram boxplot: useful for large (n > 25 or more) data sets qqplot: what is this? It will help you compare the quantiles of your data set vs a given distribution. qqnorm is a special case. points, lines, abline and legend Also take a look at this site for Producing simple graphs with R: http://www.harding.edu/fmccown/R/ 44 / 61
interact with R Native R in terminal. It’s ok for some quick tests, but not for writing code. R GUI? Not something you will want to stick too. It doesn’t have any text markup, and is not good for writing Rnw files. Emacs Shortcuts are not easy to learn, but it’s nice to have your code and R in the same program. It’s also works as a text markup for other languages including L A TEX. I personally use Aquamacs (an Emacs version) on my Mac, but GNU Emacs and XEmacs are good distributions. The last 2 work in Windows, Mac, Linux. 55 / 61
interact with R Notepad++ With the R plugin it’s very easy to use. Only works in Windows though. You’ll be using a text markup notepad and the R GUI. RStudio Seems interesting. Look at this post. 56 / 61
new thing in R? BioC? etc It’s not easy to stay updated manually. One way is to read the posts you find interesting from R-bloggers: http://www.r-bloggers.com/ A very interesting blog in my opinion is SimplyStatistics: http://simplystatistics.tumblr.com/ For visualizing data, the R Gallery provides very neat plots made with R: http://addictedtor.free.fr/graphiques/ Mailing lists are an option too, like the Bioconductor one and the BioC-hts. But it’s harder to follow. 57 / 61
in many aspects of life, we want to be efficient with our time. One way to read blogs easily is using Google Reader: http://www.google.com/reader/ You won’t have to remember to get into a specific site and you can quickly skim through new posts. You can add your favorite comics like www.phdcomics.com or more misc ones like Salmoblog and Ciencia Explicada 58 / 61
Ever heard of CVS? Mercurial, git, svn are version control systems. Highly useful for simple text files like R code. Great for any coding project you’ll do. Specially when collaborating with others :) I recommend Mercurial because it’s easy and Bitbucket offers unlimited space to those of us in academia. 5 5Bitbucket also works with git nowadays. 59 / 61
Biostatistics to analyze data in our modern study of Biology. Understanding some biostats and being able to use R allows you to perform analysis on your own data. Starting by the more common EDA. Spend some time setting up your R interface and find an efficient way to stay updated in R (and/or anything of your choice!). Bioinformaticians need a toolbox that they easily use :) R is free, highly used and highly reproducible, why not start with it? 60 / 61