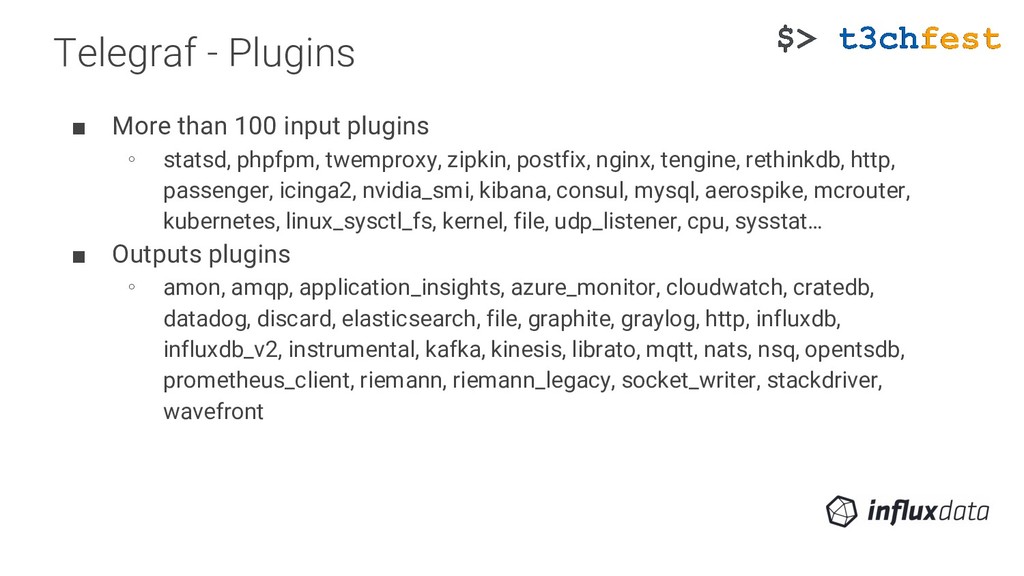
statsd, phpfpm, twemproxy, zipkin, postfix, nginx, tengine, rethinkdb, http, passenger, icinga2, nvidia_smi, kibana, consul, mysql, aerospike, mcrouter, kubernetes, linux_sysctl_fs, kernel, file, udp_listener, cpu, sysstat… ▪ Outputs plugins ∘ amon, amqp, application_insights, azure_monitor, cloudwatch, cratedb, datadog, discard, elasticsearch, file, graphite, graylog, http, influxdb, influxdb_v2, instrumental, kafka, kinesis, librato, mqtt, nats, nsq, opentsdb, prometheus_client, riemann, riemann_legacy, socket_writer, stackdriver, wavefront
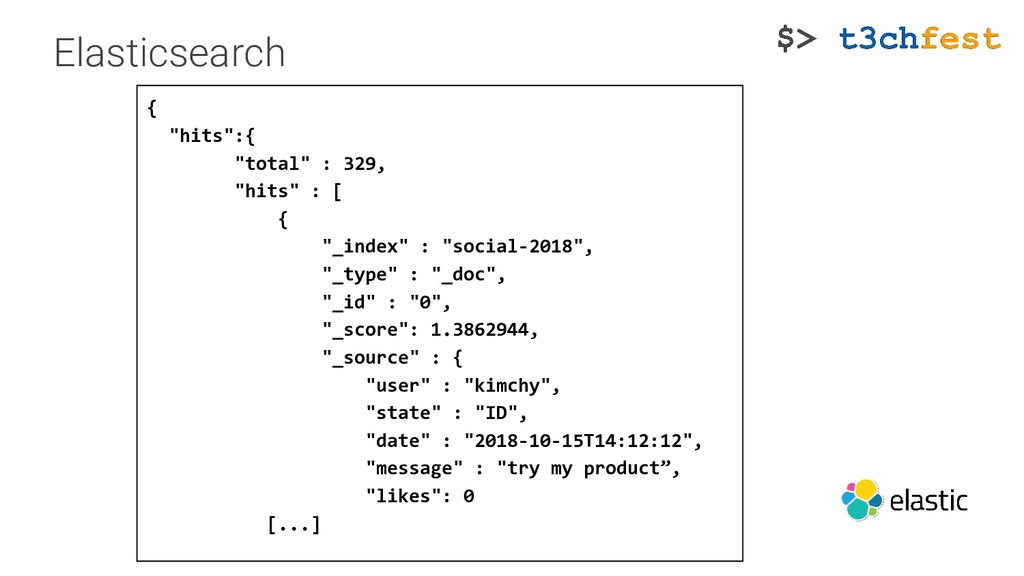
![Elasticsearch { [...] "aggregations" : { "top_10_states" : { "buckets"](https://files.speakerdeck.com/presentations/eb53ae13e73c4f1ca2c298379e2db7b3/slide_6.jpg)
![Logstash - Outputs output { elasticsearch { hosts => ["localhost:9200"]](https://files.speakerdeck.com/presentations/eb53ae13e73c4f1ca2c298379e2db7b3/slide_15.jpg)
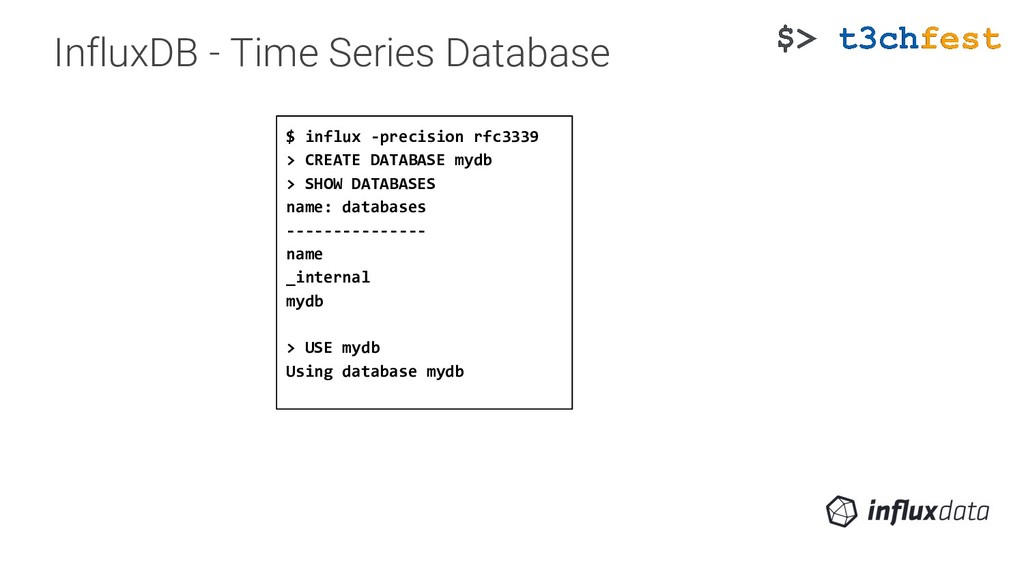
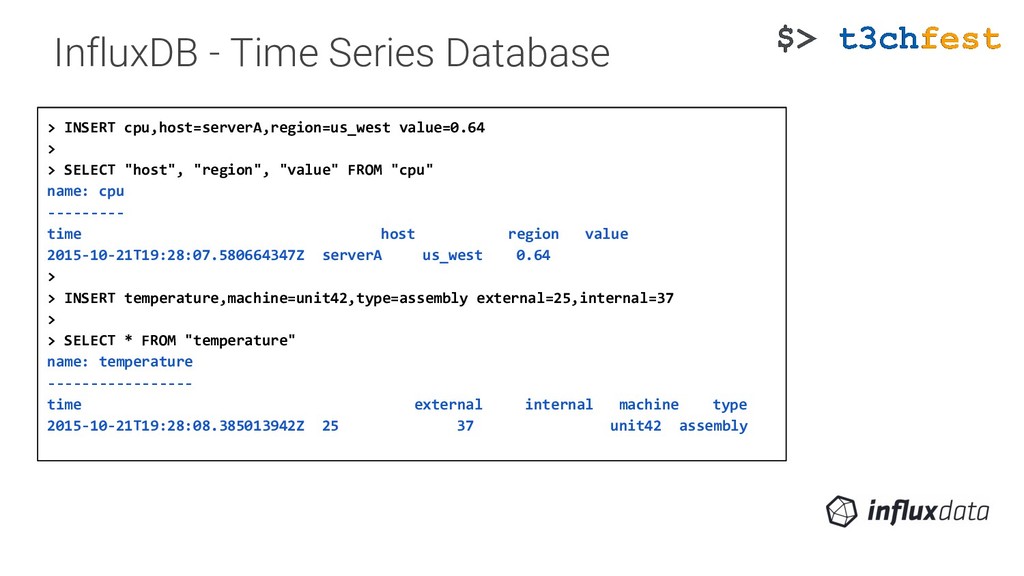
![InfluxDB - Time Series Database <measurement>[,<tag-key>=<tag-value>...] <field-key>=<field-value>[,<field2-key>=<field2-value>...] [unix-nano-timestamp] cpu,host=serverA,region=us_west value=0.64](https://files.speakerdeck.com/presentations/eb53ae13e73c4f1ca2c298379e2db7b3/slide_21.jpg)
![<measurement>[,<tag-key>=<tag-value>...] <field-key>=<field-value>[,<field2-key>=<field2-value>...] [unix-nano-timestamp] cpu,host=serverA,region=us_west value=0.64 payment,device=mobile,product=Notepad,method=credit billed=33,licenses=3i 1434067467100293230 stock,symbol=AAPL bid=127.46,ask=127.48](https://files.speakerdeck.com/presentations/eb53ae13e73c4f1ca2c298379e2db7b3/slide_22.jpg)
![<measurement>[,<tag-key>=<tag-value>...] <field-key>=<field-value>[,<field2-key>=<field2-value>...] [unix-nano-timestamp] cpu,host=serverA,region=us_west value=0.64 payment,device=mobile,product=Notepad,method=credit billed=33,licenses=3i 1434067467100293230 stock,symbol=AAPL bid=127.46,ask=127.48](https://files.speakerdeck.com/presentations/eb53ae13e73c4f1ca2c298379e2db7b3/slide_23.jpg)
![<measurement>[,<tag-key>=<tag-value>...] <field-key>=<field-value>[,<field2-key>=<field2-value>...] [unix-nano-timestamp] cpu,host=serverA,region=us_west value=0.64 payment,device=mobile,product=Notepad,method=credit billed=33,licenses=3i 1434067467100293230 stock,symbol=AAPL bid=127.46,ask=127.48](https://files.speakerdeck.com/presentations/eb53ae13e73c4f1ca2c298379e2db7b3/slide_24.jpg)
![<measurement>[,<tag-key>=<tag-value>...] <field-key>=<field-value>[,<field2-key>=<field2-value>...] [unix-nano-timestamp] cpu,host=serverA,region=us_west value=0.64 payment,device=mobile,product=Notepad,method=credit billed=33,licenses=3i 1434067467100293230 stock,symbol=AAPL bid=127.46,ask=127.48](https://files.speakerdeck.com/presentations/eb53ae13e73c4f1ca2c298379e2db7b3/slide_25.jpg)
![Queries (PromQL) http_requests_total{environment=~"staging|development",method!="GET"} http_requests_total offset 5m http_requests_total{job="prometheus"}[5m] rate(http_requests_total{job="api-server"}[5m]) topk(5, http_requests_total)](https://files.speakerdeck.com/presentations/eb53ae13e73c4f1ca2c298379e2db7b3/slide_61.jpg)