Upgrade to Pro — share decks privately, control downloads, hide ads and more …

02 Online Evaluation

LiLa'16
March 20, 2016

02 Online Evaluation

LiLa'16

March 20, 2016
Tweet

More Decks by LiLa'16

Other Decks in Research

Transcript

  1. Anne Schuth (Blendle / University of Amsterdam, The Netherlands) Krisztian

    Balog (University of Stavanger, Norway) Tutorial at ECIR 2016 in Padua, Italy Online Evaluation
  2. Why not compare with historical data? Here’s  an  example  of

     Kindle  Sales  over  time. You changed the site, and there was an amazing spike Amazon Kindle Sales Website A Website B Kohavi, R. (2013). Online Controlled Experiments. SIGIR ’13.
  3. Why not compare with historical data? Here’s  an  example  of

     Kindle  Sales  over  time. You changed the site, and there was an amazing spike Amazon Kindle Sales Website A Website B Kohavi, R. (2013). Online Controlled Experiments. SIGIR ’13. What could explain this spike?
  4. In  this  example  of  an  A/B  test,  you’d  be  better

     off  with  version  A In controlled experiments, both versions are impacted the same way by external events Amazon Kindle Sales Website A Website B Oprah calls Kindle "her new favorite thing" Kohavi, R. (2013). Online Controlled Experiments. SIGIR ’13.
  5. Example: Rich Result Summarization Idea: Users like to know how

    dishes look like for recipes. Let’s  generate  nicer  captions  by   including an image. 22 Feature-specific metric: • Short-dwell click rate Î improves! - Î Good feature!? More generalizable metrics: • Whole page click- through rate • #queries per session … Î regression? Challenge: Design feature-specific metrics in a way that they are aligned with overall goodness. Buscher, G. (2013). IR Evaluation: Perspectives From Within a Living Lab.
  6. Example: Rich Result Summarization Idea: Users like to know how

    dishes look like for recipes. Let’s  generate  nicer  captions  by   including an image. 22 Feature-specific metric: • Short-dwell click rate Î improves! - Î Good feature!? More generalizable metrics: • Whole page click- through rate • #queries per session … Î regression? Challenge: Design feature-specific metrics in a way that they are aligned with overall goodness. Buscher, G. (2013). IR Evaluation: Perspectives From Within a Living Lab.
  7. Example: Rich Result Summarization Idea: Users like to know how

    dishes look like for recipes. Let’s  generate  nicer  captions  by   including an image. 22 Feature-specific metric: • Short-dwell click rate Î improves! - Î Good feature!? More generalizable metrics: • Whole page click- through rate • #queries per session … Î regression? Challenge: Design feature-specific metrics in a way that they are aligned with overall goodness. Buscher, G. (2013). IR Evaluation: Perspectives From Within a Living Lab.
  8. Example: Rich Result Summarization Idea: Users like to know how

    dishes look like for recipes. Let’s  generate  nicer  captions  by   including an image. 22 Feature-specific metric: • Short-dwell click rate Î improves! - Î Good feature!? More generalizable metrics: • Whole page click- through rate • #queries per session … Î regression? Challenge: Design feature-specific metrics in a way that they are aligned with overall goodness. Buscher, G. (2013). IR Evaluation: Perspectives From Within a Living Lab. What could have happened?
  9. Example: Rich Result Summarization Idea: Users like to know how

    dishes look like for recipes. Let’s  generate  nicer  captions  by   including an image. 22 Feature-specific metric: • Short-dwell click rate Î improves! - Î Good feature!? More generalizable metrics: • Whole page click- through rate • #queries per session … Î regression? Challenge: Design feature-specific metrics in a way that they are aligned with overall goodness. Buscher, G. (2013). IR Evaluation: Perspectives From Within a Living Lab.
  10. Example: Rich Result Summarization Idea: Users like to know how

    dishes look like for recipes. Let’s  generate  nicer  captions  by   including an image. 22 Feature-specific metric: • Short-dwell click rate Î improves! - Î Good feature!? More generalizable metrics: • Whole page click- through rate • #queries per session … Î regression? Challenge: Design feature-specific metrics in a way that they are aligned with overall goodness. Buscher, G. (2013). IR Evaluation: Perspectives From Within a Living Lab.
  11. Example: Rich Result Summarization Idea: Users like to know how

    dishes look like for recipes. Let’s  generate  nicer  captions  by   including an image. 22 Feature-specific metric: • Short-dwell click rate Î improves! - Î Good feature!? More generalizable metrics: • Whole page click- through rate • #queries per session … Î regression? Challenge: Design feature-specific metrics in a way that they are aligned with overall goodness. Buscher, G. (2013). IR Evaluation: Perspectives From Within a Living Lab.
  12. Example: Rich Result Summarization Idea: Users like to know how

    dishes look like for recipes. Let’s  generate  nicer  captions  by   including an image. 22 Feature-specific metric: • Short-dwell click rate Î improves! - Î Good feature!? More generalizable metrics: • Whole page click- through rate • #queries per session … Î regression? Challenge: Design feature-specific metrics in a way that they are aligned with overall goodness. Buscher, G. (2013). IR Evaluation: Perspectives From Within a Living Lab.
  13. Outline • Online vs Offline Evaluation • Observable User Behavior

    • A/B testing & Online measures • A/B testing • Online measures • Interleaving
  14. Why online evaluation? • The Cranfield/TREC/Offline evaluation approach is a

    good idea when • Query set is representative of cases that the research tries to address
  15. Why online evaluation? • The Cranfield/TREC/Offline evaluation approach is a

    good idea when • Query set is representative of cases that the research tries to address • Judges can give accurate judgments in the setting in which you are interested
  16. Why online evaluation? • The Cranfield/TREC/Offline evaluation approach is a

    good idea when • Query set is representative of cases that the research tries to address • Judges can give accurate judgments in the setting in which you are interested • You trust a particular summary value (e.g., MAP, NDCG, ERR) to accurately reflect your users’ perceptions
  17. Why online evaluation? • The Cranfield/TREC/Offline evaluation approach is a

    good idea when • Query set is representative of cases that the research tries to address • Judges can give accurate judgments in the setting in which you are interested • You trust a particular summary value (e.g., MAP, NDCG, ERR) to accurately reflect your users’ perceptions • If these aren’t the case:
  18. Why online evaluation? • The Cranfield/TREC/Offline evaluation approach is a

    good idea when • Query set is representative of cases that the research tries to address • Judges can give accurate judgments in the setting in which you are interested • You trust a particular summary value (e.g., MAP, NDCG, ERR) to accurately reflect your users’ perceptions • If these aren’t the case: • Even if your approach is valid, the measure might not go up
  19. Why online evaluation? • The Cranfield/TREC/Offline evaluation approach is a

    good idea when • Query set is representative of cases that the research tries to address • Judges can give accurate judgments in the setting in which you are interested • You trust a particular summary value (e.g., MAP, NDCG, ERR) to accurately reflect your users’ perceptions • If these aren’t the case: • Even if your approach is valid, the measure might not go up • Or worse: The number might go up despite your approach producing worse rankings in practice
  20. Offline Challenges • Do users and judges agree on relevance?

    • Particularly difficult for personalized search
  21. Offline Challenges • Do users and judges agree on relevance?

    • Particularly difficult for personalized search • Particularly difficult for specialized documents
  22. Offline Challenges • Do users and judges agree on relevance?

    • Particularly difficult for personalized search • Particularly difficult for specialized documents • Particularly difficult for ambiguous queries
  23. Offline Challenges • Do users and judges agree on relevance?

    • Particularly difficult for personalized search • Particularly difficult for specialized documents • Particularly difficult for ambiguous queries • Judges need to correctly appreciate uncertainty
  24. Offline Challenges • Do users and judges agree on relevance?

    • Particularly difficult for personalized search • Particularly difficult for specialized documents • Particularly difficult for ambiguous queries • Judges need to correctly appreciate uncertainty • If you want to diversify web results to satisfy multiple intents, how do judges know what is most likely to be relevant?
  25. Offline Challenges • Do users and judges agree on relevance?

    • Particularly difficult for personalized search • Particularly difficult for specialized documents • Particularly difficult for ambiguous queries • Judges need to correctly appreciate uncertainty • If you want to diversify web results to satisfy multiple intents, how do judges know what is most likely to be relevant? • How do you identify when relevance changes?
  26. Offline Challenges • Do users and judges agree on relevance?

    • Particularly difficult for personalized search • Particularly difficult for specialized documents • Particularly difficult for ambiguous queries • Judges need to correctly appreciate uncertainty • If you want to diversify web results to satisfy multiple intents, how do judges know what is most likely to be relevant? • How do you identify when relevance changes? • Temporal changes: Document changes; Query intent changes
  27. Offline Challenges • Do users and judges agree on relevance?

    • Particularly difficult for personalized search • Particularly difficult for specialized documents • Particularly difficult for ambiguous queries • Judges need to correctly appreciate uncertainty • If you want to diversify web results to satisfy multiple intents, how do judges know what is most likely to be relevant? • How do you identify when relevance changes? • Temporal changes: Document changes; Query intent changes • It’s expensive and slow to collect new data
  28. Offline Challenges • Do users and judges agree on relevance?

    • Particularly difficult for personalized search • Particularly difficult for specialized documents • Particularly difficult for ambiguous queries • Judges need to correctly appreciate uncertainty • If you want to diversify web results to satisfy multiple intents, how do judges know what is most likely to be relevant? • How do you identify when relevance changes? • Temporal changes: Document changes; Query intent changes • It’s expensive and slow to collect new data • Cheaper crowdsourcing is sometimes an alternative
  29. Offline Challenges • Do users and judges agree on relevance?

    • Particularly difficult for personalized search • Particularly difficult for specialized documents • Particularly difficult for ambiguous queries • Judges need to correctly appreciate uncertainty • If you want to diversify web results to satisfy multiple intents, how do judges know what is most likely to be relevant? • How do you identify when relevance changes? • Temporal changes: Document changes; Query intent changes • It’s expensive and slow to collect new data • Cheaper crowdsourcing is sometimes an alternative • Summary aggregate score must agree with users
  30. Offline Challenges • Do users and judges agree on relevance?

    • Particularly difficult for personalized search • Particularly difficult for specialized documents • Particularly difficult for ambiguous queries • Judges need to correctly appreciate uncertainty • If you want to diversify web results to satisfy multiple intents, how do judges know what is most likely to be relevant? • How do you identify when relevance changes? • Temporal changes: Document changes; Query intent changes • It’s expensive and slow to collect new data • Cheaper crowdsourcing is sometimes an alternative • Summary aggregate score must agree with users • Do real users agree with MAP@1000? NDCG@5? ERR?
  31. Users • Offline evaluation and the Cranfield paradigm are incredibly

    powerful • But, only an abstraction of the real world
  32. Users • Offline evaluation and the Cranfield paradigm are incredibly

    powerful • But, only an abstraction of the real world • How do users start a search? How do they proceed through it?
  33. Users • Offline evaluation and the Cranfield paradigm are incredibly

    powerful • But, only an abstraction of the real world • How do users start a search? How do they proceed through it? • Do differences we see in test collection experiments translate into more successful users?
  34. Users • Offline evaluation and the Cranfield paradigm are incredibly

    powerful • But, only an abstraction of the real world • How do users start a search? How do they proceed through it? • Do differences we see in test collection experiments translate into more successful users? • What gain is needed in the lab to see a corresponding gain for the user?
  35. Users • Offline evaluation and the Cranfield paradigm are incredibly

    powerful • But, only an abstraction of the real world • How do users start a search? How do they proceed through it? • Do differences we see in test collection experiments translate into more successful users? • What gain is needed in the lab to see a corresponding gain for the user? • What level of effectiveness is “good enough” for the task?
  36. User Centered Evaluation • Key assumption: observable user behavior reflects

    relevance • Implicit in this: Users behave (somewhat) rationally
  37. User Centered Evaluation • Key assumption: observable user behavior reflects

    relevance • Implicit in this: Users behave (somewhat) rationally • Real users have a goal when they use an IR system
  38. User Centered Evaluation • Key assumption: observable user behavior reflects

    relevance • Implicit in this: Users behave (somewhat) rationally • Real users have a goal when they use an IR system • They aren’t just bored, typing and clicking pseudo-randomly
  39. User Centered Evaluation • Key assumption: observable user behavior reflects

    relevance • Implicit in this: Users behave (somewhat) rationally • Real users have a goal when they use an IR system • They aren’t just bored, typing and clicking pseudo-randomly • They consistently work towards that goal
  40. User Centered Evaluation • Key assumption: observable user behavior reflects

    relevance • Implicit in this: Users behave (somewhat) rationally • Real users have a goal when they use an IR system • They aren’t just bored, typing and clicking pseudo-randomly • They consistently work towards that goal • A non-relevant result doesn’t draw most users away from their goal
  41. User Centered Evaluation • Key assumption: observable user behavior reflects

    relevance • Implicit in this: Users behave (somewhat) rationally • Real users have a goal when they use an IR system • They aren’t just bored, typing and clicking pseudo-randomly • They consistently work towards that goal • A non-relevant result doesn’t draw most users away from their goal • They aren’t trying to confuse you
  42. User Centered Evaluation • Key assumption: observable user behavior reflects

    relevance • Implicit in this: Users behave (somewhat) rationally • Real users have a goal when they use an IR system • They aren’t just bored, typing and clicking pseudo-randomly • They consistently work towards that goal • A non-relevant result doesn’t draw most users away from their goal • They aren’t trying to confuse you • Most users are not trying to provide malicious data to the system
  43. Online evaluation in 2 slides • See how normal users

    interact with your live retrieval system when just using it
  44. Online evaluation in 2 slides • See how normal users

    interact with your live retrieval system when just using it • Observe implicit behavior
  45. Online evaluation in 2 slides • See how normal users

    interact with your live retrieval system when just using it • Observe implicit behavior • Clicks, skips, saves, forwards, bookmarks, “likes”, etc.
  46. Online evaluation in 2 slides • See how normal users

    interact with your live retrieval system when just using it • Observe implicit behavior • Clicks, skips, saves, forwards, bookmarks, “likes”, etc. • Try to infer differences in behavior from different flavors of the live system
  47. Online evaluation in 2 slides • See how normal users

    interact with your live retrieval system when just using it • Observe implicit behavior • Clicks, skips, saves, forwards, bookmarks, “likes”, etc. • Try to infer differences in behavior from different flavors of the live system • A/B testing
  48. Online evaluation in 2 slides • See how normal users

    interact with your live retrieval system when just using it • Observe implicit behavior • Clicks, skips, saves, forwards, bookmarks, “likes”, etc. • Try to infer differences in behavior from different flavors of the live system • A/B testing • Have x% of query traffic use system A and y% of query traffic use system B
  49. Online evaluation in 2 slides • See how normal users

    interact with your live retrieval system when just using it • Observe implicit behavior • Clicks, skips, saves, forwards, bookmarks, “likes”, etc. • Try to infer differences in behavior from different flavors of the live system • A/B testing • Have x% of query traffic use system A and y% of query traffic use system B • Interleaving
  50. Online evaluation in 2 slides • See how normal users

    interact with your live retrieval system when just using it • Observe implicit behavior • Clicks, skips, saves, forwards, bookmarks, “likes”, etc. • Try to infer differences in behavior from different flavors of the live system • A/B testing • Have x% of query traffic use system A and y% of query traffic use system B • Interleaving • Expose a combination of system versions to users
  51. Online evaluation in 2 slides • Advantages • no need

    for (expensive) dataset creation • system usage is natural; users are situated in their natural context and often don’t even know that a test is being conducted
  52. Online evaluation in 2 slides • Advantages • no need

    for (expensive) dataset creation • system usage is natural; users are situated in their natural context and often don’t even know that a test is being conducted • evaluation can include lots of users
  53. Online evaluation in 2 slides • Advantages • no need

    for (expensive) dataset creation • system usage is natural; users are situated in their natural context and often don’t even know that a test is being conducted • evaluation can include lots of users • Disadvantages
  54. Online evaluation in 2 slides • Advantages • no need

    for (expensive) dataset creation • system usage is natural; users are situated in their natural context and often don’t even know that a test is being conducted • evaluation can include lots of users • Disadvantages • requires a service with lots of users (enough of them to potential hurt performance for some)
  55. Online evaluation in 2 slides • Advantages • no need

    for (expensive) dataset creation • system usage is natural; users are situated in their natural context and often don’t even know that a test is being conducted • evaluation can include lots of users • Disadvantages • requires a service with lots of users (enough of them to potential hurt performance for some) • requires a good understanding on how different implicit feedback signals predict positive and negative user experiences
  56. Online evaluation in 2 slides • Advantages • no need

    for (expensive) dataset creation • system usage is natural; users are situated in their natural context and often don’t even know that a test is being conducted • evaluation can include lots of users • Disadvantages • requires a service with lots of users (enough of them to potential hurt performance for some) • requires a good understanding on how different implicit feedback signals predict positive and negative user experiences • experiments are difficult to repeat
  57. Offline vs Online Evaluation • Basic assumptions: • Offline: •

    assessors can tell you what is relevant • Online:
  58. Offline vs Online Evaluation • Basic assumptions: • Offline: •

    assessors can tell you what is relevant • Online: • observable user behavior can tell you what is relevant
  59. Outline • Online vs Offline Evaluation • Observable User Behavior

    • A/B testing & Online measures • A/B testing • Online measures • Interleaving
  60. 14 • Clicks Search Engine Result Page (SERP) What other

    signals can you think of? Different types of user signals (1)
  61. 14 • Clicks • Mouse movement Search Engine Result Page

    (SERP) Different types of user signals (1)
  62. 14 • Clicks • Mouse movement • Browser action bookmark,

    save, print Search Engine Result Page (SERP) Different types of user signals (1)
  63. 14 • Clicks • Mouse movement • Browser action bookmark,

    save, print • Time dwell time, time on SERP Search Engine Result Page (SERP) Different types of user signals (1)
  64. 14 • Clicks • Mouse movement • Browser action bookmark,

    save, print • Time dwell time, time on SERP • Explicit judgment likes, favourites.. Search Engine Result Page (SERP) Different types of user signals (1)
  65. 14 • Clicks • Mouse movement • Browser action bookmark,

    save, print • Time dwell time, time on SERP • Explicit judgment likes, favourites.. • Other page elements share, … Search Engine Result Page (SERP) Different types of user signals (1)
  66. 14 • Clicks • Mouse movement • Browser action bookmark,

    save, print • Time dwell time, time on SERP • Explicit judgment likes, favourites.. • Other page elements share, … • Long term effects sessions per user, abandonment, … Search Engine Result Page (SERP) Different types of user signals (1)
  67. 14 • Clicks • Mouse movement • Browser action bookmark,

    save, print • Time dwell time, time on SERP • Explicit judgment likes, favourites.. • Other page elements share, … • Long term effects sessions per user, abandonment, … • Reformulations Search Engine Result Page (SERP) Different types of user signals (1)
  68. 14 • Clicks • Mouse movement • Browser action bookmark,

    save, print • Time dwell time, time on SERP • Explicit judgment likes, favourites.. • Other page elements share, … • Long term effects sessions per user, abandonment, … • Reformulations Search Engine Result Page (SERP) Different types of user signals (1)
  69. ! Automatically generated as side product of natural user interactions

    with search engine Different types of user signals (2) 15
  70. ! Automatically generated as side product of natural user interactions

    with search engine Position URL Click 1 db-event.jpn.org/idb2013/ 1 2 db-event.jpn.org/idb2012/ 0 3 events.iadb.org › IDB Home › Events 0 4 events.iadb.org › IDB Home › Events 0 5 events.iadb.org › IDB Home › Events 1 6 events.iadb.org/ 0 7 http://blog-pfm.imf.org/pfmblog/2013/06/successful-international-pfm-workshop-for-ifmis-coordinators- at-idb.html 0 8 http://www.saludmesoamerica2015.org/en/salud-mesoamerica-2015/sm2015/sm2015-and-idb- specialists-take-part-in-washington-in-the-preparation-workshop-for-the-execution-of-the-operations, 0 9 www.guyanachronicleonline.com › News › Other News 0 10 go-jamaica.com/pressrelease/item.php?id=2293 0 Query idb Session ID f851c5af178384d12f3d Different types of user signals (2) 15
  71. ! Clicks are good… " Are these two clicks equally

    “good”? ! Non-clicks may have excuses: " Not relevant " Not examined " The snippet gave the answer Interpreting clicks
  72. ! Clicks are good… " Are these two clicks equally

    “good”? ! Non-clicks may have excuses: " Not relevant " Not examined " The snippet gave the answer Interpreting clicks
  73. Bias and Noise in Clicks ! Clicks are biased "

    users won’t click on things you didn’t show them 18
  74. Bias and Noise in Clicks ! Clicks are biased "

    users won’t click on things you didn’t show them " user are likely to click on things that appear high 18
  75. Bias and Noise in Clicks ! Clicks are biased "

    users won’t click on things you didn’t show them " user are likely to click on things that appear high " it matters how you present documents 18
  76. Bias and Noise in Clicks ! Clicks are biased "

    users won’t click on things you didn’t show them " user are likely to click on things that appear high " it matters how you present documents # snippets, images, colors, font size, grouped with other documents 18
  77. Bias and Noise in Clicks ! Clicks are biased "

    users won’t click on things you didn’t show them " user are likely to click on things that appear high " it matters how you present documents # snippets, images, colors, font size, grouped with other documents ! Clicks are noisy 18
  78. Bias and Noise in Clicks ! Clicks are biased "

    users won’t click on things you didn’t show them " user are likely to click on things that appear high " it matters how you present documents # snippets, images, colors, font size, grouped with other documents ! Clicks are noisy " they don’t always mean what you hope 18
  79. 19 Hassan, A., Shi, X., Craswell, N., & Ramsey, B.

    (2013). Beyond Clicks: Query Reformulation as a Predictor of Search Satisfaction. In CIKM ’13. ! Clicks are biased " users won’t click on things you didn’t show them " user are likely to click on things that appear high " it matters how you present documents # snippets, images, colors, font size, grouped with other documents ! Clicks are noisy " users click for many reasons Why not Just Use Clicks? greenfield, mn accident Time spent on page: 38 seconds
  80. 19 Hassan, A., Shi, X., Craswell, N., & Ramsey, B.

    (2013). Beyond Clicks: Query Reformulation as a Predictor of Search Satisfaction. In CIKM ’13. ! Clicks are biased " users won’t click on things you didn’t show them " user are likely to click on things that appear high " it matters how you present documents # snippets, images, colors, font size, grouped with other documents ! Clicks are noisy " users click for many reasons Why not Just Use Clicks? greenfield, mn accident Time spent on page: 38 seconds
  81. 19 Hassan, A., Shi, X., Craswell, N., & Ramsey, B.

    (2013). Beyond Clicks: Query Reformulation as a Predictor of Search Satisfaction. In CIKM ’13. ! Clicks are biased " users won’t click on things you didn’t show them " user are likely to click on things that appear high " it matters how you present documents # snippets, images, colors, font size, grouped with other documents ! Clicks are noisy " users click for many reasons Why not Just Use Clicks? greenfield, mn accident Time spent on page: 38 seconds
  82. ! Clicks are biased " users won’t click on things

    you didn’t show them " user are likely to click on things that appear high " it matters how you present documents # snippets, images, colors, font size, grouped with other documents ! Clicks are noisy " users click for many reasons 20 Hassan, A., Shi, X., Craswell, N., & Ramsey, B. (2013). Beyond Clicks: Query Reformulation as a Predictor of Search Satisfaction. In CIKM ’13. Why not Just Use Clicks? Session Ends greenfield, mn accident Woman dies in a fatal accident in greenfield, minnesota
  83. ! Clicks are biased " users won’t click on things

    you didn’t show them " user are likely to click on things that appear high " it matters how you present documents # snippets, images, colors, font size, grouped with other documents ! Clicks are noisy " users click for many reasons 20 Hassan, A., Shi, X., Craswell, N., & Ramsey, B. (2013). Beyond Clicks: Query Reformulation as a Predictor of Search Satisfaction. In CIKM ’13. Why not Just Use Clicks? Session Ends greenfield, mn accident Woman dies in a fatal accident in greenfield, minnesota
  84. ! Clicks are biased " users won’t click on things

    you didn’t show them " user are likely to click on things that appear high " it matters how you present documents # snippets, images, colors, font size, grouped with other documents ! Clicks are noisy " users click for many reasons 20 Hassan, A., Shi, X., Craswell, N., & Ramsey, B. (2013). Beyond Clicks: Query Reformulation as a Predictor of Search Satisfaction. In CIKM ’13. Why not Just Use Clicks? Session Ends greenfield, mn accident Woman dies in a fatal accident in greenfield, minnesota
  85. ! Clicks are biased " users won’t click on things

    you didn’t show them " user are likely to click on things that appear high " it matters how you present documents # snippets, images, colors, font size, grouped with other documents ! Clicks are noisy " users click for many reasons 21 Hassan, A., Shi, X., Craswell, N., & Ramsey, B. (2013). Beyond Clicks: Query Reformulation as a Predictor of Search Satisfaction. In CIKM ’13. Why not Just Use Clicks? • User performed this search on July 1st • User was probably looking for
  86. ! Clicks are biased " users won’t click on things

    you didn’t show them " user are likely to click on things that appear high " it matters how you present documents # snippets, images, colors, font size, grouped with other documents ! Clicks are noisy " users click for many reasons 22 Hassan, A., Shi, X., Craswell, N., & Ramsey, B. (2013). Beyond Clicks: Query Reformulation as a Predictor of Search Satisfaction. In CIKM ’13. Why not Just Use Clicks? Query Click Query • User clicked on a result • The dwell time is long • But, user was not satsified Clicks do not always mean satisfaction
  87. Bias and Noise in Clicks ! Clicks are biased "

    users won’t click on things you didn’t show them " user are likely to click on things that appear high " it matters how you present documents # snippets, images, colors, font size, grouped with other documents ! Clicks are noisy " they don’t always mean what you hope 23
  88. Bias and Noise in Clicks ! Clicks are biased "

    users won’t click on things you didn’t show them " user are likely to click on things that appear high " it matters how you present documents # snippets, images, colors, font size, grouped with other documents ! Clicks are noisy " they don’t always mean what you hope 23 ! Absence of clicks is not always negative " users might be satisfied due to info in snippet
  89. 24 Hassan, A., Shi, X., Craswell, N., & Ramsey, B.

    (2013). Beyond Clicks: Query Reformulation as a Predictor of Search Satisfaction. In CIKM ’13. ! Clicks are biased " users won’t click on things you didn’t show them " user are likely to click on things that appear high " it matters how you present documents # snippets, images, colors, font size, grouped with other documents ! Clicks are noisy " users click for many reasons ! Absence of clicks is not always negative " users might be satisfied due to info in snippet Why not Just Use Clicks? Lack of clicks does not always mean dissatisfaction Weather in san francisco
  90. Bias and Noise in Clicks ! Clicks are biased "

    users won’t click on things you didn’t show them " user are likely to click on things that appear high " it matters how you present documents # snippets, images, colors, font size, grouped with other documents ! Clicks are noisy " they don’t always mean what you hope ! Absence of clicks is not always negative " users might be satisfied due to info in snippet 25
  91. Bias and Noise in Clicks ! Clicks are biased "

    users won’t click on things you didn’t show them " user are likely to click on things that appear high " it matters how you present documents # snippets, images, colors, font size, grouped with other documents ! Clicks are noisy " they don’t always mean what you hope ! Absence of clicks is not always negative " users might be satisfied due to info in snippet 25 ! However: in the long run, clicks do point in the right direction
  92. Interpreting clicks 26 Absolute Relative Item level Click rate
 …

    Click-Skip
 … SERP level Abandonment
 … A/B testing, Interleaving
  93. Absolute / item level (1) ! Straightforward interpretation of clicks

    " Use click-through rate " May be biased ! Can absolute document relevance be recovered from clicks under position bias? " Examination hypothesis " Cascade model " More complex click models 27
  94. Interpreting clicks 28 Absolute Relative Item level Click rate
 …

    Click-Skip
 … SERP level Abandonment
 … A/B testing, Interleaving
  95. Interpreting clicks 28 Absolute Relative Item level Click rate
 …

    Click-Skip
 … SERP level Abandonment
 … A/B testing, Interleaving
  96. ! Joachims et al. (2002) " “Clicked > Skipped Above”

    " Preference pairs:
 #6>#2, #6>#3, #6>#4, #6>#5 " Use Rank SVM to optimize the retrieval function " Limitation: # Confidence of judgments # Little implication to user modeling Relative / item level (1)
  97. ! Joachims et al. (2002) " “Clicked > Skipped Above”

    " Preference pairs:
 #6>#2, #6>#3, #6>#4, #6>#5 " Use Rank SVM to optimize the retrieval function " Limitation: # Confidence of judgments # Little implication to user modeling Relative / item level (1)
  98. Relative / item level (2) ! Proposed interpretations of clicks

    as relative preferences " CLICK > SKIP ABOVE " LAST CLICK > SKIP ABOVE " CLICK > EARLIER CLICK " LAST CLICK > SKIP PREVIOUS " CLICK > NO-CLICK NEXT ! How accurate are they? " Compare against human 
 preference judgments 30 Joachims, 2002
  99. Interpreting clicks 31 Absolute Relative Item level Click rate
 …

    Click-Skip
 … SERP level Abandonment
 … A/B testing, Interleaving
  100. Absolute / SERP level (1) ! Document-level feedback requires converting

    judgments to evaluation metric (of a ranking) 32
  101. Absolute / SERP level (1) ! Document-level feedback requires converting

    judgments to evaluation metric (of a ranking) ! Ranking-level judgments directly define such a metric 32
  102. Absolute / SERP level (1) ! Document-level feedback requires converting

    judgments to evaluation metric (of a ranking) ! Ranking-level judgments directly define such a metric " Abandonment rate 32
  103. Absolute / SERP level (1) ! Document-level feedback requires converting

    judgments to evaluation metric (of a ranking) ! Ranking-level judgments directly define such a metric " Abandonment rate " Reformulation rate 32
  104. Absolute / SERP level (1) ! Document-level feedback requires converting

    judgments to evaluation metric (of a ranking) ! Ranking-level judgments directly define such a metric " Abandonment rate " Reformulation rate " Queries per session 32
  105. Absolute / SERP level (1) ! Document-level feedback requires converting

    judgments to evaluation metric (of a ranking) ! Ranking-level judgments directly define such a metric " Abandonment rate " Reformulation rate " Queries per session " Clicks per query 32
  106. Absolute / SERP level (1) ! Document-level feedback requires converting

    judgments to evaluation metric (of a ranking) ! Ranking-level judgments directly define such a metric " Abandonment rate " Reformulation rate " Queries per session " Clicks per query " Click rate on first result 32
  107. Absolute / SERP level (1) ! Document-level feedback requires converting

    judgments to evaluation metric (of a ranking) ! Ranking-level judgments directly define such a metric " Abandonment rate " Reformulation rate " Queries per session " Clicks per query " Click rate on first result " Max reciprocal rank 32
  108. Absolute / SERP level (1) ! Document-level feedback requires converting

    judgments to evaluation metric (of a ranking) ! Ranking-level judgments directly define such a metric " Abandonment rate " Reformulation rate " Queries per session " Clicks per query " Click rate on first result " Max reciprocal rank " Time to first click 32
  109. Absolute / SERP level (1) ! Document-level feedback requires converting

    judgments to evaluation metric (of a ranking) ! Ranking-level judgments directly define such a metric " Abandonment rate " Reformulation rate " Queries per session " Clicks per query " Click rate on first result " Max reciprocal rank " Time to first click " Time to last click 32
  110. Absolute / SERP level (1) ! Document-level feedback requires converting

    judgments to evaluation metric (of a ranking) ! Ranking-level judgments directly define such a metric " Abandonment rate " Reformulation rate " Queries per session " Clicks per query " Click rate on first result " Max reciprocal rank " Time to first click " Time to last click " Percentage of viewed documents skipped (pSkip) 32
  111. Absolute / SERP level (2) ! Benefits " Often much

    simpler than document click models " Directly measure ranking quality: Simpler task requires less data, hopefully ! Downsides " Evaluations over time need not necessarily be comparable. Need to ensure: # Done over the same user population # Performed with the same query distribution # Performed with the same document distribution 33
  112. Absolute / SERP level (2) ! Benefits " Often much

    simpler than document click models " Directly measure ranking quality: Simpler task requires less data, hopefully ! Downsides " Evaluations over time need not necessarily be comparable. Need to ensure: # Done over the same user population # Performed with the same query distribution # Performed with the same document distribution 33 Why not compare with historical data? Here’s  an  example  of  Kindle  Sales  over  time. You changed the site, and there was an amazing spike Amazon Kindle Sales Website A Website B
  113. Absolute / SERP level (3) ! (Radlinksi et al, 2008)

    ! Examine how absolute SERP level scores reflect known quality order ! Main findings " None of the absolute metrics reliably reflect expected order " Most differences not significant with thousands of queries " (These) absolute metrics not suitable uncovering quality differences in setting studied # (Depends on engines used and actual differences) 34
  114. Interpreting clicks 35 Absolute Relative Item level Click rate
 …

    Click-Skip
 … SERP level Abandonment
 … A/B testing, Interleaving
  115. Outline • Online vs Offline Evaluation • Observable User Behavior

    • A/B testing & Online measures • A/B testing • Online measures • Interleaving
  116. 37 KDD 2013 paper to appear: http://bit.ly/ExPScale We now run

    over 250 concurrent experiments at Bing We used to lockdown for Dec holidays. No more Kohavi, R. (2013). Online Controlled Experiments. SIGIR ’13.
  117. 38 Numbers below are approximate to give sense of scale

    In  a  visit,  you’re  in  about  15  experiments There is no single Bing. There are 30B variants (5^15) 90% of users are in experiments. 10% are kept as holdout Sensitivity: we need to detect small effects 0.1% change in the revenue/user metric > $1M/year Not uncommon to see unintended revenue impact of +/-1% (>$10M) Sessions/UU, a key component of our OEC, is hard to move, so we’re  looking  for  small  effects Important experiments run on 10-20% of users UI Ex p 1 Ex p 2 Ex P 3 Exp 4 Exp 5 Ads Ex P 1 Ex P 2 Ex P 3 ExP 4 Exp 5 Rele vance … …   Feature area Kohavi, R. (2013). Online Controlled Experiments. SIGIR ’13.
  118. 39 between two (or more) versions est sts
 are
 prove


    nges
 by
 n the
 A/B testing Kohavi et al, 2009
  119. A/B testing ! Concept is trivial " Randomly split traffic

    between two (or more) versions # A (Control) # B (Treatment) " Run long enough (power analysis) " Collect metrics of interest " Analyze 40 Kohavi et al, 2009
  120. A/B testing ! Concept is trivial " Randomly split traffic

    between two (or more) versions # A (Control) # B (Treatment) " Run long enough (power analysis) " Collect metrics of interest " Analyze ! Must run statistical tests (t-tests) to confirm differences are not due to chance 40 Kohavi et al, 2009
  121. A/B testing ! Concept is trivial " Randomly split traffic

    between two (or more) versions # A (Control) # B (Treatment) " Run long enough (power analysis) " Collect metrics of interest " Analyze ! Must run statistical tests (t-tests) to confirm differences are not due to chance ! Best scientific way to prove causality, i.e., the changes in metrics are caused by changes introduced in the treatment(s) 40 Kohavi et al, 2009
  122. Advantage of A/B testing ! When the variants run concurrently,

    only two things could explain a change in metrics: 1. The “feature(s)” (A vs. B) 2. Random chance 41
  123. Advantage of A/B testing ! When the variants run concurrently,

    only two things could explain a change in metrics: 1. The “feature(s)” (A vs. B) 2. Random chance ! Everything else happening affects both the variants 41
  124. Advantage of A/B testing ! When the variants run concurrently,

    only two things could explain a change in metrics: 1. The “feature(s)” (A vs. B) 2. Random chance ! Everything else happening affects both the variants ! For #2, conduct statistical tests for significance (“Student’s t-test”) 41
  125. Advantage of A/B testing ! When the variants run concurrently,

    only two things could explain a change in metrics: 1. The “feature(s)” (A vs. B) 2. Random chance ! Everything else happening affects both the variants ! For #2, conduct statistical tests for significance (“Student’s t-test”) ! A/B experiments are not the panacea for everything " Issues discussed in survey paper by Kohavi et al., 2009 41
  126. 42 Kohavi, R. (2013). Online Controlled Experiments. SIGIR ’13. 18

    Any figure that looks interesting or different is usually wrong z If something is “amazing,” find the flaw! z Examples z If you have a mandatory birth date field and people think it’s unnecessary, you’ll find lots of 11/11/11 or 01/01/01 z If you have an optional drop down, do not default to the first alphabetical entry, or you’ll have lots of: jobs = Astronaut z For most web sites, traffic will spike between 1-2AM November 3, 2013, relative to the same hour a week prior. Why? z The previous Office example assumes click maps to revenue. Seemed reasonable, but when the results look so extreme, find the flaw
  127. 43 Kohavi, R. (2013). Online Controlled Experiments. SIGIR ’13. Features

    are built because teams believe they are useful. But most experiments show that features fail to move the metrics they were designed to improve We joke that our job is to tell clients that their new baby is ugly In Uncontrolled, Jim Manzi writes Google ran …randomized experiments… with [only] about 10 percent of these leading to business changes. In an Experimentation and Testing Primer by Avinash Kaushik, authors of Web Analytics: An Hour a Day, he wrote 80% of the time you/we are wrong about what a customer wants 19
  128. 44 Kohavi, R. (2013). Online Controlled Experiments. SIGIR ’13. QualPro

    tested 150,000 ideas over 22 years 75 percent of important business decisions and business improvement ideas either have no impact on performance or actually hurt performance… Based on experiments at Microsoft (paper) 1/3 of ideas were positive ideas and statistically significant 1/3 of ideas were flat: no statistically significant difference 1/3 of ideas were negative and statistically significant Our intuition is poor: 60-90% of ideas do not improve the metric(s) they were designed to improve (domain dependent). Humbling! 20
  129. 45 Kohavi, R. (2013). Online Controlled Experiments. SIGIR ’13. Avoid

    the temptation to try and build optimal features through extensive planning without early testing of ideas Experiment often To have a great idea, have a lot of them -- Thomas Edison If you have to kiss a lot of frogs to find a prince, find more frogs and kiss them faster and faster -- Mike Moran, Do it Wrong Quickly Try radical ideas. You may be surprised Doubly true if it’s cheap to implement (e.g., shopping cart recommendations) If you're not prepared to be wrong, you'll never come up with anything original – Sir Ken Robinson, TED 2006 (#1 TED talk)
  130. 46 Metric Types • Direct (movable, noisy) SERP Is Clicked

    Time to first/last click … • Long Term (hard to move, reliable) Abandonment Typically only changes significantly after years of query volume (on a large search engine)
  131. 47 Kohavi, R. (2013). Online Controlled Experiments. SIGIR ’13. If

    you remember one thing from this talk, remember this point OEC = Overall Evaluation Criterion Agree early on what you are optimizing Getting agreement on the OEC in the org is a huge step forward Suggestion: optimize for customer lifetime value, not immediate short-term revenue Criterion could be weighted sum of factors, such as Time on site (per time period, say week or month) Visit frequency Report many other metrics for diagnostics, i.e., to understand the why the OEC changed and raise new hypotheses 22
  132. 48 Kohavi, R. (2013). Online Controlled Experiments. SIGIR ’13. KDD

    2012 paper (*) Search engines (Bing, Google) are evaluated on query share (distinct queries) and revenue as long-term goals Puzzle A ranking bug in an experiment resulted in very poor search results Distinct queries went up over 10%, and revenue went up over 30% What metrics should be in the OEC for a search engine? Degraded (algorithmic) search results cause users to search more to complete their task, and ads appear more relevant (*) KDD 2012 paper with Alex Deng, Brian Frasca, Roger Longbotham, Toby Walker, Ya XU
  133. 48 Kohavi, R. (2013). Online Controlled Experiments. SIGIR ’13. KDD

    2012 paper (*) Search engines (Bing, Google) are evaluated on query share (distinct queries) and revenue as long-term goals Puzzle A ranking bug in an experiment resulted in very poor search results Distinct queries went up over 10%, and revenue went up over 30% What metrics should be in the OEC for a search engine? Degraded (algorithmic) search results cause users to search more to complete their task, and ads appear more relevant (*) KDD 2012 paper with Alex Deng, Brian Frasca, Roger Longbotham, Toby Walker, Ya XU Distinct queries went up over 10% and revenue went op over 30%. What happened?
  134. 49 Kohavi, R. (2013). Online Controlled Experiments. SIGIR ’13. KDD

    2012 paper (*) Search engines (Bing, Google) are evaluated on query share (distinct queries) and revenue as long-term goals Puzzle A ranking bug in an experiment resulted in very poor search results Distinct queries went up over 10%, and revenue went up over 30% What metrics should be in the OEC for a search engine? Degraded (algorithmic) search results cause users to search more to complete their task, and ads appear more relevant (*) KDD 2012 paper with Alex Deng, Brian Frasca, Roger Longbotham, Toby Walker, Ya XU
  135. 50 A/B Test Types !Experiment To validate a new idea

    !Calibration test Degrade production system deliberately with a known quantity (i.e., remove top document), to calibrate metrics
  136. 50 A/B Test Types !Experiment To validate a new idea

    !Calibration test Degrade production system deliberately with a known quantity (i.e., remove top document), to calibrate metrics !A/A test No differences should be measured (95% of the time)
  137. 50 A/B Test Types !Experiment To validate a new idea

    !Calibration test Degrade production system deliberately with a known quantity (i.e., remove top document), to calibrate metrics !A/A test No differences should be measured (95% of the time) !Reverse test Test a previous experiment again by reversely applying changes
  138. 50 A/B Test Types !Experiment To validate a new idea

    !Calibration test Degrade production system deliberately with a known quantity (i.e., remove top document), to calibrate metrics !A/A test No differences should be measured (95% of the time) !Reverse test Test a previous experiment again by reversely applying changes !Random bucket To collect data (to run counterfactual analysis
  139. Outline • Online vs Offline Evaluation • Observable User Behavior

    • A/B testing & Online measures • A/B testing • Online measures • Interleaving
  140. 52 Interleaving Interleaving for information retrieval Interleaving for information retrieval

    Ranker A Ranker B 1 2 3 4 5 1 2 4 5 6 Which ranker is better?
  141. 52 Interleaving Interleaving for information retrieval Interleaving for information retrieval

    Ranker A Ranker B 1 2 3 4 5 1 2 4 5 6 Which ranker is better? Several ways to find out:
  142. 52 Interleaving Interleaving for information retrieval Interleaving for information retrieval

    Ranker A Ranker B 1 2 3 4 5 1 2 4 5 6 Which ranker is better? Several ways to find out: • Ask assessors which documents are relevant, ranker with more relevant documents higher in the ranking is better.
  143. 52 Interleaving Interleaving for information retrieval Interleaving for information retrieval

    Ranker A Ranker B 1 2 3 4 5 1 2 4 5 6 Which ranker is better? Several ways to find out: • Ask assessors which documents are relevant, ranker with more relevant documents higher in the ranking is better. Expensive Labels don’t come from users
  144. 52 Interleaving Interleaving for information retrieval Interleaving for information retrieval

    Ranker A Ranker B 1 2 3 4 5 1 2 4 5 6 Which ranker is better? Several ways to find out: • Ask assessors which documents are relevant, ranker with more relevant documents higher in the ranking is better. • Split user population, observe user interactions (clicks) with ranker A and B. Ranker with more clicks is better. Expensive Labels don’t come from users
  145. 52 Interleaving Interleaving for information retrieval Interleaving for information retrieval

    Ranker A Ranker B 1 2 3 4 5 1 2 4 5 6 Which ranker is better? Several ways to find out: • Ask assessors which documents are relevant, ranker with more relevant documents higher in the ranking is better. • Split user population, observe user interactions (clicks) with ranker A and B. Ranker with more clicks is better. Expensive Labels don’t come from users Between subject design A and B seen by different users
  146. 52 Interleaving Interleaving for information retrieval Interleaving for information retrieval

    Ranker A Ranker B 1 2 3 4 5 1 2 4 5 6 Which ranker is better? Several ways to find out: • Ask assessors which documents are relevant, ranker with more relevant documents higher in the ranking is better. • Split user population, observe user interactions (clicks) with ranker A and B. Ranker with more clicks is better. • Or, interleave ranker A and B… Expensive Labels don’t come from users Between subject design A and B seen by different users
  147. 52 Interleaving Interleaving for information retrieval Interleaving for information retrieval

    Ranker A Ranker B 1 2 3 4 5 1 2 4 5 6 Which ranker is better? Several ways to find out: • Ask assessors which documents are relevant, ranker with more relevant documents higher in the ranking is better. • Split user population, observe user interactions (clicks) with ranker A and B. Ranker with more clicks is better. • Or, interleave ranker A and B… Expensive Labels don’t come from users Between subject design A and B seen by different users Within subject design A and B seen by same users with same queries
  148. 52 Interleaving Ranker A Ranker B 1 2 3 4

    5 1 2 4 5 6 Which ranker is better? Several ways to find out: • Ask assessors which documents are relevant, ranker with more relevant documents higher in the ranking is better. • Split user population, observe user interactions (clicks) with ranker A and B. Ranker with more clicks is better. • Or, interleave ranker A and B… Interleaving for information retrieval
  149. 52 Interleaving Ranker A Ranker B 1 2 3 4

    5 1 2 4 5 6 Which ranker is better? Several ways to find out: • Ask assessors which documents are relevant, ranker with more relevant documents higher in the ranking is better. • Split user population, observe user interactions (clicks) with ranker A and B. Ranker with more clicks is better. • Or, interleave ranker A and B… Interleaving for information retrieval
  150. 52 Interleaving Ranker A Ranker B 1 2 3 4

    5 1 2 4 5 6 Which ranker is better? Several ways to find out: • Ask assessors which documents are relevant, ranker with more relevant documents higher in the ranking is better. • Split user population, observe user interactions (clicks) with ranker A and B. Ranker with more clicks is better. • Or, interleave ranker A and B… Interleaving for information retrieval
  151. 52 Interleaving Ranker A Ranker B 1 2 3 4

    5 2 4 5 6 Which ranker is better? Several ways to find out: • Ask assessors which documents are relevant, ranker with more relevant documents higher in the ranking is better. • Split user population, observe user interactions (clicks) with ranker A and B. Ranker with more clicks is better. • Or, interleave ranker A and B… Interleaving for information retrieval
  152. 52 Interleaving Ranker A Ranker B 1 2 3 4

    5 2 4 5 6 Which ranker is better? Several ways to find out: • Ask assessors which documents are relevant, ranker with more relevant documents higher in the ranking is better. • Split user population, observe user interactions (clicks) with ranker A and B. Ranker with more clicks is better. • Or, interleave ranker A and B… Interleaving for information retrieval
  153. 52 Interleaving Ranker A Ranker B 1 2 3 4

    5 2 4 5 6 Which ranker is better? Several ways to find out: • Ask assessors which documents are relevant, ranker with more relevant documents higher in the ranking is better. • Split user population, observe user interactions (clicks) with ranker A and B. Ranker with more clicks is better. • Or, interleave ranker A and B… Interleaving for information retrieval
  154. 52 Interleaving Ranker A Ranker B 1 2 3 4

    5 2 4 5 6 Which ranker is better? Several ways to find out: • Ask assessors which documents are relevant, ranker with more relevant documents higher in the ranking is better. • Split user population, observe user interactions (clicks) with ranker A and B. Ranker with more clicks is better. • Or, interleave ranker A and B… Interleaving for information retrieval
  155. 52 Interleaving Ranker A Ranker B 1 3 4 5

    2 4 5 6 Which ranker is better? Several ways to find out: • Ask assessors which documents are relevant, ranker with more relevant documents higher in the ranking is better. • Split user population, observe user interactions (clicks) with ranker A and B. Ranker with more clicks is better. • Or, interleave ranker A and B… Interleaving for information retrieval
  156. 52 Interleaving Ranker A Ranker B 1 3 4 5

    2 4 5 6 Which ranker is better? Several ways to find out: • Ask assessors which documents are relevant, ranker with more relevant documents higher in the ranking is better. • Split user population, observe user interactions (clicks) with ranker A and B. Ranker with more clicks is better. • Or, interleave ranker A and B… Interleaving for information retrieval
  157. 52 Interleaving Ranker A Ranker B 1 3 4 5

    2 4 5 6 Which ranker is better? Several ways to find out: • Ask assessors which documents are relevant, ranker with more relevant documents higher in the ranking is better. • Split user population, observe user interactions (clicks) with ranker A and B. Ranker with more clicks is better. • Or, interleave ranker A and B… Interleaving for information retrieval
  158. 52 Interleaving Ranker A Ranker B 1 3 4 5

    2 4 5 6 Which ranker is better? Several ways to find out: • Ask assessors which documents are relevant, ranker with more relevant documents higher in the ranking is better. • Split user population, observe user interactions (clicks) with ranker A and B. Ranker with more clicks is better. • Or, interleave ranker A and B… Interleaving for information retrieval
  159. 52 Interleaving Ranker A Ranker B 1 3 2 4

    6 Which ranker is better? Several ways to find out: • Ask assessors which documents are relevant, ranker with more relevant documents higher in the ranking is better. • Split user population, observe user interactions (clicks) with ranker A and B. Ranker with more clicks is better. • Or, interleave ranker A and B… Interleaving for information retrieval
  160. 52 Interleaving Ranker A Ranker B 1 3 2 4

    6 Which ranker is better? Several ways to find out: • Ask assessors which documents are relevant, ranker with more relevant documents higher in the ranking is better. • Split user population, observe user interactions (clicks) with ranker A and B. Ranker with more clicks is better. • Or, interleave ranker A and B… Interleaving for information retrieval
  161. 52 Interleaving Ranker A Ranker B 1 3 2 4

    6 Which ranker is better? Several ways to find out: • Ask assessors which documents are relevant, ranker with more relevant documents higher in the ranking is better. • Split user population, observe user interactions (clicks) with ranker A and B. Ranker with more clicks is better. • Or, interleave ranker A and B… Interleaving for information retrieval
  162. 52 Interleaving Ranker A Ranker B 1 3 2 4

    6 Which ranker is better? Several ways to find out: • Ask assessors which documents are relevant, ranker with more relevant documents higher in the ranking is better. • Split user population, observe user interactions (clicks) with ranker A and B. Ranker with more clicks is better. • Or, interleave ranker A and B… Interleaving for information retrieval
  163. 52 Interleaving Ranker A Ranker B 1 3 2 4

    6 Which ranker is better? Several ways to find out: • Ask assessors which documents are relevant, ranker with more relevant documents higher in the ranking is better. • Split user population, observe user interactions (clicks) with ranker A and B. Ranker with more clicks is better. • Or, interleave ranker A and B… Interleaving for information retrieval
  164. 52 Interleaving Ranker A Ranker B 1 3 2 4

    6 Which ranker is better? Several ways to find out: • Ask assessors which documents are relevant, ranker with more relevant documents higher in the ranking is better. • Split user population, observe user interactions (clicks) with ranker A and B. Ranker with more clicks is better. • Or, interleave ranker A and B… Interleaving for information retrieval wins loses
  165. 52 Interleaving Ranker A Ranker B 1 3 2 4

    6 Interleaving for information retrieval
  166. 53 Why do interleaving? • Within subject design • As

    opposed to between subject (A/B testing)
  167. 53 Why do interleaving? • Within subject design • As

    opposed to between subject (A/B testing) • Reduces variance (same users/queries for both A and B)
  168. 53 Why do interleaving? • Within subject design • As

    opposed to between subject (A/B testing) • Reduces variance (same users/queries for both A and B) • Need 1 to 2 orders of magnitude less data
  169. 53 Why do interleaving? • Within subject design • As

    opposed to between subject (A/B testing) • Reduces variance (same users/queries for both A and B) • Need 1 to 2 orders of magnitude less data • ~100K queries for interleaving in a mature web search engine (>>1M for A/B testing)
  170. 54 Downsides of interleaving • Online possible for measuring differences

    in ranking algorithms, such as: new ranking algorithms new ranking features new (types of) documents • So, not for UI changes not for ways of displaying snippets not for other aspects such as colors/fonts/… that change
  171. References ! Buscher, G. (2013). IR Evaluation: Perspectives From Within

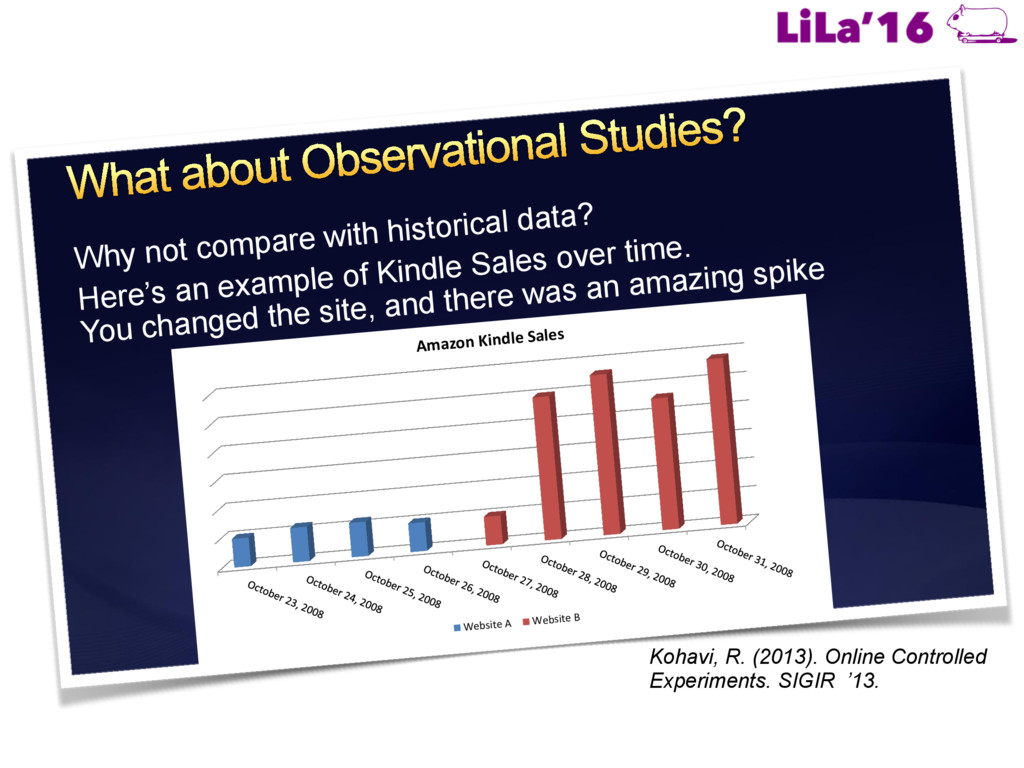
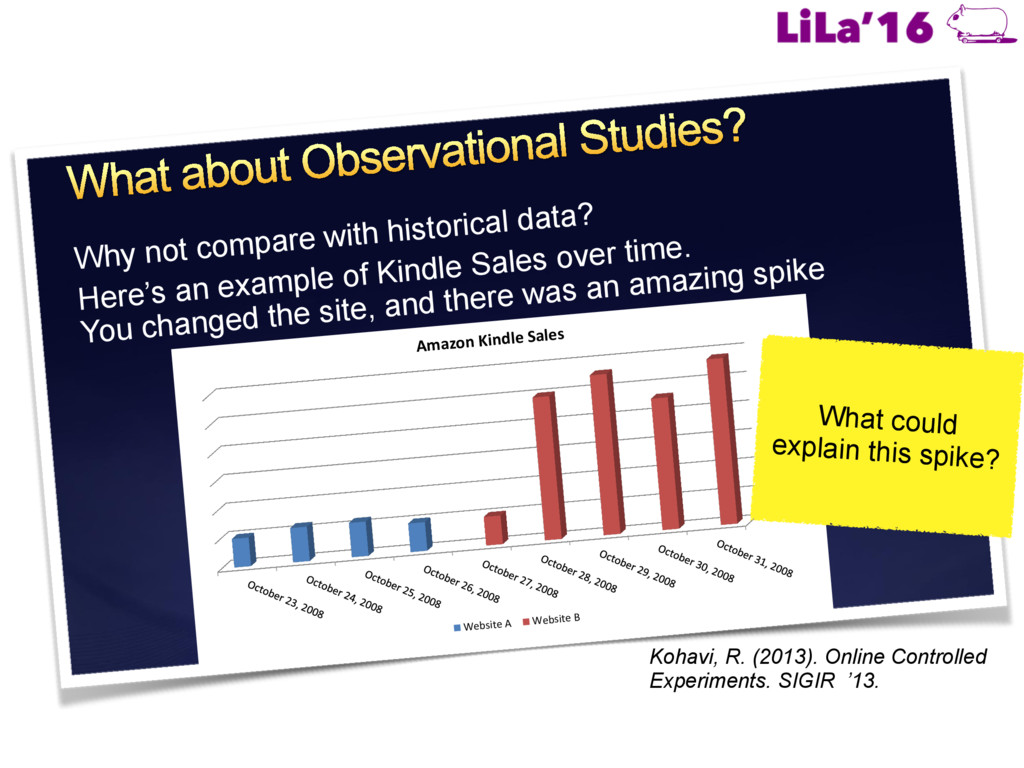
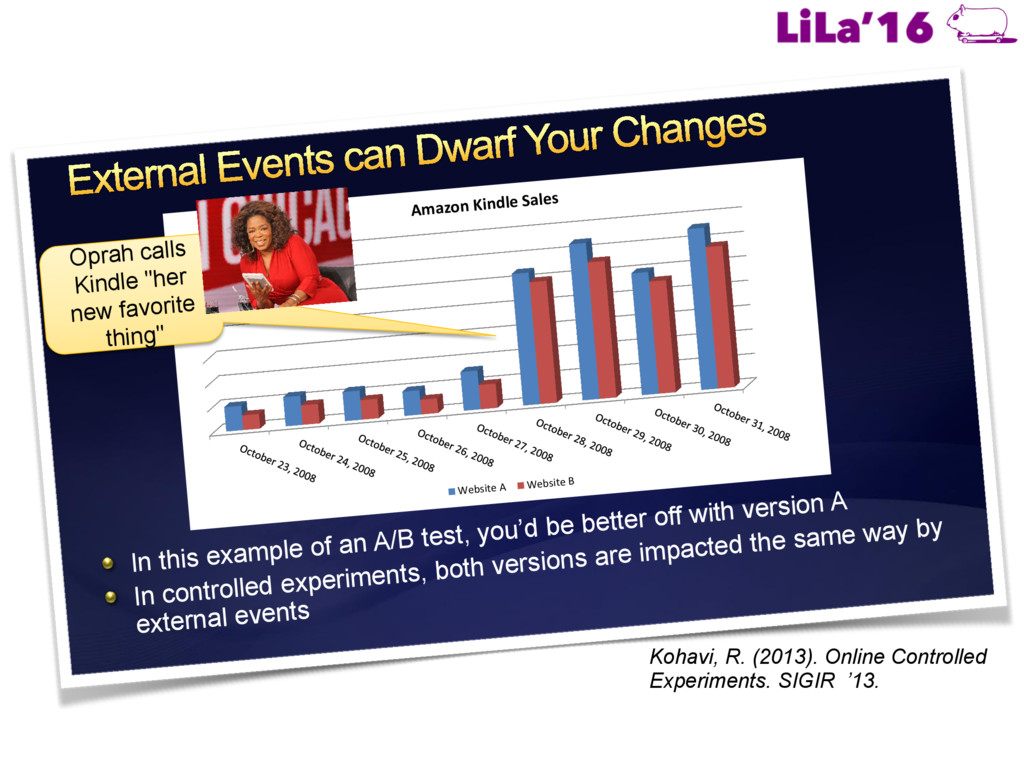
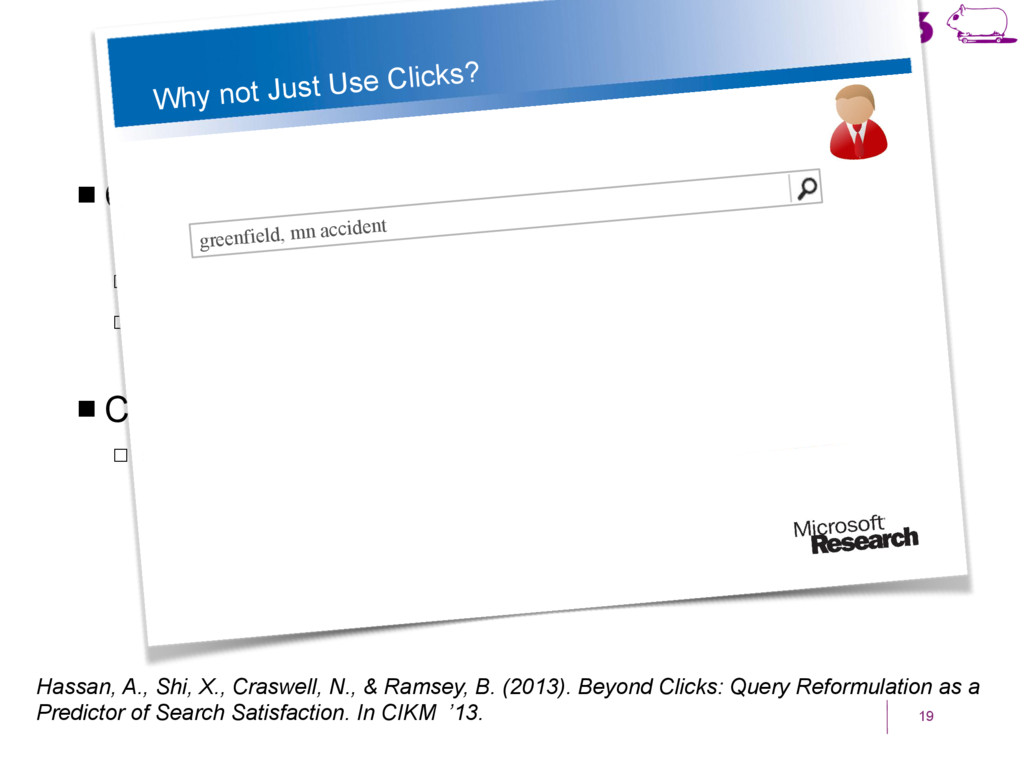
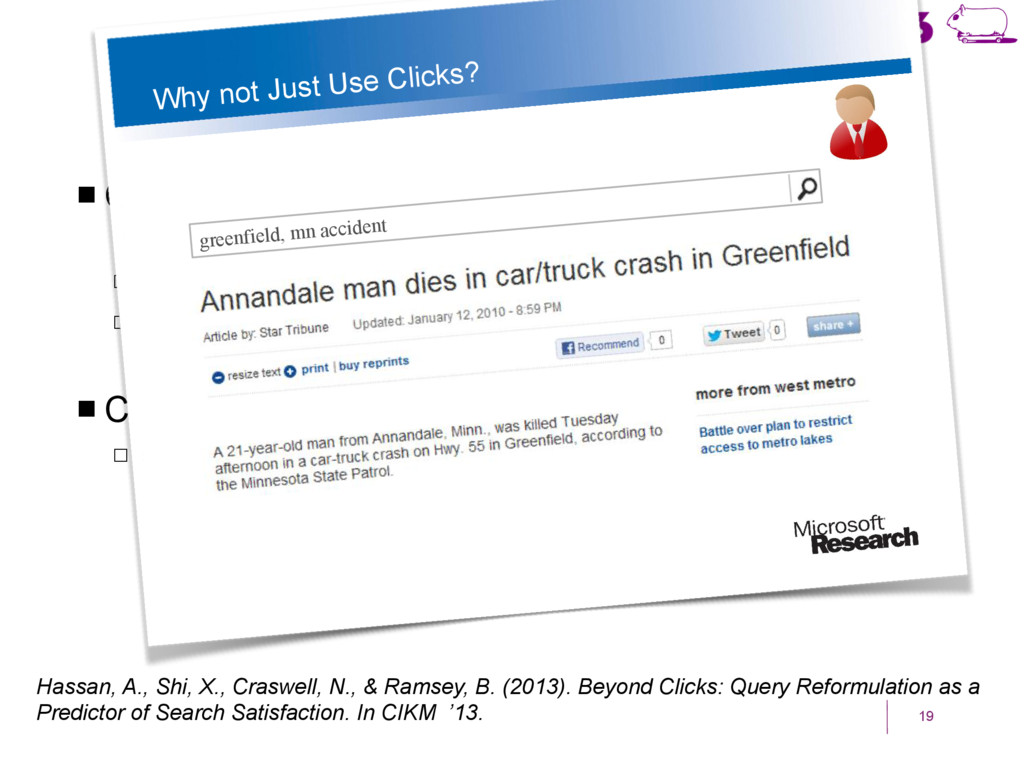
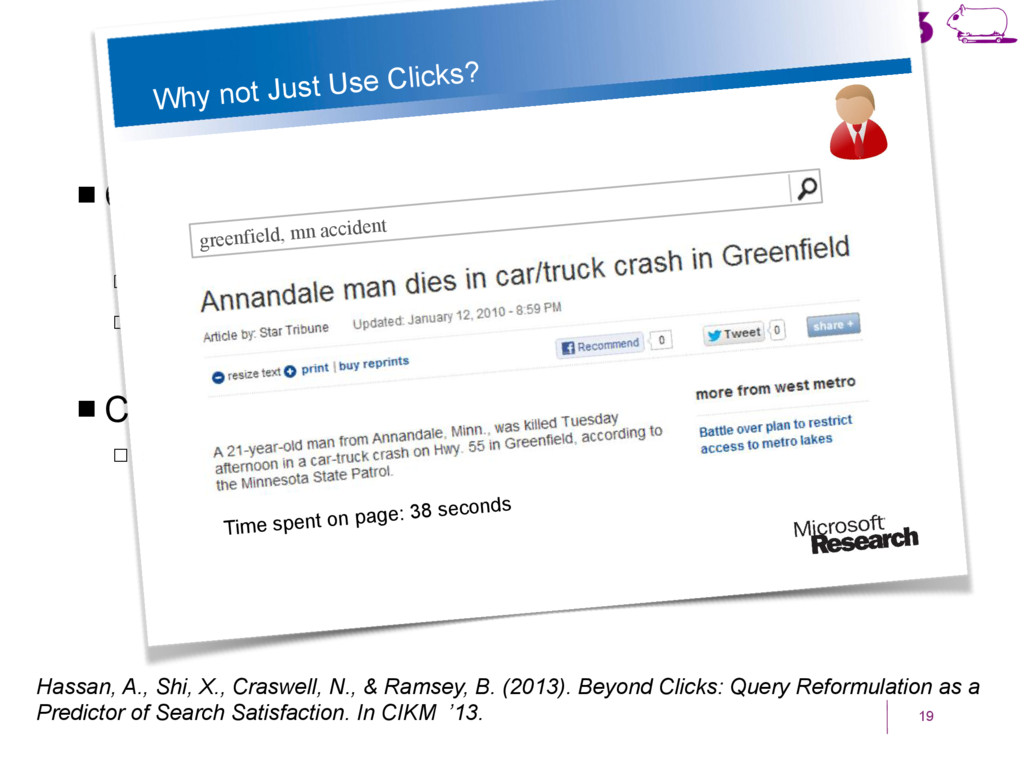
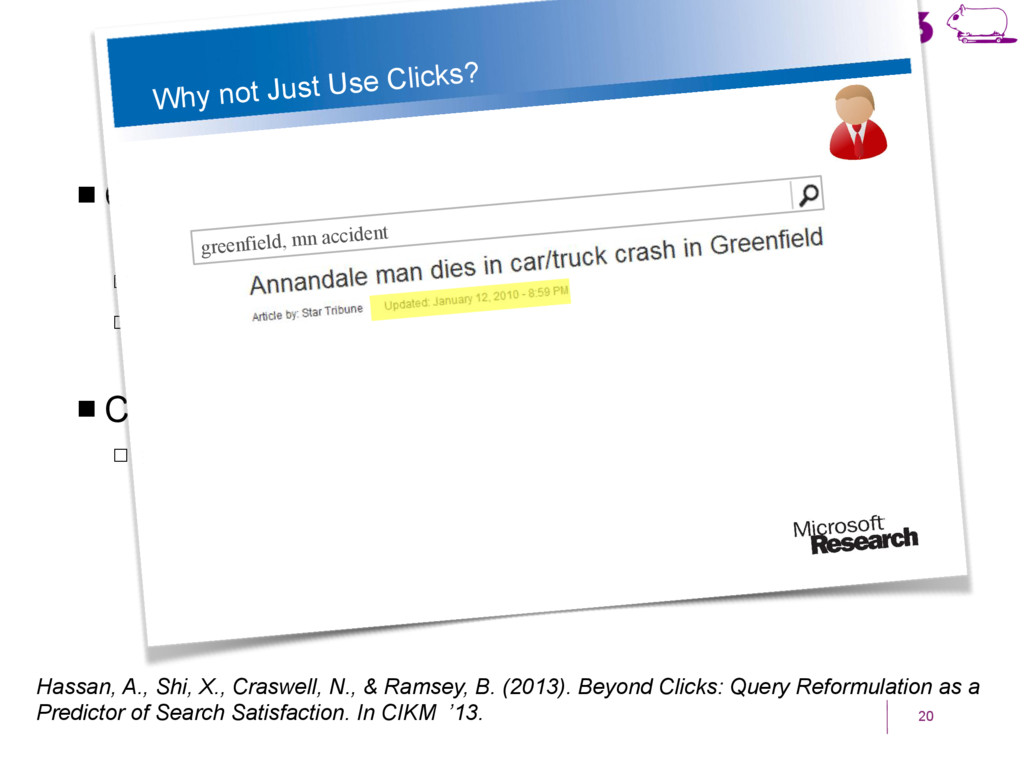
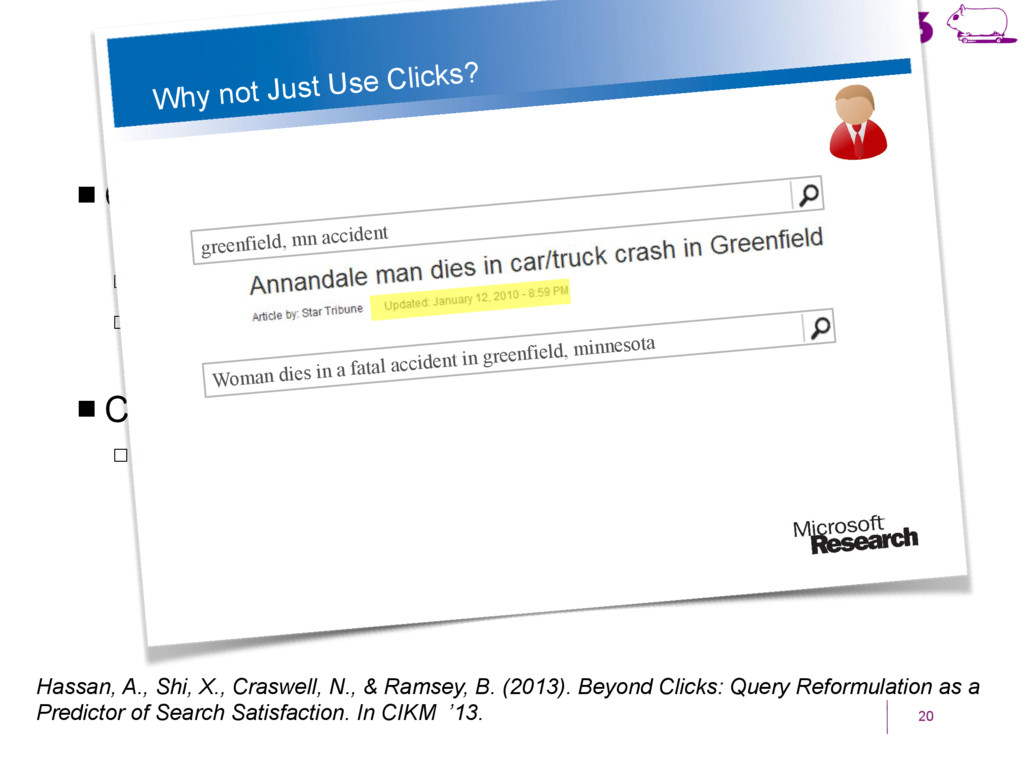
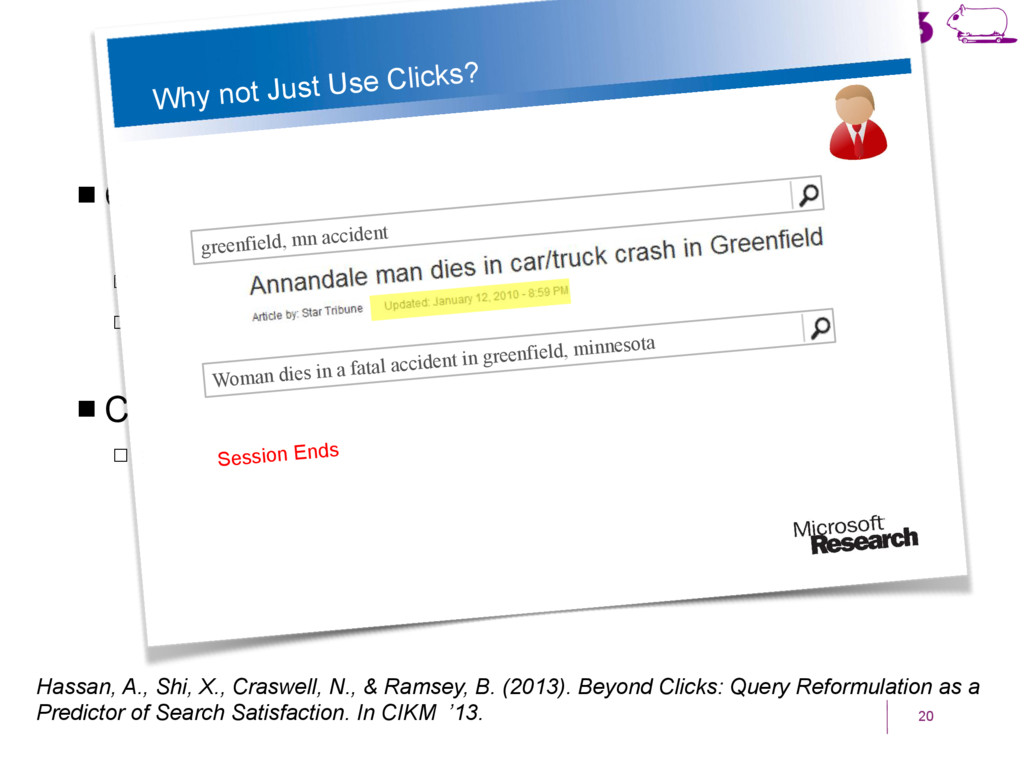
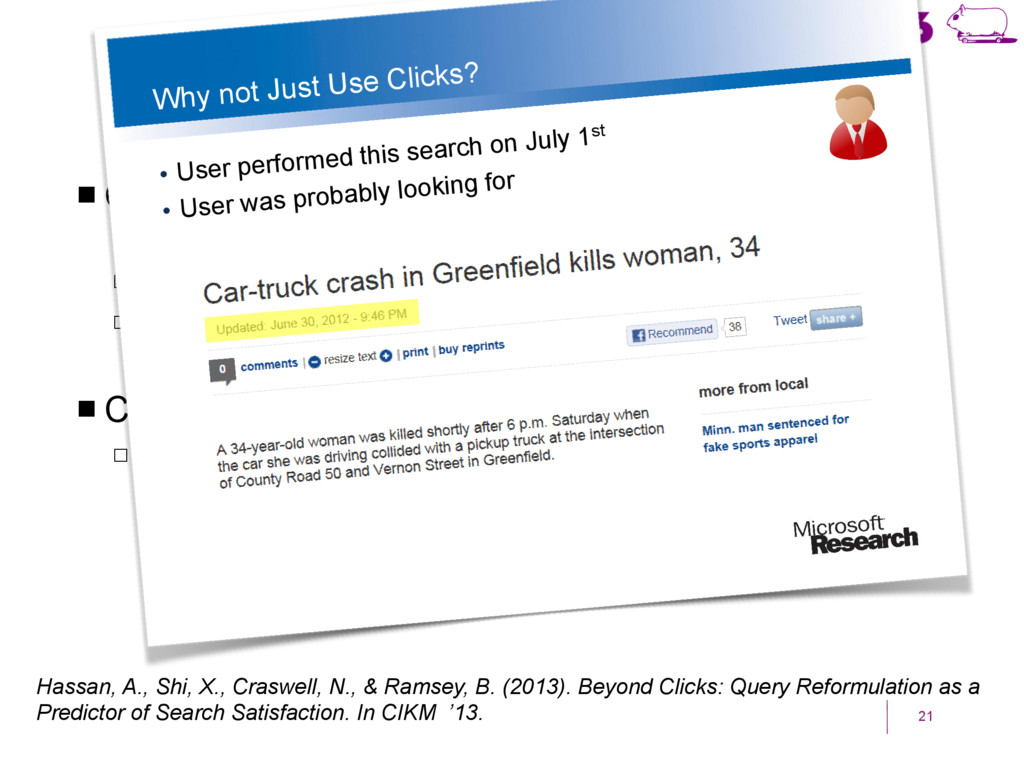
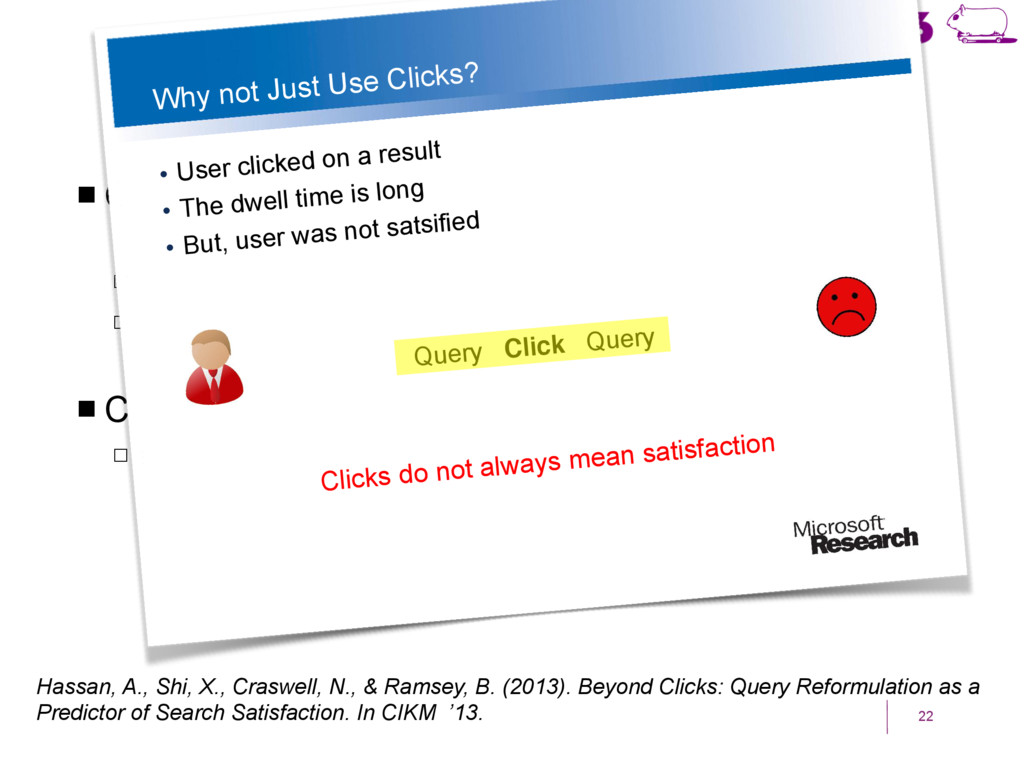
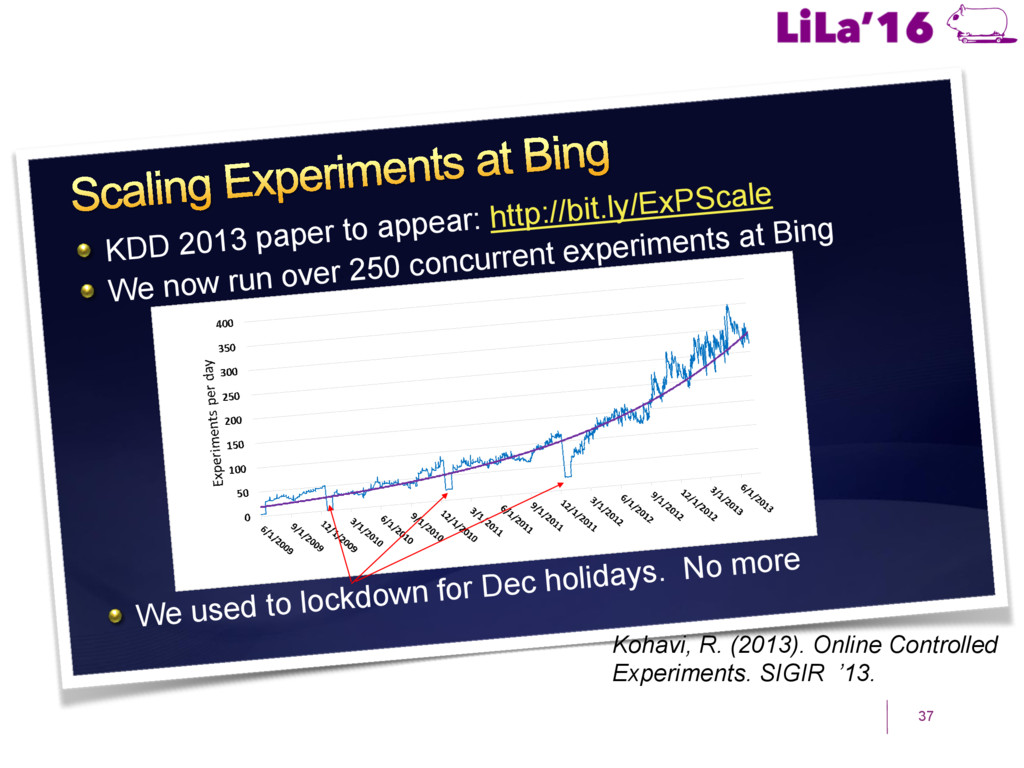
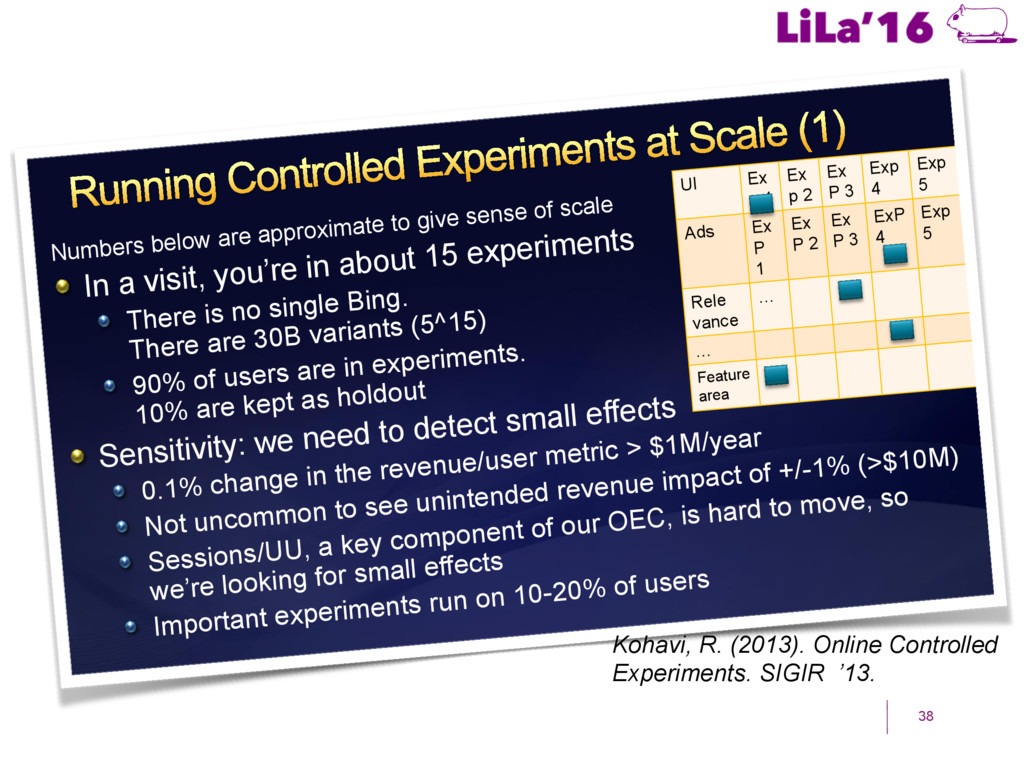
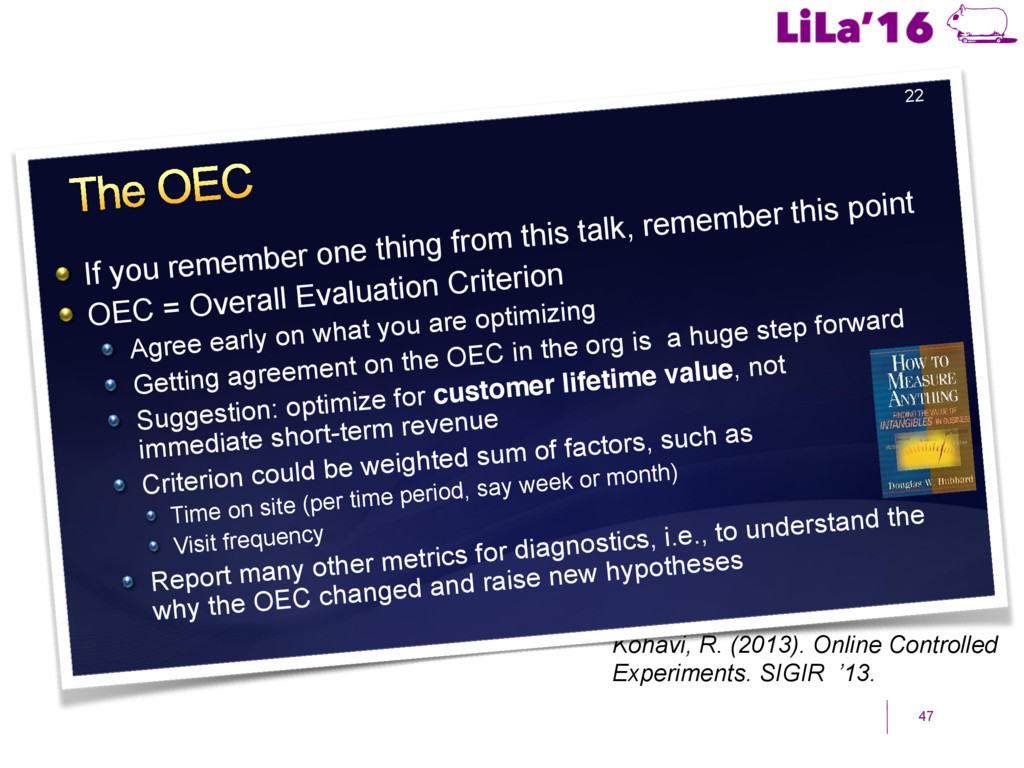
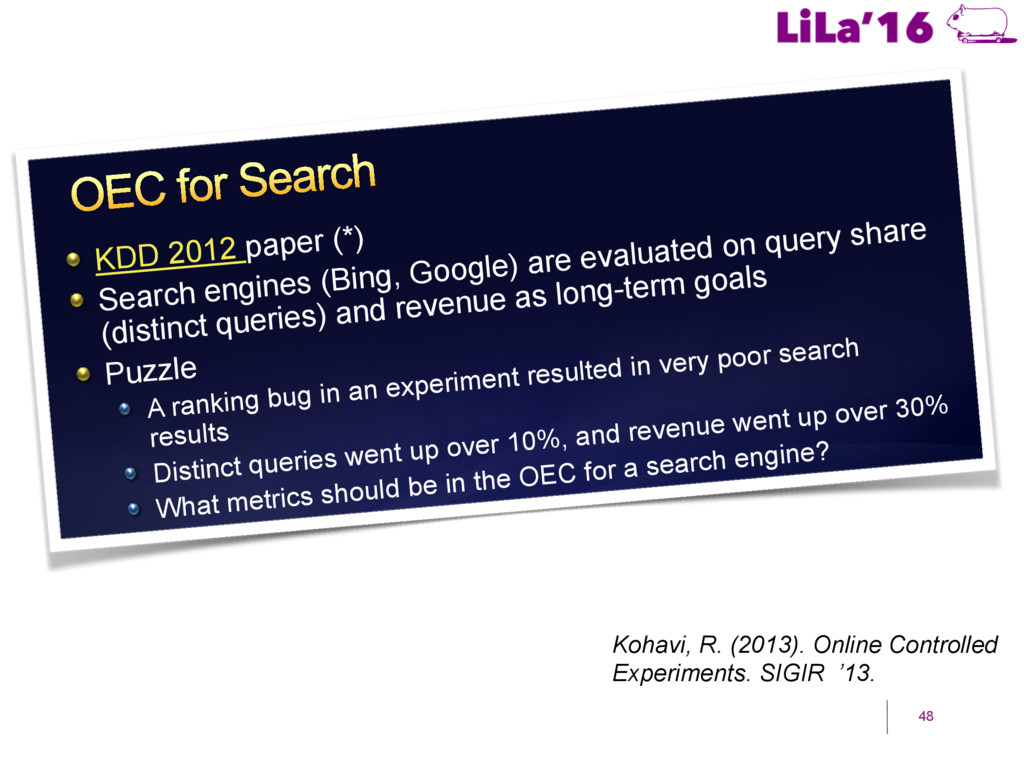
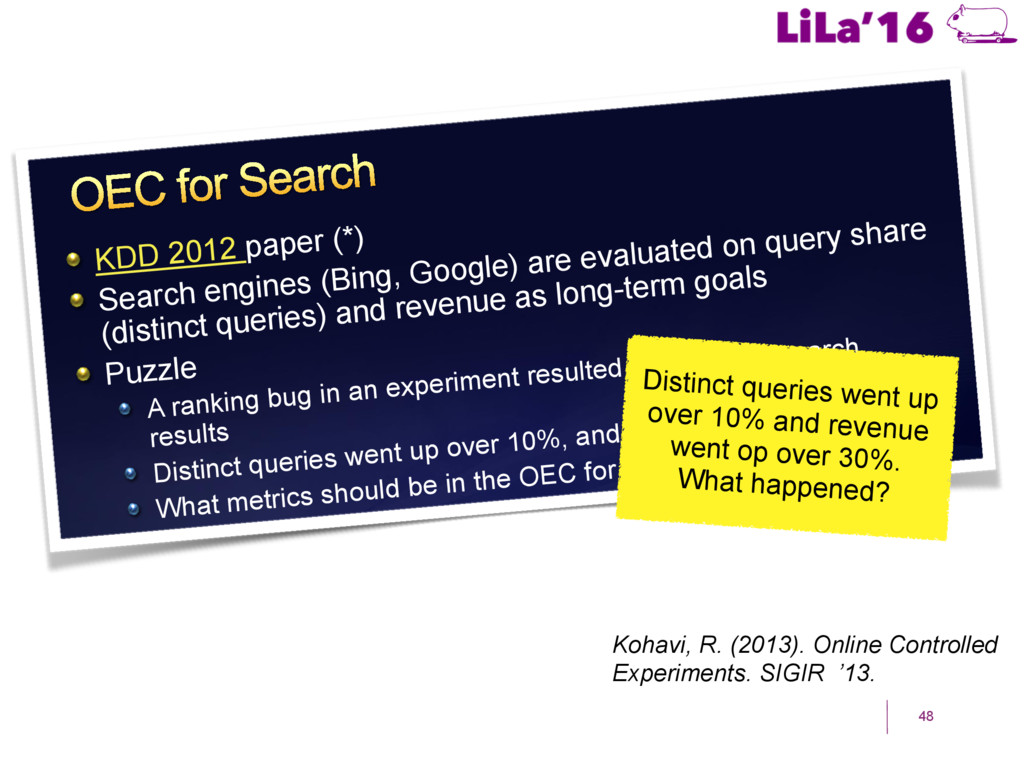
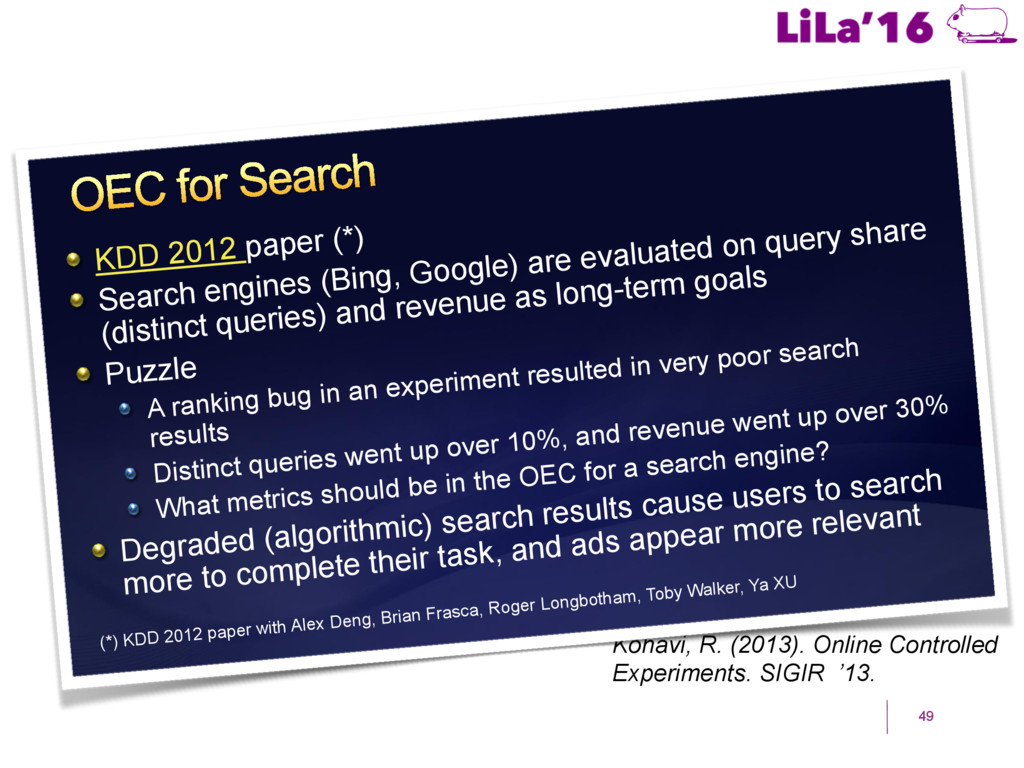
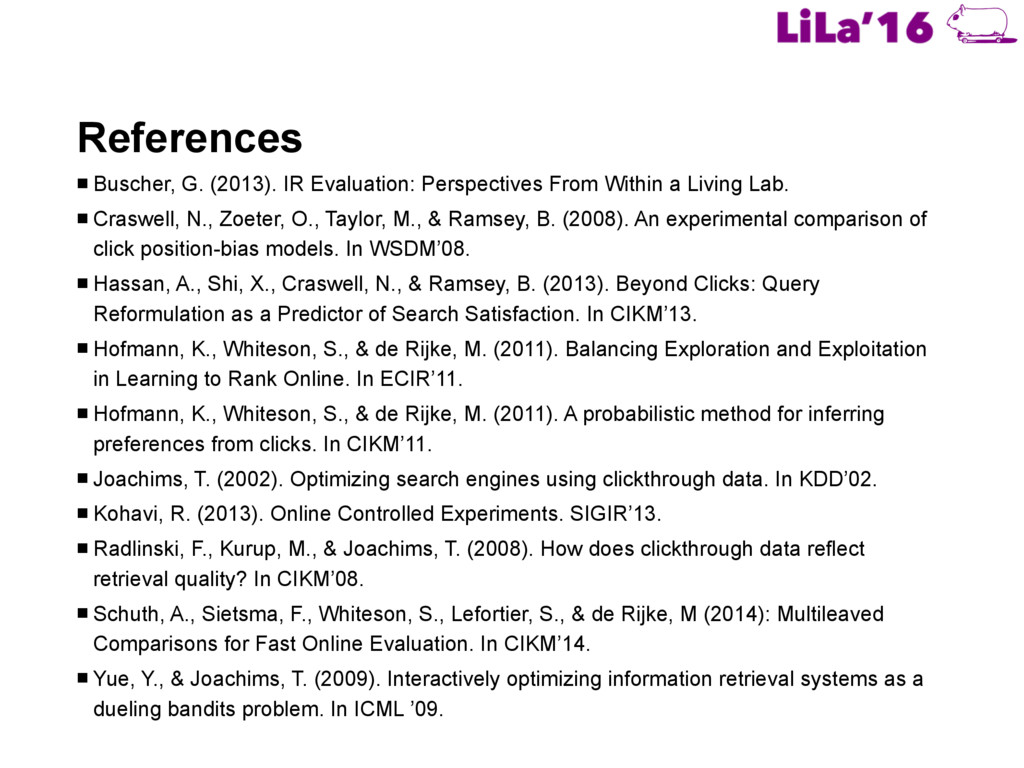
    a Living Lab. ! Craswell, N., Zoeter, O., Taylor, M., & Ramsey, B. (2008). An experimental comparison of click position-bias models. In WSDM’08. ! Hassan, A., Shi, X., Craswell, N., & Ramsey, B. (2013). Beyond Clicks: Query Reformulation as a Predictor of Search Satisfaction. In CIKM’13. ! Hofmann, K., Whiteson, S., & de Rijke, M. (2011). Balancing Exploration and Exploitation in Learning to Rank Online. In ECIR’11. ! Hofmann, K., Whiteson, S., & de Rijke, M. (2011). A probabilistic method for inferring preferences from clicks. In CIKM’11. ! Joachims, T. (2002). Optimizing search engines using clickthrough data. In KDD’02. ! Kohavi, R. (2013). Online Controlled Experiments. SIGIR’13. ! Radlinski, F., Kurup, M., & Joachims, T. (2008). How does clickthrough data reflect retrieval quality? In CIKM’08. ! Schuth, A., Sietsma, F., Whiteson, S., Lefortier, S., & de Rijke, M (2014): Multileaved Comparisons for Fast Online Evaluation. In CIKM’14. ! Yue, Y., & Joachims, T. (2009). Interactively optimizing information retrieval systems as a dueling bandits problem. In ICML ’09.