Presentation from PHPNW13 on tools and best practice for debugging HTTP whether on web, mobile, APIs, or really anywhere else. Includes Wireshark, Charles and cURL
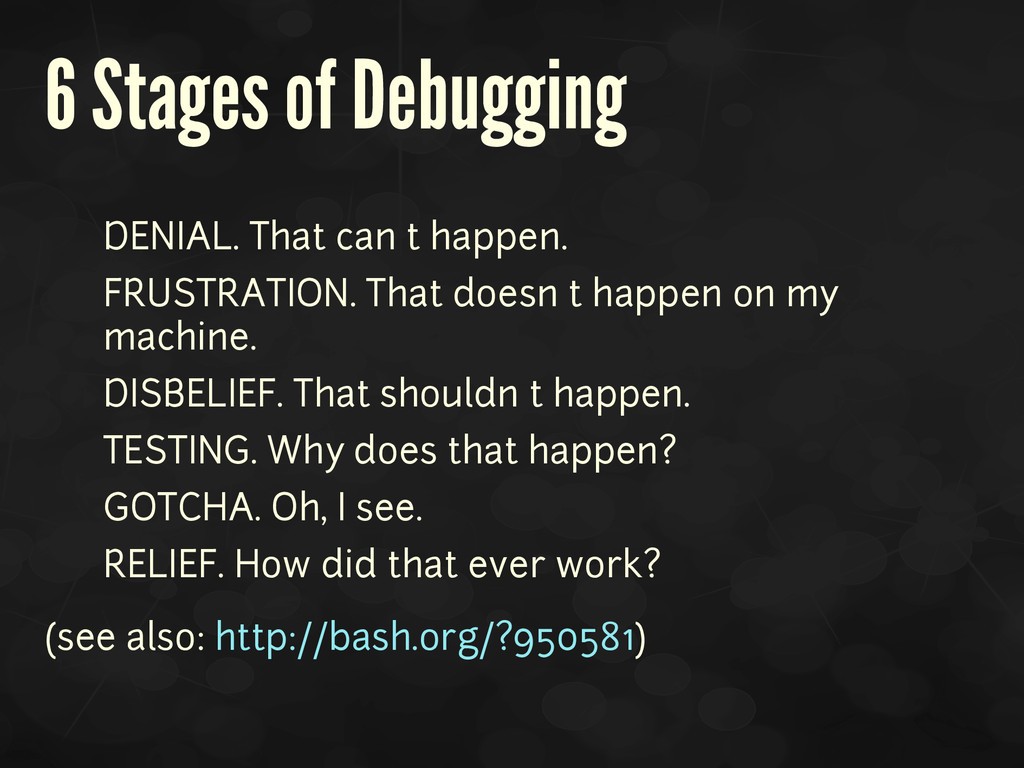
FRUSTRATION. That doesn’t happen on my machine. • DISBELIEF. That shouldn’t happen. • TESTING. Why does that happen? • GOTCHA. Oh, I see. • RELIEF. How did that ever work? (see also: http://bash.org/?950581)
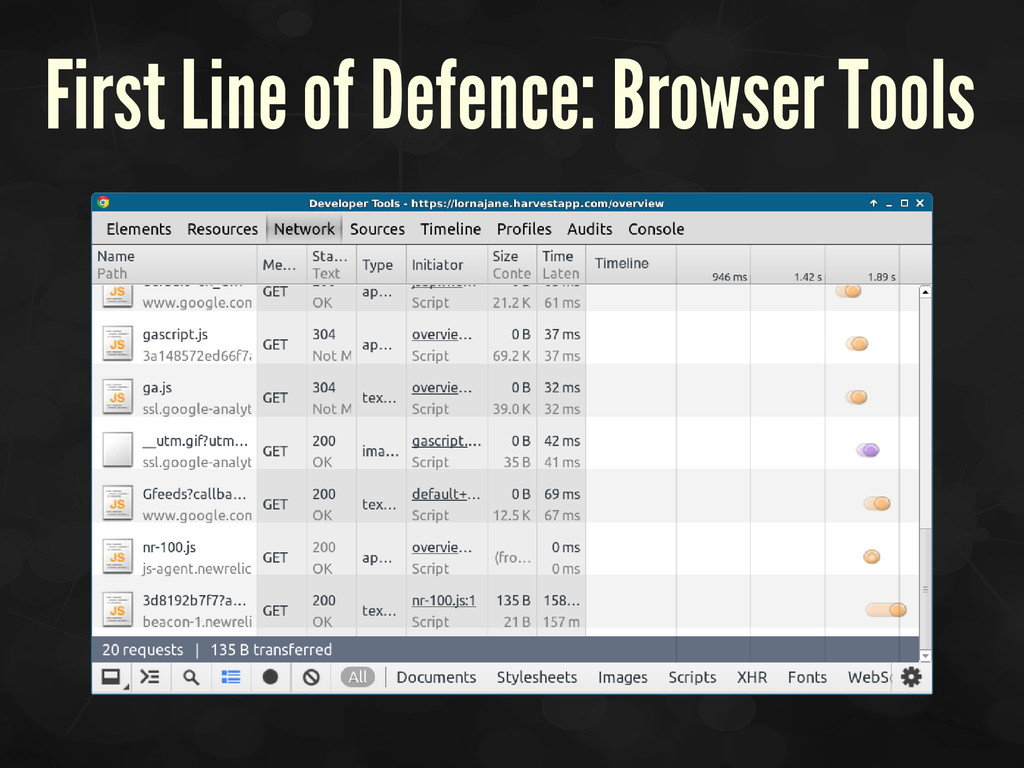
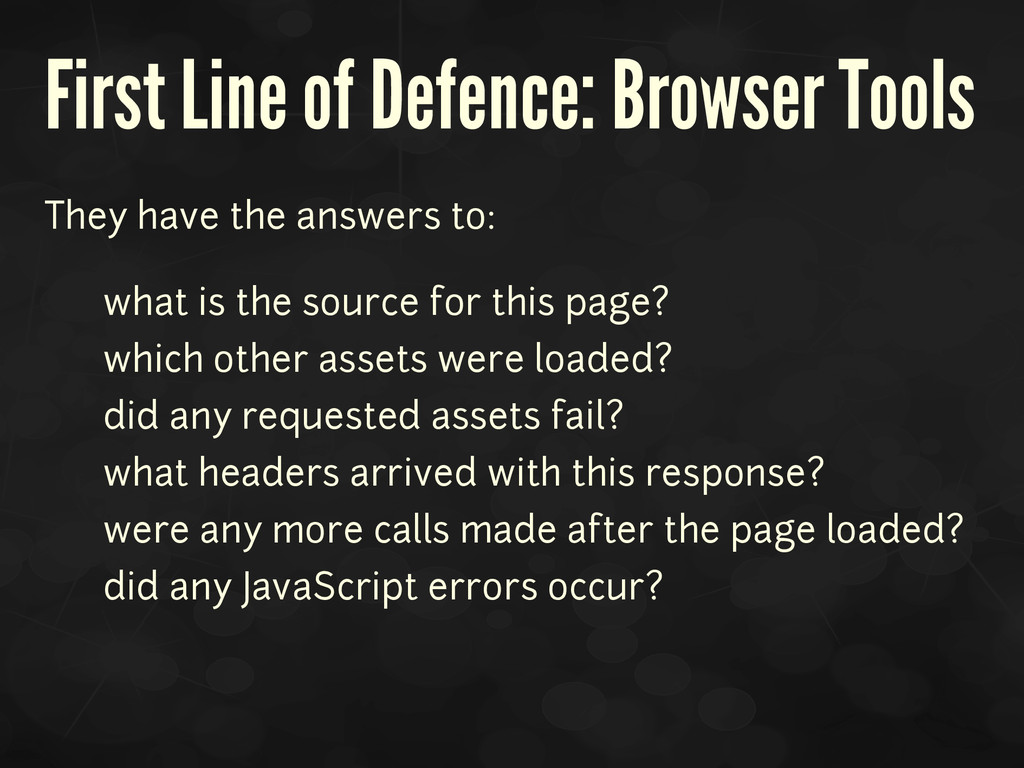
to: • what is the source for this page? • which other assets were loaded? • did any requested assets fail? • what headers arrived with this response? • were any more calls made after the page loaded? • did any JavaScript errors occur?
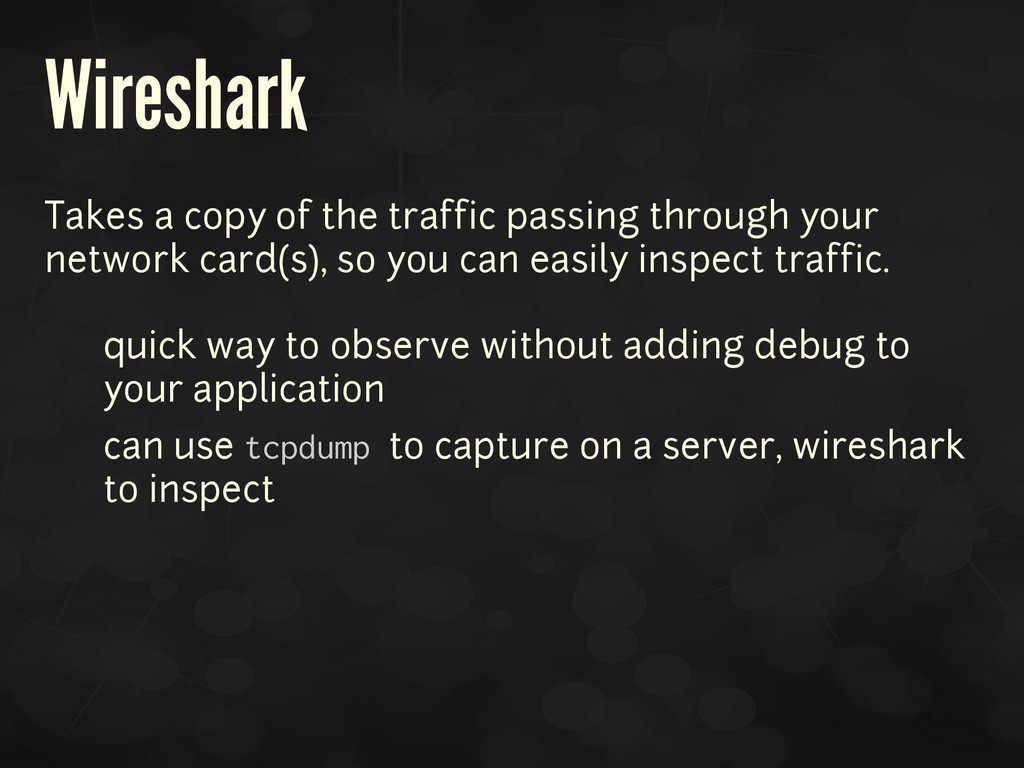
network card(s), so you can easily inspect traffic. • quick way to observe without adding debug to your application • can use tcpdump to capture on a server, wireshark to inspect
for this request -H "[Header: value]" A header to send. Use as many times as needed -d [value] Either the whole body data as a string, a filename, or a key/value pair -s The "silent" switch, to hide curl's progress meter when piping the output to something else -c [filename] Where to store any incoming cookies for future use -b [filename] Cookies to send with the request -v to both body and headers, in the request and response
![Curl is Your Friend -X [verb] The verb to use](https://files.speakerdeck.com/presentations/299f64f010a5013157f76e9fe4c8d3ab/slide_10.jpg)