Upgrade to Pro — share decks privately, control downloads, hide ads and more …

TEST

 TEST

TEST123

lukebrocklehurst11

July 08, 2012
Tweet

Other Decks in Business

Transcript

  1. About the Author 3 Overview 4 Key Findings Summary 5

    Unique Open Rates 6 Unique Open Rates by Send Volumes 7 Unique Open Rates by Industry 8 Unique Click Through Rates 9 Unique Click Through Rates by Send Volumes 10 Unique Click Through Rates by Industry 11 Click Through Rate Relative to Open Rate 12 Bounce Rates 13 Bounce Rates by Send Volumes 14 Bounce Rates by Industry 15 Send Volumes, Open & CTR for the Top 15 Domains 16 Open, CTR & Emails Sent by Day 17 Time Taken to Open Emails 18 Email Clients 19 Glossary & Acronyms 20 Table of Contents Copyright 2012 Vision6 Internet resources are available where ever you see this icon and some underlined text.
  2. www.vision6.com.au 3 July – December 2011 Email Marketing Metrics Report

    Australia Copyright 2012 Vision6 About the Author Contact Vision6 for a free 30 day trial a ground floor 47 warner street fortitude valley qld 4006 australia e [email protected] p +61 7 3257 3906 f +61 7 3257 3907 w www.vision6.com.au/free-trial Vision6 is an Australian owned and operated company, founded in 2001 by friends and colleagues Evan Fortune and Mathew Myers. Together they identified that marketing professionals needed an easier way to create, send and track email messages; and to integrate e-messaging into the marketing mix. As a result the duo formed Vision6. Today we have grown to become a team of more than 30 developers and professionals and are passionate about all things e-messaging. We empower thousands of businesses to achieve great marketing results with our e-messaging platform. It brings together a mix of database, email, mobile and social media messaging tools in an easy- to-use system. We actively contribute to the marketing community by writing whitepapers, providing free training and producing the Email Marketing Metrics Report. We’re also the organisers of Australia’s only email marketing summit (EMSA) and are always on the lookout for new ways to make our clients happy.
  3. www.vision6.com.au 4 July - December 2011 Email Marketing Metrics Report

    Australia Copyright 2012 Vision6 What is included in this report? To make this data as useful as possible to professionals implementing email marketing, we have focused on a number of key metrics that are both informative and useful, including: Open Rate General, Industry, Send Volume Categories Click Through Rate General, Industry, Send Volume Categories, Relative to Open Industry Open, CTRs, Send Volume Categories Domain Open, CTRs, Industry By Day Open, CTRs By Hour Open Bounce & Deliverability General, Industry Email Clients Used to open Overview What would you like to see in future reports? This report is the eleventh in a series of reports produced by Vision6 every six months on the Australian email marketing landscape. This report aims to: 1. Help marketers gauge and improve their email marketing results by providing comparative benchmarks. 2. Uncover trends, provide observations and identify factors that could have the biggest impact on the success of your email campaigns. Data Source This report includes data from over 259 million messages which were distributed via 112,000 sends by predominantly Australian based companies during the last six months of 2011. We have excluded campaigns with less than five email addresses to minimise data distortion. We also excluded all emails sent by our stand alone resellers and corporate networks. We are always looking at ways to improve the Email Marketing Metrics Report. So, if you have any new statistics you’d like to see in this report contact us at [email protected]. Although we cannot promise to include everything, we will do our best to include your suggestions where possible.
  4. www.vision6.com.au 5 July – December 2011 Email Marketing Metrics Report

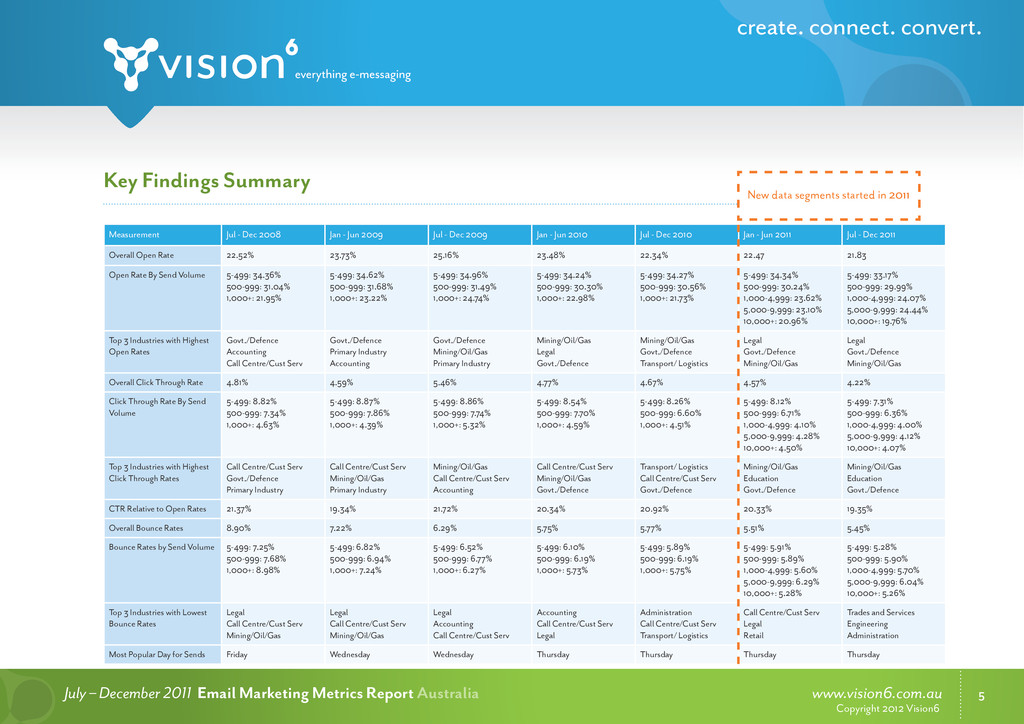
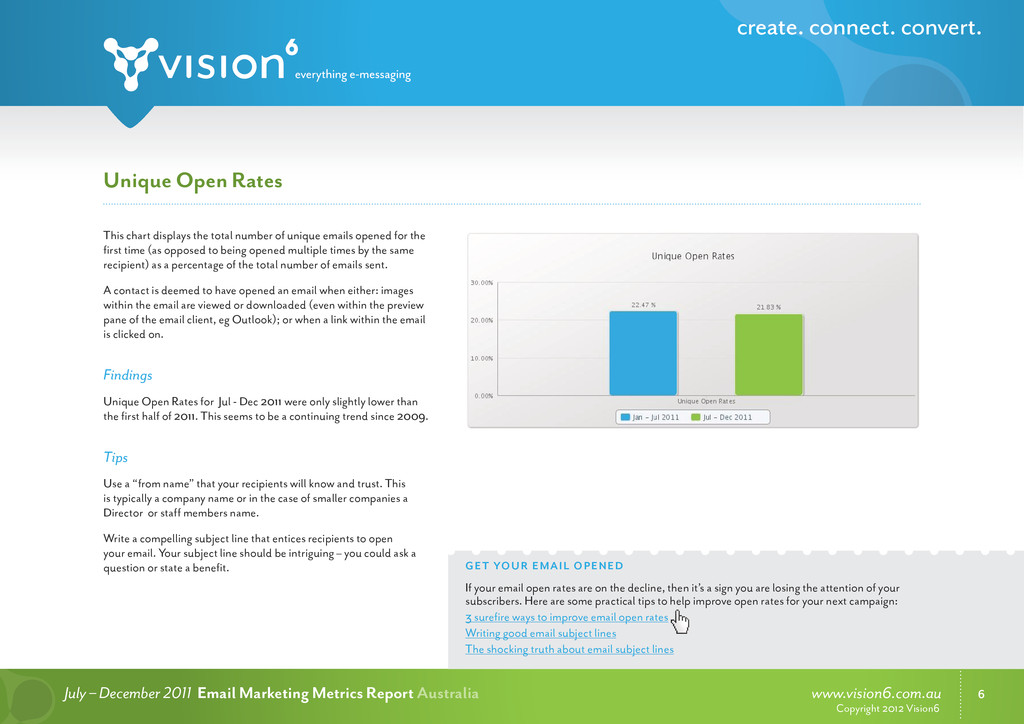
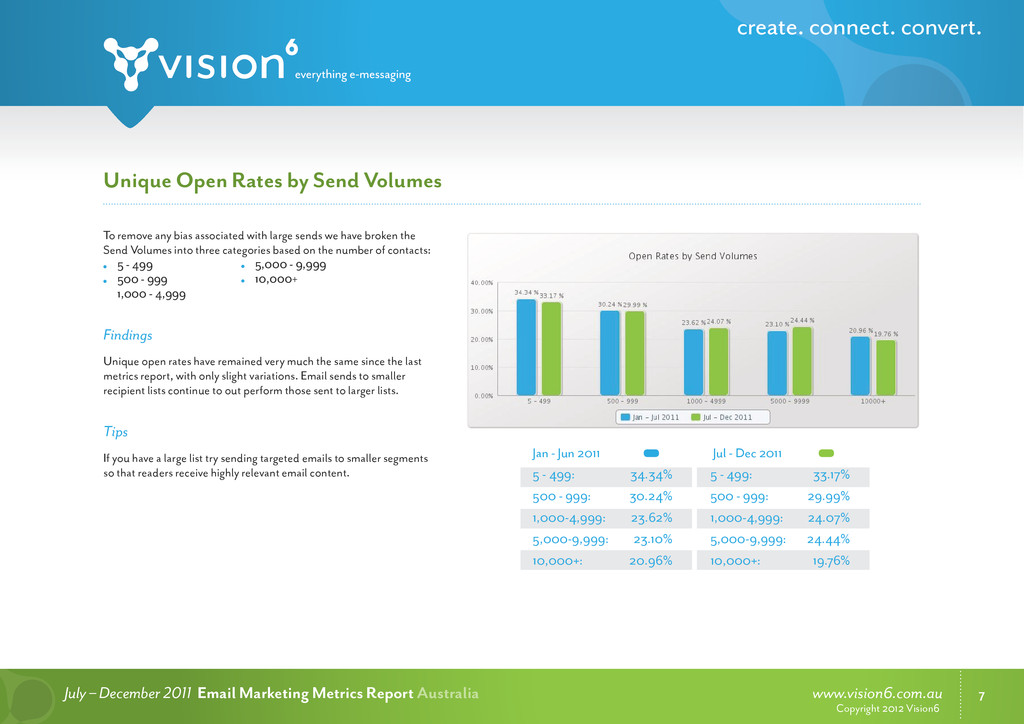
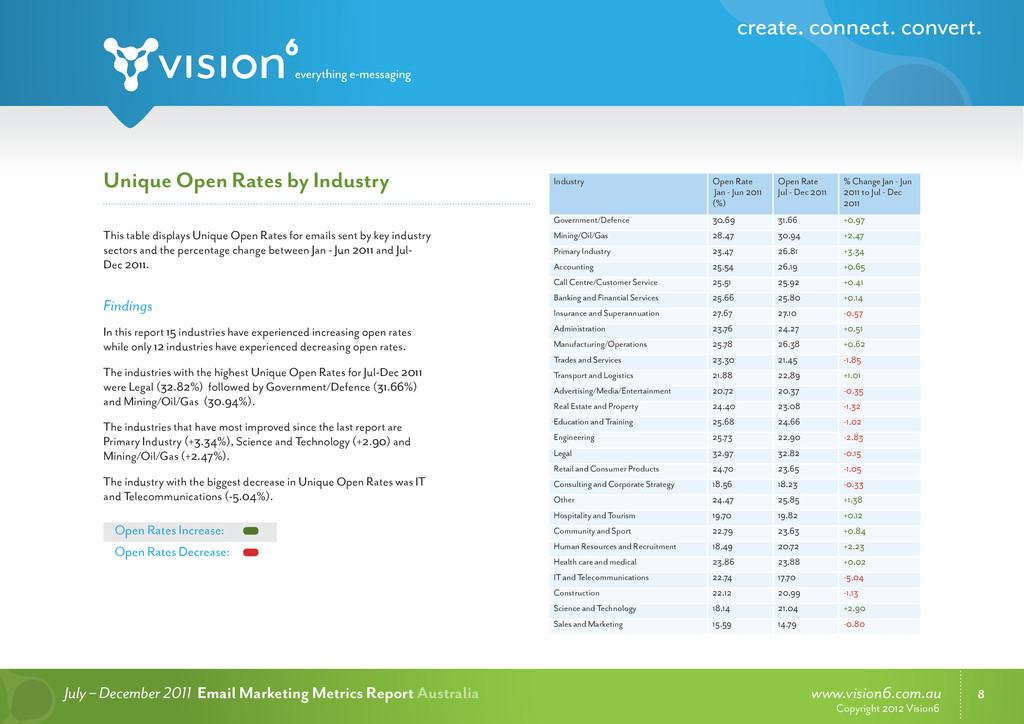
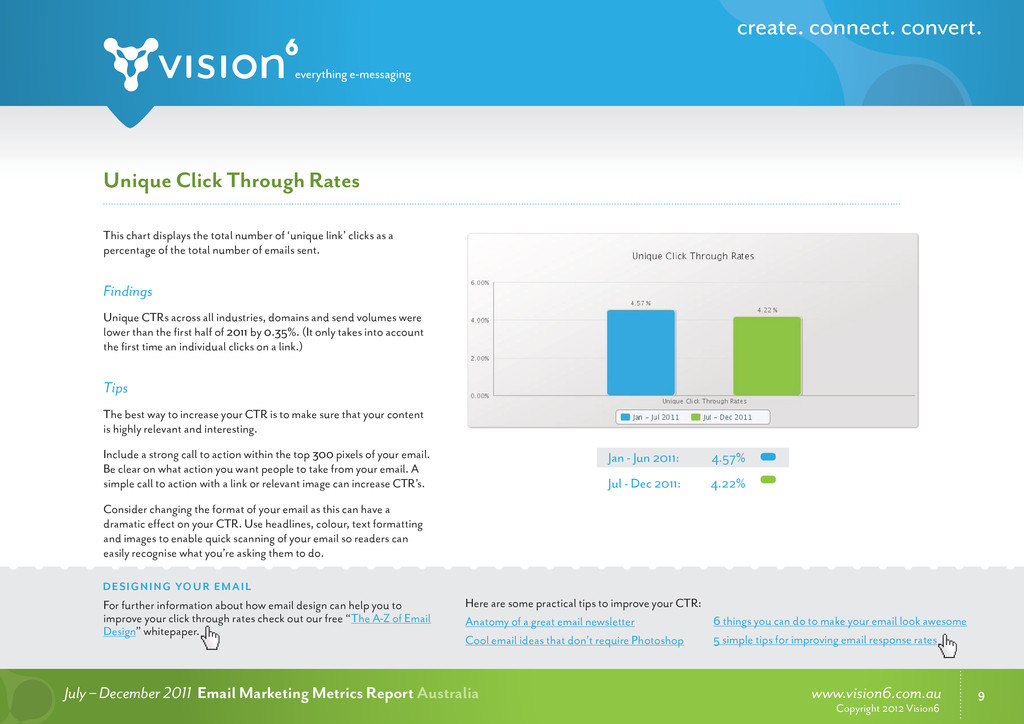
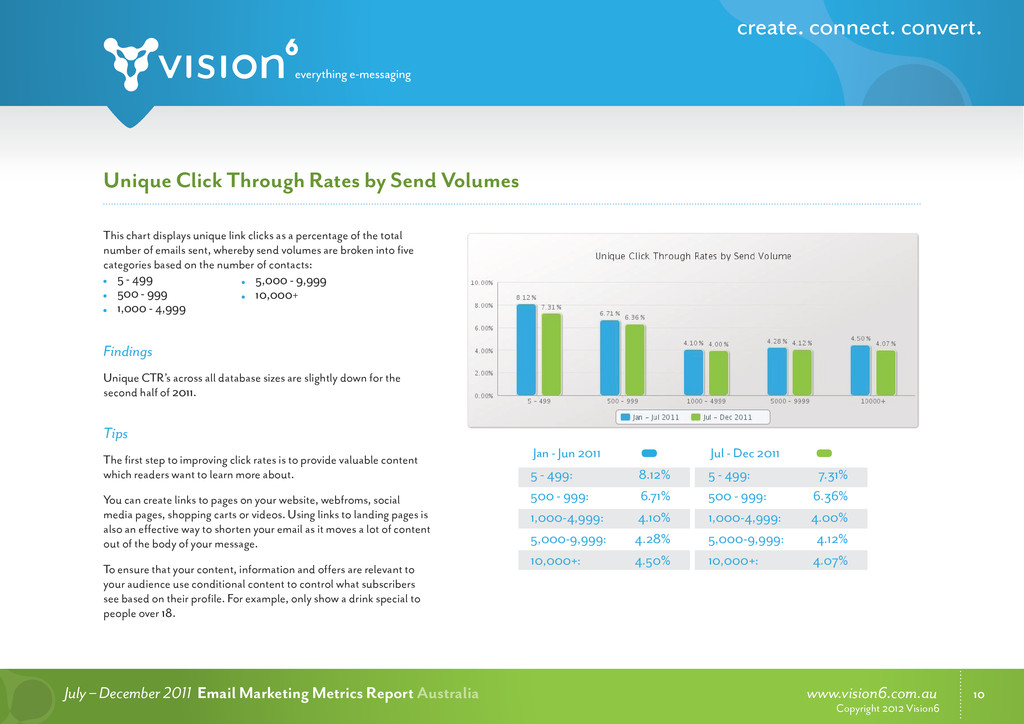
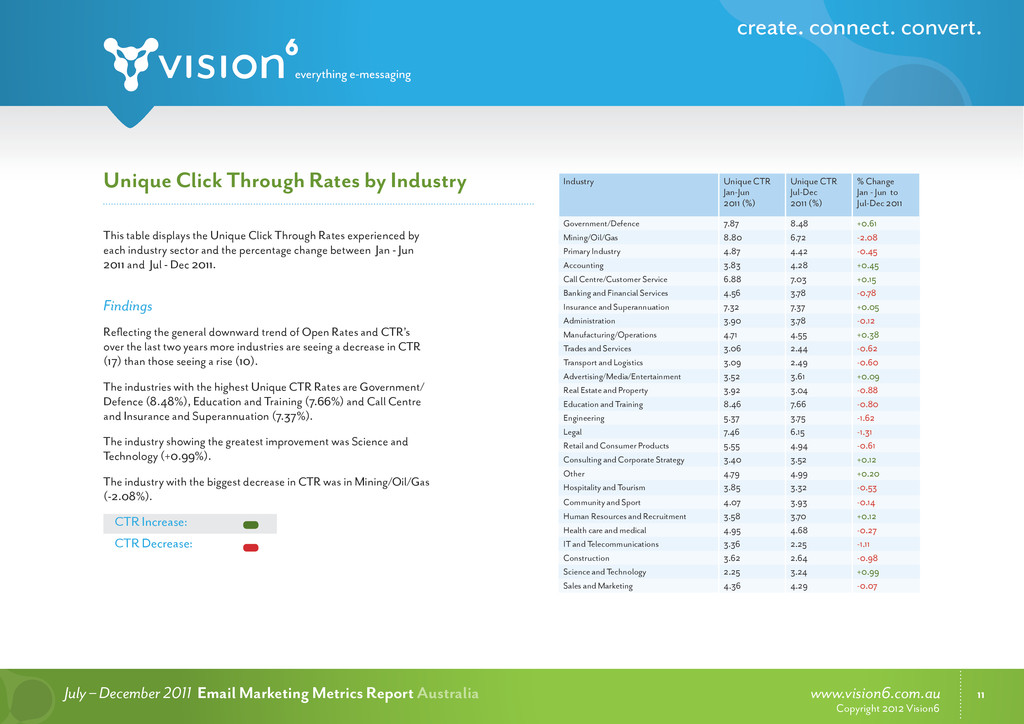
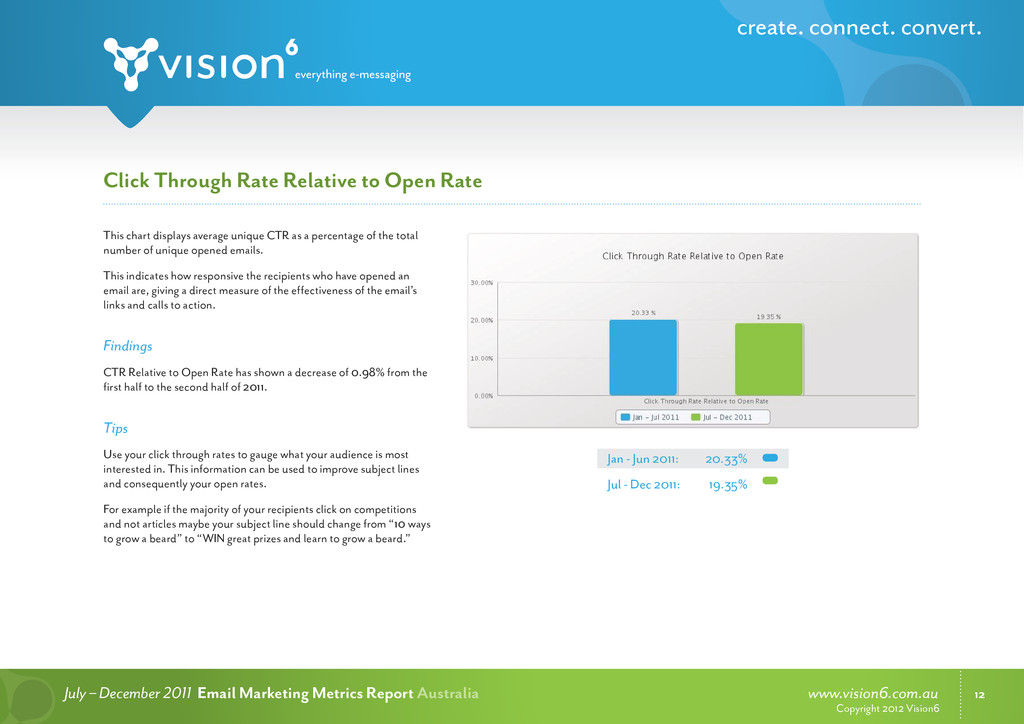
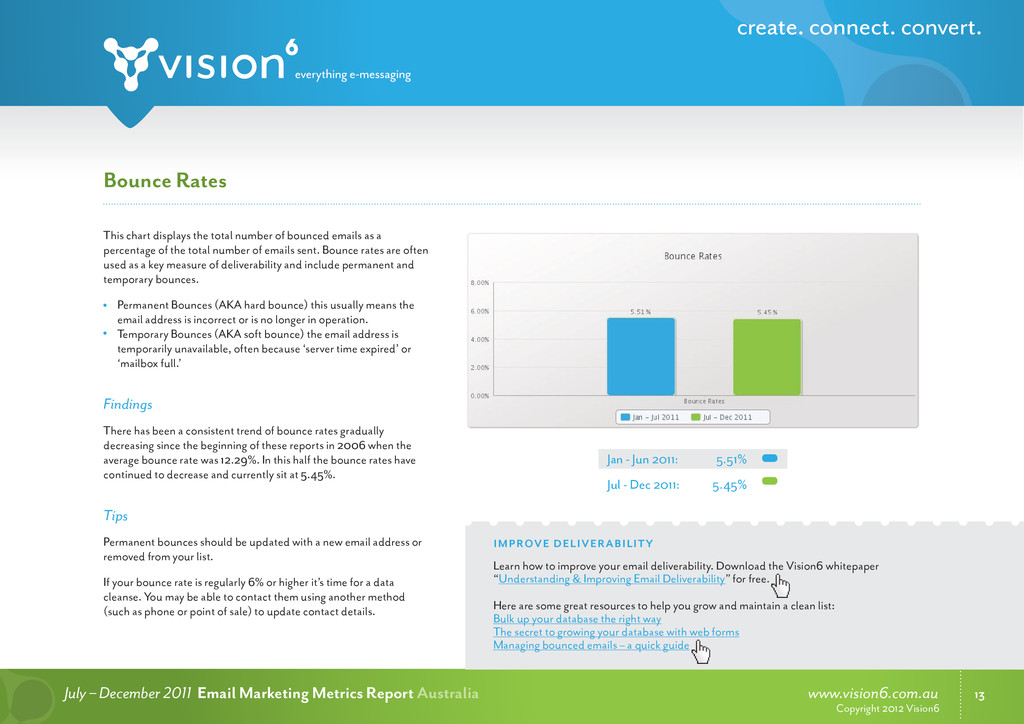
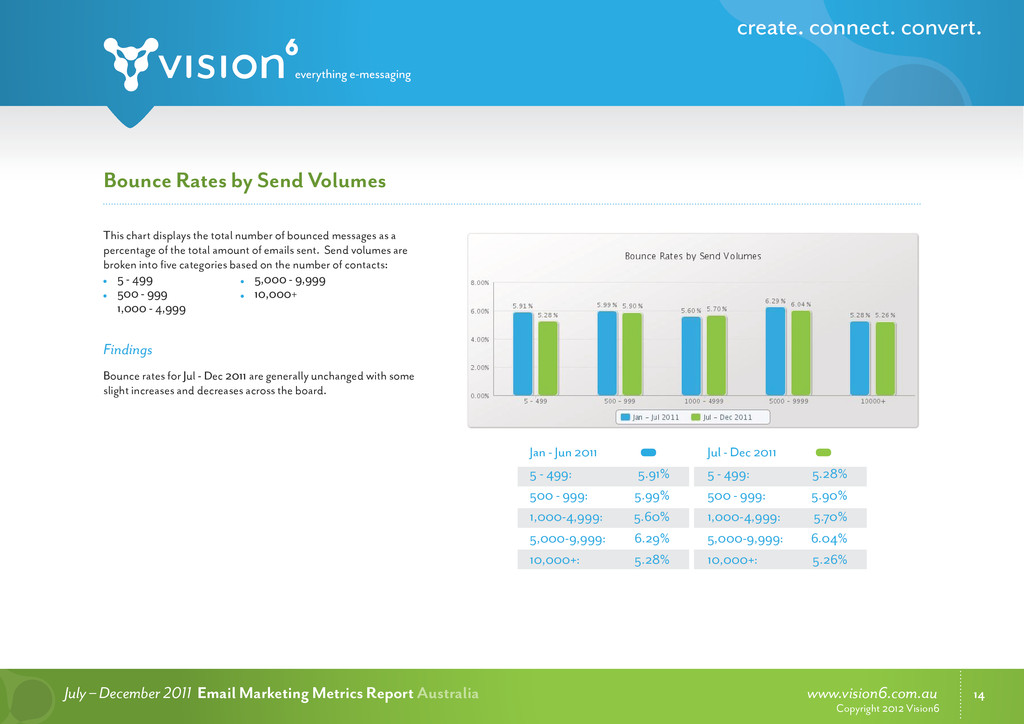
    Australia Copyright 2012 Vision6 Key Findings Summary Measurement Jul - Dec 2008 Jan - Jun 2009 Jul - Dec 2009 Jan - Jun 2010 Jul - Dec 2010 Jan - Jun 2011 Jul - Dec 2011 Overall Open Rate 22.52% 23.73% 25.16% 23.48% 22.34% 22.47 21.83 Open Rate By Send Volume 5-499: 34.36% 500-999: 31.04% 1,000+: 21.95% 5-499: 34.62% 500-999: 31.68% 1,000+: 23.22% 5-499: 34.96% 500-999: 31.49% 1,000+: 24.74% 5-499: 34.24% 500-999: 30.30% 1,000+: 22.98% 5-499: 34.27% 500-999: 30.56% 1,000+: 21.73% 5-499: 34.34% 500-999: 30.24% 1,000-4,999: 23.62% 5,000-9,999: 23.10% 10,000+: 20.96% 5-499: 33.17% 500-999: 29.99% 1,000-4,999: 24.07% 5,000-9,999: 24.44% 10,000+: 19.76% Top 3 Industries with Highest Open Rates Govt./Defence Accounting Call Centre/Cust Serv Govt./Defence Primary Industry Accounting Govt./Defence Mining/Oil/Gas Primary Industry Mining/Oil/Gas Legal Govt./Defence Mining/Oil/Gas Govt./Defence Transport/ Logistics Legal Govt./Defence Mining/Oil/Gas Legal Govt./Defence Mining/Oil/Gas Overall Click Through Rate 4.81% 4.59% 5.46% 4.77% 4.67% 4.57% 4.22% Click Through Rate By Send Volume 5-499: 8.82% 500-999: 7.34% 1,000+: 4.63% 5-499: 8.87% 500-999: 7.86% 1,000+: 4.39% 5-499: 8.86% 500-999: 7.74% 1,000+: 5.32% 5-499: 8.54% 500-999: 7.70% 1,000+: 4.59% 5-499: 8.26% 500-999: 6.60% 1,000+: 4.51% 5-499: 8.12% 500-999: 6.71% 1,000-4,999: 4.10% 5,000-9,999: 4.28% 10,000+: 4.50% 5-499: 7.31% 500-999: 6.36% 1,000-4,999: 4.00% 5,000-9,999: 4.12% 10,000+: 4.07% Top 3 Industries with Highest Click Through Rates Call Centre/Cust Serv Govt./Defence Primary Industry Call Centre/Cust Serv Mining/Oil/Gas Primary Industry Mining/Oil/Gas Call Centre/Cust Serv Accounting Call Centre/Cust Serv Mining/Oil/Gas Govt./Defence Transport/ Logistics Call Centre/Cust Serv Govt./Defence Mining/Oil/Gas Education Govt./Defence Mining/Oil/Gas Education Govt./Defence CTR Relative to Open Rates 21.37% 19.34% 21.72% 20.34% 20.92% 20.33% 19.35% Overall Bounce Rates 8.90% 7.22% 6.29% 5.75% 5.77% 5.51% 5.45% Bounce Rates by Send Volume 5-499: 7.25% 500-999: 7.68% 1,000+: 8.98% 5-499: 6.82% 500-999: 6.94% 1,000+: 7.24% 5-499: 6.52% 500-999: 6.77% 1,000+: 6.27% 5-499: 6.10% 500-999: 6.19% 1,000+: 5.73% 5-499: 5.89% 500-999: 6.19% 1,000+: 5.75% 5-499: 5.91% 500-999: 5.89% 1,000-4,999: 5.60% 5,000-9,999: 6.29% 10,000+: 5.28% 5-499: 5.28% 500-999: 5.90% 1,000-4,999: 5.70% 5,000-9,999: 6.04% 10,000+: 5.26% Top 3 Industries with Lowest Bounce Rates Legal Call Centre/Cust Serv Mining/Oil/Gas Legal Call Centre/Cust Serv Mining/Oil/Gas Legal Accounting Call Centre/Cust Serv Accounting Call Centre/Cust Serv Legal Administration Call Centre/Cust Serv Transport/ Logistics Call Centre/Cust Serv Legal Retail Trades and Services Engineering Administration Most Popular Day for Sends Friday Wednesday Wednesday Thursday Thursday Thursday Thursday New data segments started in 2011
  5. www.vision6.com.au 6 July – December 2011 Email Marketing Metrics Report

    Australia Copyright 2012 Vision6 Unique Open Rates This chart displays the total number of unique emails opened for the first time (as opposed to being opened multiple times by the same recipient) as a percentage of the total number of emails sent. A contact is deemed to have opened an email when either: images within the email are viewed or downloaded (even within the preview pane of the email client, eg Outlook); or when a link within the email is clicked on. Findings Unique Open Rates for Jul - Dec 2011 were only slightly lower than the first half of 2011. This seems to be a continuing trend since 2009. Tips Use a “from name” that your recipients will know and trust. This is typically a company name or in the case of smaller companies a Director or staff members name. Write a compelling subject line that entices recipients to open your email. Your subject line should be intriguing – you could ask a question or state a benefit. GET YOUR EMAIL OPENED If your email open rates are on the decline, then it’s a sign you are losing the attention of your subscribers. Here are some practical tips to help improve open rates for your next campaign: 3 surefire ways to improve email open rates Writing good email subject lines The shocking truth about email subject lines
  6. www.vision6.com.au 7 July – December 2011 Email Marketing Metrics Report

    Australia Copyright 2012 Vision6 Unique Open Rates by Send Volumes Jan - Jun 2011 5 - 499: 34.34% 500 - 999: 30.24% 1,000-4,999: 23.62% 5,000-9,999: 23.10% 10,000+: 20.96% Jul - Dec 2011 5 - 499: 33.17% 500 - 999: 29.99% 1,000-4,999: 24.07% 5,000-9,999: 24.44% 10,000+: 19.76% To remove any bias associated with large sends we have broken the Send Volumes into three categories based on the number of contacts: 5 - 499 500 - 999 1,000 - 4,999 Findings Unique open rates have remained very much the same since the last metrics report, with only slight variations. Email sends to smaller recipient lists continue to out perform those sent to larger lists. Tips If you have a large list try sending targeted emails to smaller segments so that readers receive highly relevant email content. 5,000 - 9,999 10,000+
  7. www.vision6.com.au 8 July – December 2011 Email Marketing Metrics Report

    Australia Copyright 2012 Vision6 This table displays Unique Open Rates for emails sent by key industry sectors and the percentage change between Jan - Jun 2011 and Jul- Dec 2011. Findings In this report 15 industries have experienced increasing open rates while only 12 industries have experienced decreasing open rates. The industries with the highest Unique Open Rates for Jul-Dec 2011 were Legal (32.82%) followed by Government/Defence (31.66%) and Mining/Oil/Gas (30.94%). The industries that have most improved since the last report are Primary Industry (+3.34%), Science and Technology (+2.90) and Mining/Oil/Gas (+2.47%). The industry with the biggest decrease in Unique Open Rates was IT and Telecommunications (-5.04%). Unique Open Rates by Industry Open Rates Increase: Open Rates Decrease: Industry Open Rate Jan - Jun 2011 (%) Open Rate Jul - Dec 2011 % Change Jan - Jun 2011 to Jul - Dec 2011 Government/Defence 30.69 31.66 +0.97 Mining/Oil/Gas 28.47 30.94 +2.47 Primary Industry 23.47 26.81 +3.34 Accounting 25.54 26.19 +0.65 Call Centre/Customer Service 25.51 25.92 +0.41 Banking and Financial Services 25.66 25.80 +0.14 Insurance and Superannuation 27.67 27.10 -0.57 Administration 23.76 24.27 +0.51 Manufacturing/Operations 25.78 26.38 +0.62 Trades and Services 23.30 21.45 -1.85 Transport and Logistics 21.88 22.89 +1.01 Advertising/Media/Entertainment 20.72 20.37 -0.35 Real Estate and Property 24.40 23.08 -1.32 Education and Training 25.68 24.66 -1.02 Engineering 25.73 22.90 -2.83 Legal 32.97 32.82 -0.15 Retail and Consumer Products 24.70 23.65 -1.05 Consulting and Corporate Strategy 18.56 18.23 -0.33 Other 24.47 25.85 +1.38 Hospitality and Tourism 19.70 19.82 +0.12 Community and Sport 22.79 23.63 +0.84 Human Resources and Recruitment 18.49 20.72 +2.23 Health care and medical 23.86 23.88 +0.02 IT and Telecommunications 22.74 17.70 -5.04 Construction 22.12 20.99 -1.13 Science and Technology 18.14 21.04 +2.90 Sales and Marketing 15.59 14.79 -0.80
  8. www.vision6.com.au 9 July – December 2011 Email Marketing Metrics Report

    Australia Copyright 2012 Vision6 6 things you can do to make your email look awesome 5 simple tips for improving email response rates This chart displays the total number of ‘unique link’ clicks as a percentage of the total number of emails sent. Findings Unique CTRs across all industries, domains and send volumes were lower than the first half of 2011 by 0.35%. (It only takes into account the first time an individual clicks on a link.) Tips The best way to increase your CTR is to make sure that your content is highly relevant and interesting. Include a strong call to action within the top 300 pixels of your email. Be clear on what action you want people to take from your email. A simple call to action with a link or relevant image can increase CTR’s. Consider changing the format of your email as this can have a dramatic effect on your CTR. Use headlines, colour, text formatting and images to enable quick scanning of your email so readers can easily recognise what you’re asking them to do. Unique Click Through Rates Jan - Jun 2011: 4.57% Jul - Dec 2011: 4.22% DESIGNING YOUR EMAIL For further information about how email design can help you to improve your click through rates check out our free “The A-Z of Email Design” whitepaper. Here are some practical tips to improve your CTR: Anatomy of a great email newsletter Cool email ideas that don’t require Photoshop
  9. www.vision6.com.au 10 July – December 2011 Email Marketing Metrics Report

    Australia Copyright 2012 Vision6 Unique Click Through Rates by Send Volumes This chart displays unique link clicks as a percentage of the total number of emails sent, whereby send volumes are broken into five categories based on the number of contacts: 5 - 499 500 - 999 1,000 - 4,999 Findings Unique CTR’s across all database sizes are slightly down for the second half of 2011. Tips The first step to improving click rates is to provide valuable content which readers want to learn more about. You can create links to pages on your website, webfroms, social media pages, shopping carts or videos. Using links to landing pages is also an effective way to shorten your email as it moves a lot of content out of the body of your message. To ensure that your content, information and offers are relevant to your audience use conditional content to control what subscribers see based on their profile. For example, only show a drink special to people over 18. Jan - Jun 2011 5 - 499: 8.12% 500 - 999: 6.71% 1,000-4,999: 4.10% 5,000-9,999: 4.28% 10,000+: 4.50% Jul - Dec 2011 5 - 499: 7.31% 500 - 999: 6.36% 1,000-4,999: 4.00% 5,000-9,999: 4.12% 10,000+: 4.07% 5,000 - 9,999 10,000+
  10. www.vision6.com.au 11 July – December 2011 Email Marketing Metrics Report

    Australia Copyright 2012 Vision6 This table displays the Unique Click Through Rates experienced by each industry sector and the percentage change between Jan - Jun 2011 and Jul - Dec 2011. Findings Reflecting the general downward trend of Open Rates and CTR’s over the last two years more industries are seeing a decrease in CTR (17) than those seeing a rise (10). The industries with the highest Unique CTR Rates are Government/ Defence (8.48%), Education and Training (7.66%) and Call Centre and Insurance and Superannuation (7.37%). The industry showing the greatest improvement was Science and Technology (+0.99%). The industry with the biggest decrease in CTR was in Mining/Oil/Gas (-2.08%). Unique Click Through Rates by Industry CTR Increase: CTR Decrease: Industry Unique CTR Jan-Jun 2011 (%) Unique CTR Jul-Dec 2011 (%) % Change Jan - Jun to Jul-Dec 2011 Government/Defence 7.87 8.48 +0.61 Mining/Oil/Gas 8.80 6.72 -2.08 Primary Industry 4.87 4.42 -0.45 Accounting 3.83 4.28 +0.45 Call Centre/Customer Service 6.88 7.03 +0.15 Banking and Financial Services 4.56 3.78 -0.78 Insurance and Superannuation 7.32 7.37 +0.05 Administration 3.90 3.78 -0.12 Manufacturing/Operations 4.71 4.55 +0.38 Trades and Services 3.06 2.44 -0.62 Transport and Logistics 3.09 2.49 -0.60 Advertising/Media/Entertainment 3.52 3.61 +0.09 Real Estate and Property 3.92 3.04 -0.88 Education and Training 8.46 7.66 -0.80 Engineering 5.37 3.75 -1.62 Legal 7.46 6.15 -1.31 Retail and Consumer Products 5.55 4.94 -0.61 Consulting and Corporate Strategy 3.40 3.52 +0.12 Other 4.79 4.99 +0.20 Hospitality and Tourism 3.85 3.32 -0.53 Community and Sport 4.07 3.93 -0.14 Human Resources and Recruitment 3.58 3.70 +0.12 Health care and medical 4.95 4.68 -0.27 IT and Telecommunications 3.36 2.25 -1.11 Construction 3.62 2.64 -0.98 Science and Technology 2.25 3.24 +0.99 Sales and Marketing 4.36 4.29 -0.07
  11. www.vision6.com.au 12 July – December 2011 Email Marketing Metrics Report

    Australia Copyright 2012 Vision6 This chart displays average unique CTR as a percentage of the total number of unique opened emails. This indicates how responsive the recipients who have opened an email are, giving a direct measure of the effectiveness of the email’s links and calls to action. Findings CTR Relative to Open Rate has shown a decrease of 0.98% from the first half to the second half of 2011. Tips Use your click through rates to gauge what your audience is most interested in. This information can be used to improve subject lines and consequently your open rates. For example if the majority of your recipients click on competitions and not articles maybe your subject line should change from “10 ways to grow a beard” to “WIN great prizes and learn to grow a beard.” Jan - Jun 2011: 20.33% Jul - Dec 2011: 19.35% Click Through Rate Relative to Open Rate
  12. www.vision6.com.au 13 July – December 2011 Email Marketing Metrics Report

    Australia Copyright 2012 Vision6 This chart displays the total number of bounced emails as a percentage of the total number of emails sent. Bounce rates are often used as a key measure of deliverability and include permanent and temporary bounces. Permanent Bounces (AKA hard bounce) this usually means the email address is incorrect or is no longer in operation. Temporary Bounces (AKA soft bounce) the email address is temporarily unavailable, often because ‘server time expired’ or ‘mailbox full.’ Findings There has been a consistent trend of bounce rates gradually decreasing since the beginning of these reports in 2006 when the average bounce rate was 12.29%. In this half the bounce rates have continued to decrease and currently sit at 5.45%. Tips Permanent bounces should be updated with a new email address or removed from your list. If your bounce rate is regularly 6% or higher it’s time for a data cleanse. You may be able to contact them using another method (such as phone or point of sale) to update contact details. Bounce Rates Jan - Jun 2011: 5.51% Jul - Dec 2011: 5.45% Learn how to improve your email deliverability. Download the Vision6 whitepaper “Understanding & Improving Email Deliverability” for free. Here are some great resources to help you grow and maintain a clean list: Bulk up your database the right way The secret to growing your database with web forms Managing bounced emails – a quick guide IMPROVE DELIVERABILITY
  13. www.vision6.com.au 14 July – December 2011 Email Marketing Metrics Report

    Australia Copyright 2012 Vision6 Bounce Rates by Send Volumes Jan - Jun 2011 5 - 499: 5.91% 500 - 999: 5.99% 1,000-4,999: 5.60% 5,000-9,999: 6.29% 10,000+: 5.28% Jul - Dec 2011 5 - 499: 5.28% 500 - 999: 5.90% 1,000-4,999: 5.70% 5,000-9,999: 6.04% 10,000+: 5.26% This chart displays the total number of bounced messages as a percentage of the total amount of emails sent. Send volumes are broken into five categories based on the number of contacts: 5 - 499 500 - 999 1,000 - 4,999 Findings Bounce rates for Jul - Dec 2011 are generally unchanged with some slight increases and decreases across the board. 5,000 - 9,999 10,000+
  14. www.vision6.com.au 15 July – December 2011 Email Marketing Metrics Report

    Australia Copyright 2012 Vision6 This table displays Bounce Rates by industry. To understand this table you need to be aware that: Increasing Bounce Rates are adverse. This is why an increasing percentage change is coloured red. Decreasing Bounce Rates are ideal. This is why a decreasing percentage change is coloured green. Findings Trades and Services achieved the lowest bounce rate (2.90%) and showed the greatest improvement reducing their bounce rate by 8.42%. The worst performing industries were: Science and Technology (15.27%), Manufacturing and Operations (10.47%), Construction (10.02%). Bounce Rates by Industry Industry Bounce Rate Jan - Jun 2011 (%) Bounce Rate Jul - Dec 2011 (%) % Change Jan - Jun 2011 to Jul-Dec Government/ Defence 4.94 4.43 -0.51 Mining/Oil/Gas 5.49 6.22 +0.73 Primary Industry 5.80 5.15 -0.65 Accounting 5.87 7.33 +1.46 Call Centre/ Customer Service 2.86 3.29 +0.43 Banking and Financial Services 8.66 9.82 +1.16 Insurance and Superannuation 6.84 7.01 +0.17 Administration 6.07 4.18 -1.89 Manufacturing/ Operations 7.20 10.47 +3.27 Trades and Services 11.39 2.90 -8.42 Transport and Logistics 5.59 5.37 -0.22 Advertising/ Media/ Entertainment 5.72 4.84 -0.88 Real Estate and Property 5.19 5.81 +0.62 Education and Training 5.92 6.42 +0.50 Engineering 5.38 6.68 +1.30 Legal 3.04 3.05 -0.01 Retail and Consumer Products 3.51 4.55 +1.04 Consulting and Corporate Strategy 9.26 9.18 -0.08 Other 6.68 5.87 -0.81 Hospitality and Tourism 5.65 4.66 -0.99 Community and Sport 7.18 5.83 -1.35 Human Resources and Recruitment 9.28 9.80 +0.52 Healthcare and medical 6.90 7.74 +0.84 IT and Telecommunications 8.10 8.57 +0.47 Construction 11.30 10.02 -1.28 Science and Technology 11.39 15.27 +3.88 Sales and Marketing 6.66 6.41 -0.25 Bounce Rate Increase: Bounce Rate Decrease:
  15. www.vision6.com.au 16 July – December 2011 Email Marketing Metrics Report

    Australia Copyright 2012 Vision6 These charts display the top 15 domains by send volume and their associated Open Rates and CTRs. Findings The top 15 domains are all web and ISP based accounts. No business or government domain was listed in the top 15. hotmail.com once again received almost five times as many emails as any other domain (20.49%). gmail.com (7.94%) has over taken bigpond.net.au (7.89%) at the top end of the spectrum. tpg.com.au and iinet.net.au were joined by xtra.co.nz achieving the highest open rates of any domain with rates of over 30%. Send Volumes, Open & CTR for the Top 15 Domains % Volume Jan - Jun 2011 % Volume Jul - Dec 2011 % Opened % Clicked
  16. www.vision6.com.au 17 July – December 2011 Email Marketing Metrics Report

    Australia Copyright 2012 Vision6 Open, CTR & Emails Sent by Day These charts display the average Open Rates and CTRs by day, and the total amount of emails sent on each day for the first half of 2011 and second half of 2011. Findings All days of the week are seeing quite even open and click-through rates. Thursday was the day on which the most emails were sent, despite having fairly average open and click through rates (21.57%). Tips Know your audience and their habits and routines. Then test, test and test some more. A simple way to do this is to send the same email to different parts of your database on different days. % Volume Jan - Jun 2011 % Volume Jul - Dec 2011 % Opened % Clicked
  17. www.vision6.com.au 18 July – December 2011 Email Marketing Metrics Report

    Australia Copyright 2012 Vision6 This chart displays the amount of time it takes for recipients to open the email after it has been received. Findings The number of emails opened within the first hour of delivery has risen from 28.60% in Jan-Jun 2011 to 29.46% in Jul - Dec 2011. 90.72% of all emails are opened within the first 72 hours of being received. This number has been increasing since these reports began in 2006 Tips As smart phones become more and more prominent the time it takes to open emails is decreasing. With this in mind it is always good to test your email across mobile platforms. Try to design your emails with mobile screen sizes in mind. Time Taken to Open Emails
  18. www.vision6.com.au 19 July – December 2011 Email Marketing Metrics Report

    Australia Copyright 2012 Vision6 This chart shows the popularity of the different email clients people use to first open their emails. Email clients can be categorised as the following: Desktop application: Outlook 2003, Outlook 2007, Apple Mail, Outlook 2010 and Thunderbird. Web-based interface: Hotmail, Yahoo! Mail and Gmail. Mobile device: iPhone Mail or iPad Mail. Findings The most popular email clients used in July - Dec 2011 were Outlook 2003 (22.24%), Hotmail (16.21%), iPhone Mail (15.14%) and Other (20.11%). Over 18% of opened email was read on mobile devices (iPhone 15.14% and iPad 3.74%) this is up from 10% in the last report. With the increasing popularity of smart phones, it is reasonable to expect this figure to rise in the future. Which email clients are people using? Visit the Vision6 Blog for some practical design tips for designing emails for mobile devices: Mobile email design tips Further information Like to see how your email looks in the above email clients? Email Testing
  19. www.vision6.com.au 20 July – December 2011 Email Marketing Metrics Report

    Australia Copyright 2012 Vision6 Glossary & Acronyms EDM Electronic Direct Marketing. ISP Internet Service Provider, e.g. BigPond. CTRs Click Through Rates. Unique CTR Measures the first time a link is clicked by a recipient as a percentage of the total number of emails sent. CTR Relative to Open Measures the CTR as a percentage of the total number of unique opened emails. Open Rate Measures the number of times an email is opened by a recipient as a percentage of the total number of emails sent. Unique Open Rate Measures the first time an email is opened by a recipient as a percentage of the total number of emails sent. Permanent Bounce Usually means the email address is incorrect or is no longer in operation – sometimes referred to as a Hard Bounce. Temporary Bounce Usually means the email address is temporarily unavailable. The most common Temporary Bounce reasons are ‘Server Time Expired’ (for receiving ISP), ‘Delivery Time Expired’ (for sending ISP) and ‘Mailbox Full’ – sometimes referred to as a Soft Bounce. more infromation Find out more about specific email marketing metrics, what they mean and how they can help you.