Upgrade to Pro — share decks privately, control downloads, hide ads and more …

Team lcolladotor Journal Club Nov 2026

Sponsored · Your Podcast. Everywhere. Effortlessly. Share. Educate. Inspire. Entertain. You do you. We'll handle the rest. →

Team lcolladotor Journal Club Nov 2026

Team lcolladotor Journal Club Presentation: "Polygenic enrichment distinguishes disease associations of individual cells in single-cell RNA-seq data"
doi: https://doi.org/10.1038/s41588-022-01167-z
Presented By: Manisha Barse
Date: Nvember 18, 2026

The paper introduces scDRS, a computational method that integrates GWAS and single-cell RNA-seq data to identify disease-associated cells at single-cell resolution. It highlights how disease associations vary within traditionally defined cell types, revealing distinct cell subpopulations and states relevant to complex diseases.

#GWAS #scRNAseq #MAGMA #scDRS

Manisha Barse

November 18, 2026

Transcript

23 slides
  1. Team lcolladotor Journal Club Polygenic enrichment distinguishes disease associations of

    individual cells in single-cell RNA-seq data Zhang, Hou, Dey et al. | Nature Genetics 54, 1572–1580 (2022) | https://doi.org/10.1038/s41588-022-01167-z Presented By Manisha Barse November 18, 2026 1
  2. single-cell disease relevance score (scDRS): linking genetic risk to individual

    cells Core question Which individual cells show unexpectedly high expression of genes prioritized by disease GWAS? Today’s presentation: Concept → scoring → empirical significance → interpretation → documentation 1
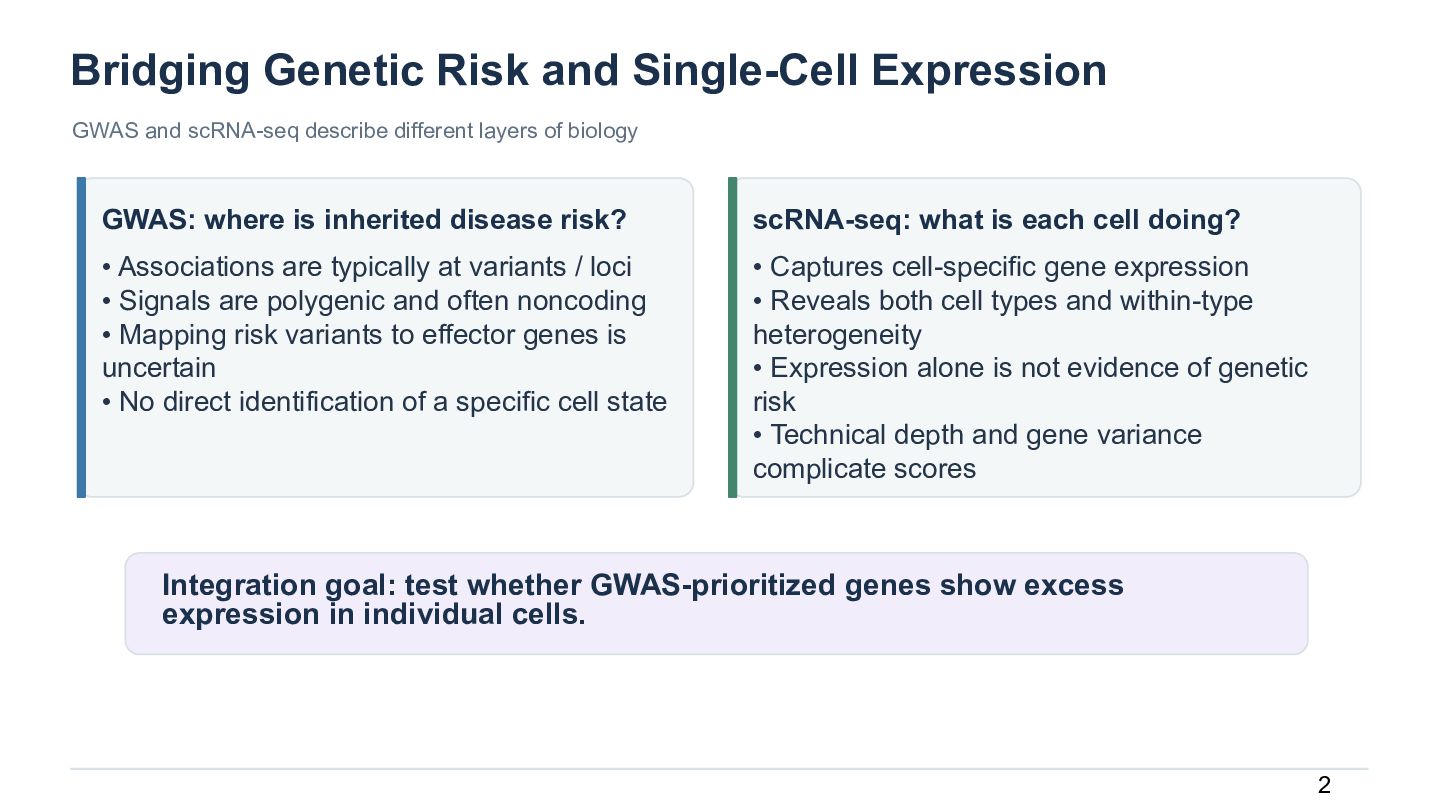
  3. Bridging Genetic Risk and Single-Cell Expression GWAS and scRNA-seq describe

    different layers of biology GWAS: where is inherited disease risk? scRNA-seq: what is each cell doing? • Associations are typically at variants / loci • Signals are polygenic and often noncoding • Mapping risk variants to effector genes is uncertain • No direct identification of a specific cell state • Captures cell-specific gene expression • Reveals both cell types and within-type heterogeneity • Expression alone is not evidence of genetic risk • Technical depth and gene variance complicate scores Integration goal: test whether GWAS-prioritized genes show excess expression in individual cells. 2
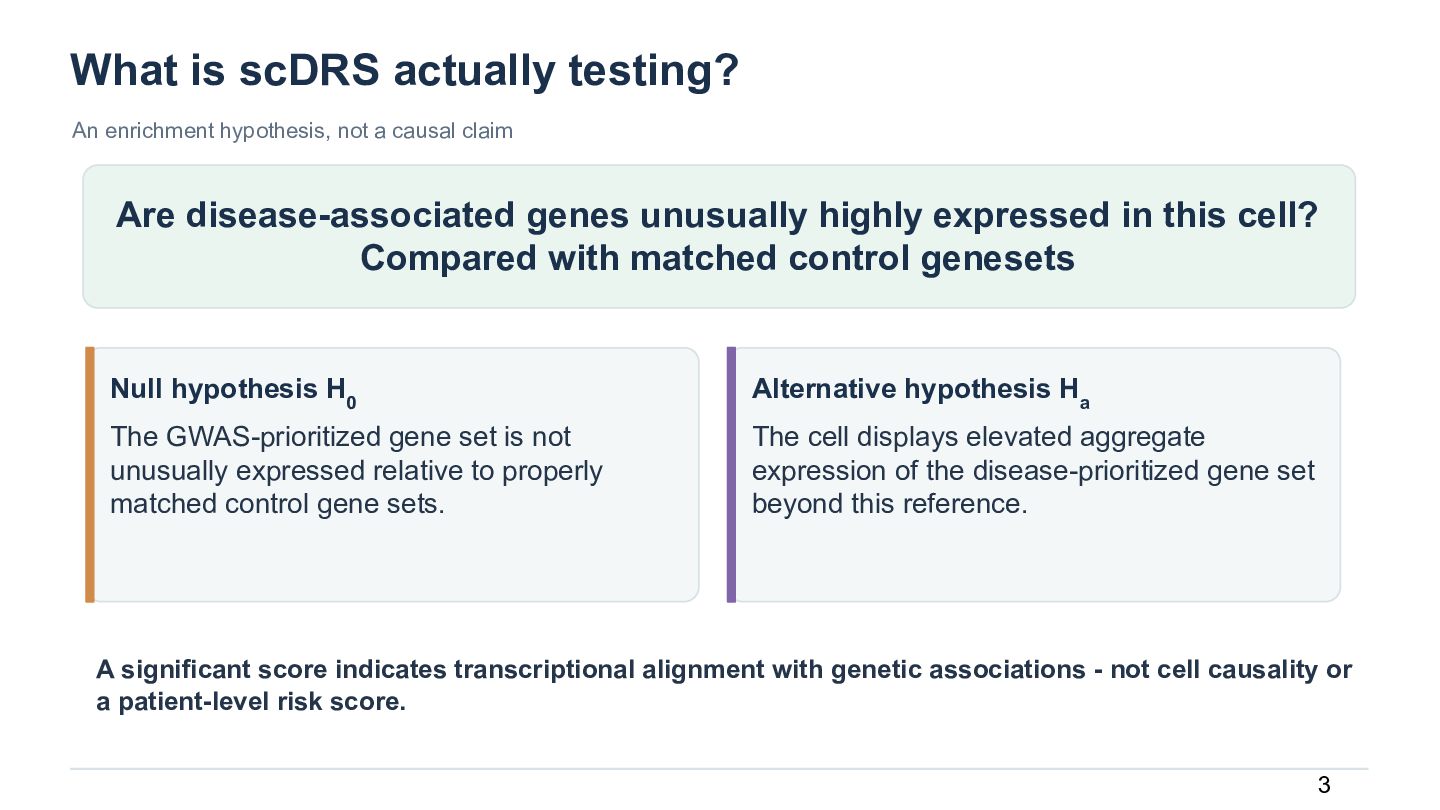
  4. What is scDRS actually testing? An enrichment hypothesis, not a

    causal claim Are disease-associated genes unusually highly expressed in this cell? Compared with matched control genesets Null hypothesis H0 Alternative hypothesis Ha The GWAS-prioritized gene set is not unusually expressed relative to properly matched control gene sets. The cell displays elevated aggregate expression of the disease-prioritized gene set beyond this reference. A significant score indicates transcriptional alignment with genetic associations - not cell causality or a patient-level risk score. 3
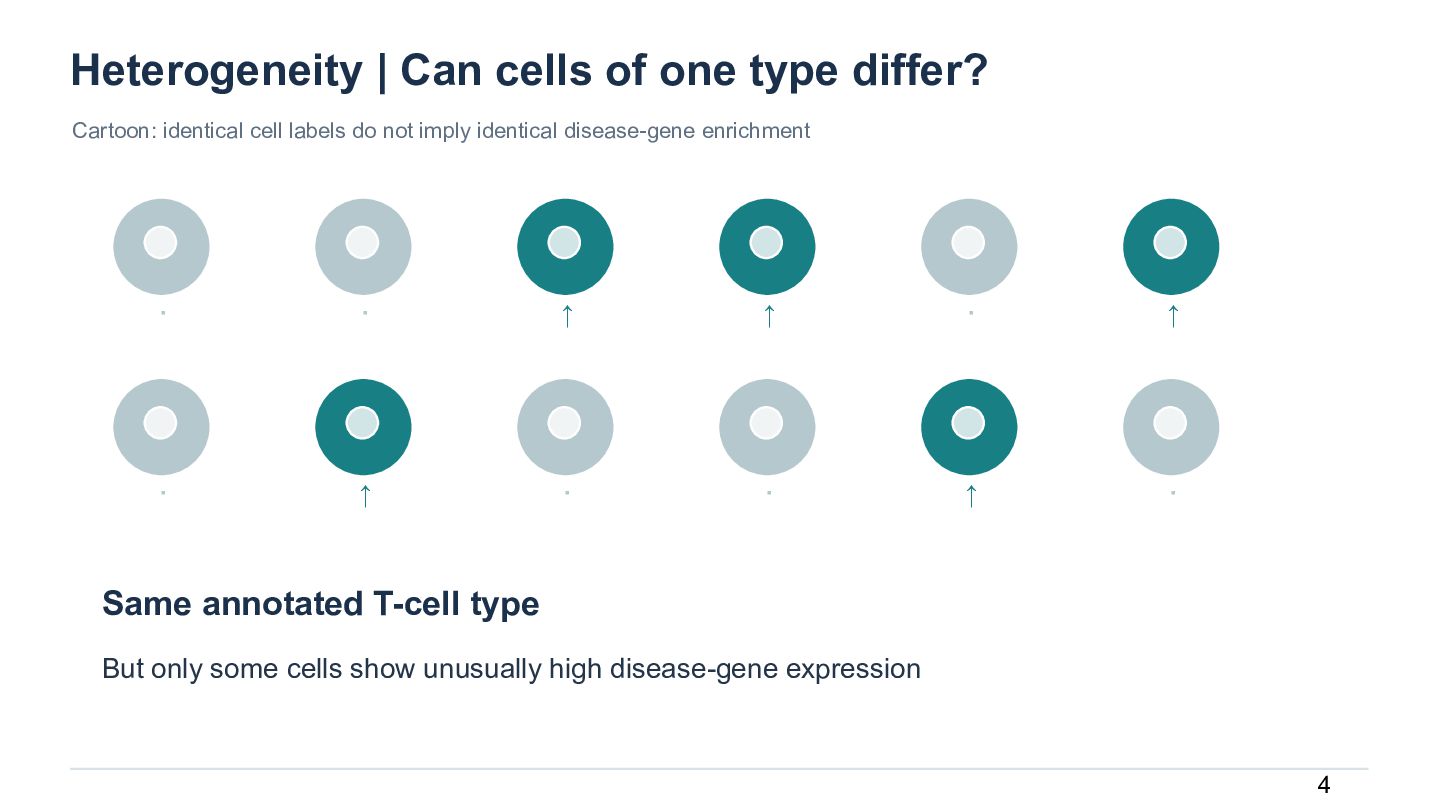
  5. Heterogeneity | Can cells of one type differ? Cartoon: identical

    cell labels do not imply identical disease-gene enrichment · · ↑ ↑ · ↑ · ↑ · · ↑ · Same annotated T-cell type But only some cells show unusually high disease-gene expression 4
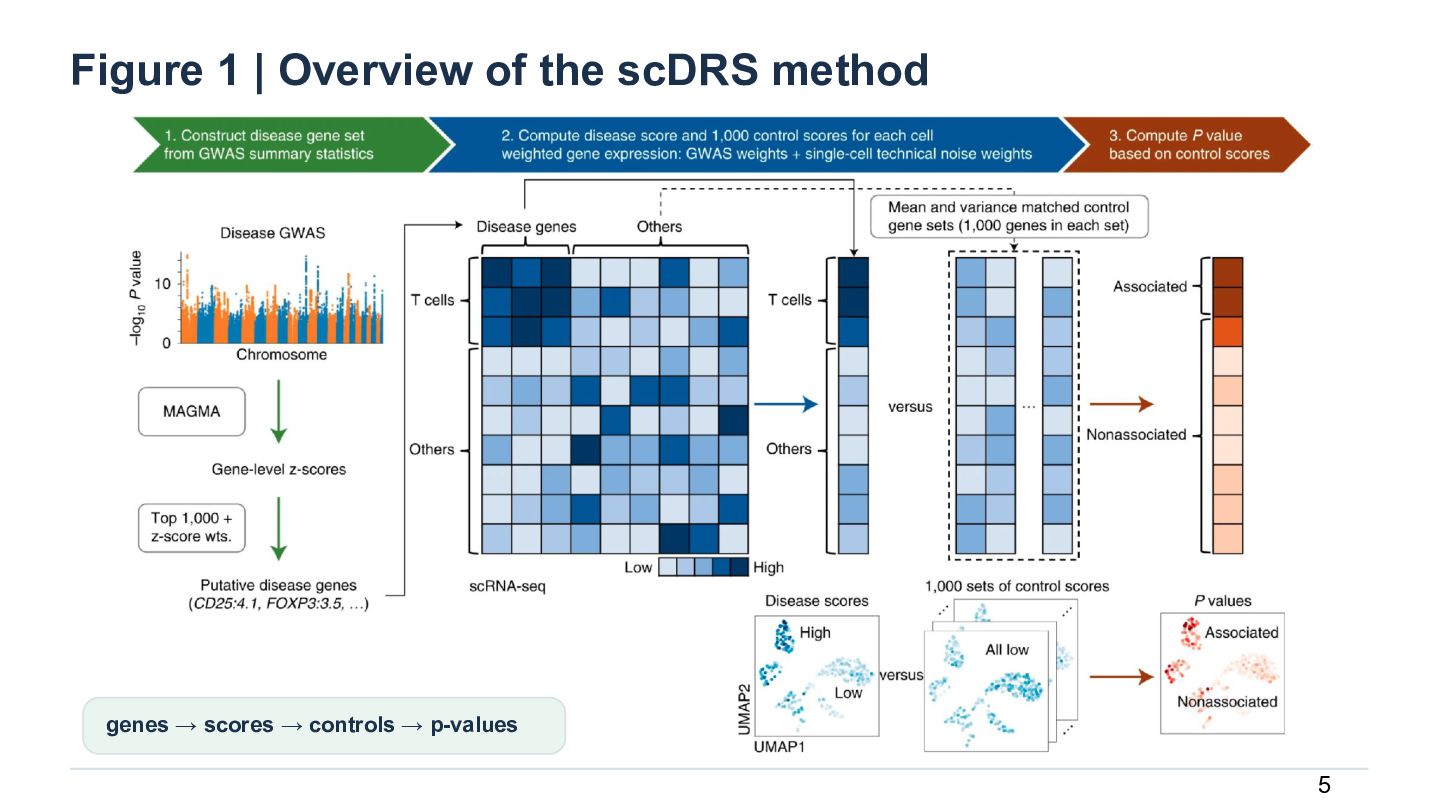
  6. Figure 1 | Overview of the scDRS method genes →

    scores → controls → p-values 5
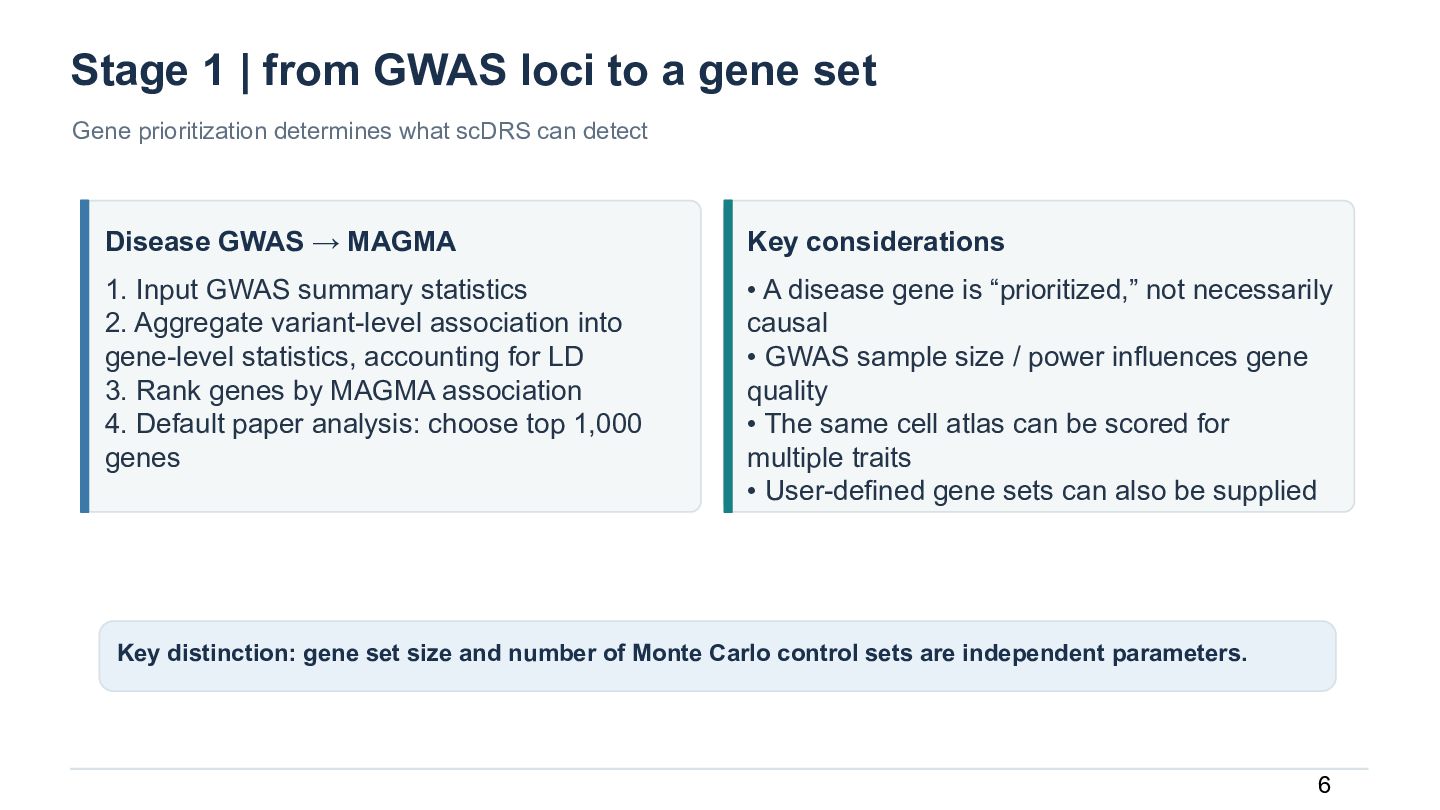
  7. Stage 1 | from GWAS loci to a gene set

    Gene prioritization determines what scDRS can detect Disease GWAS → MAGMA Key considerations 1. Input GWAS summary statistics 2. Aggregate variant-level association into gene-level statistics, accounting for LD 3. Rank genes by MAGMA association 4. Default paper analysis: choose top 1,000 genes • A disease gene is “prioritized,” not necessarily causal • GWAS sample size / power influences gene quality • The same cell atlas can be scored for multiple traits • User-defined gene sets can also be supplied Key distinction: gene set size and number of Monte Carlo control sets are independent parameters. 6
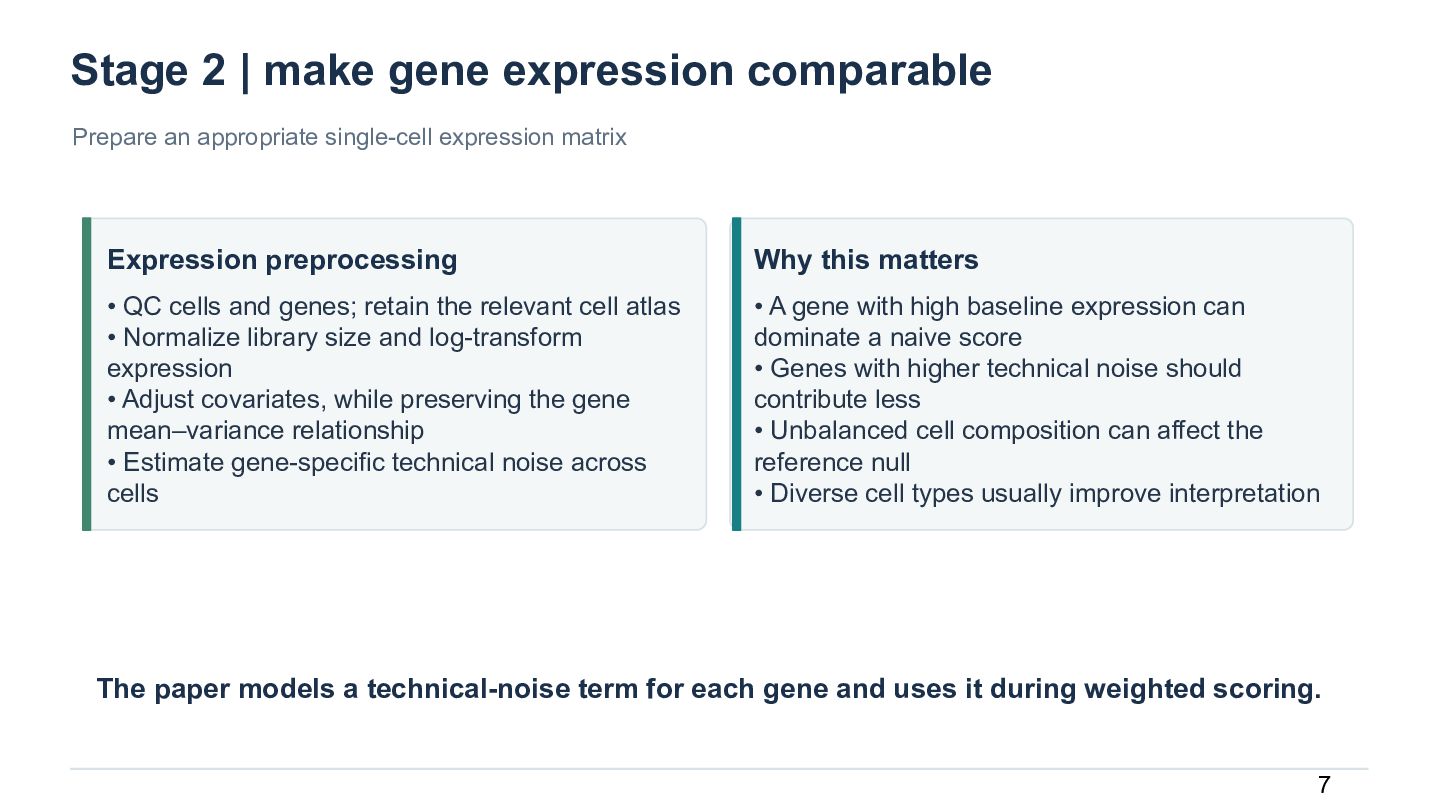
  8. Stage 2 | make gene expression comparable Prepare an appropriate

    single-cell expression matrix Expression preprocessing Why this matters • QC cells and genes; retain the relevant cell atlas • Normalize library size and log-transform expression • Adjust covariates, while preserving the gene mean–variance relationship • Estimate gene-specific technical noise across cells • A gene with high baseline expression can dominate a naive score • Genes with higher technical noise should contribute less • Unbalanced cell composition can affect the reference null • Diverse cell types usually improve interpretation The paper models a technical-noise term for each gene and uses it during weighted scoring. 7
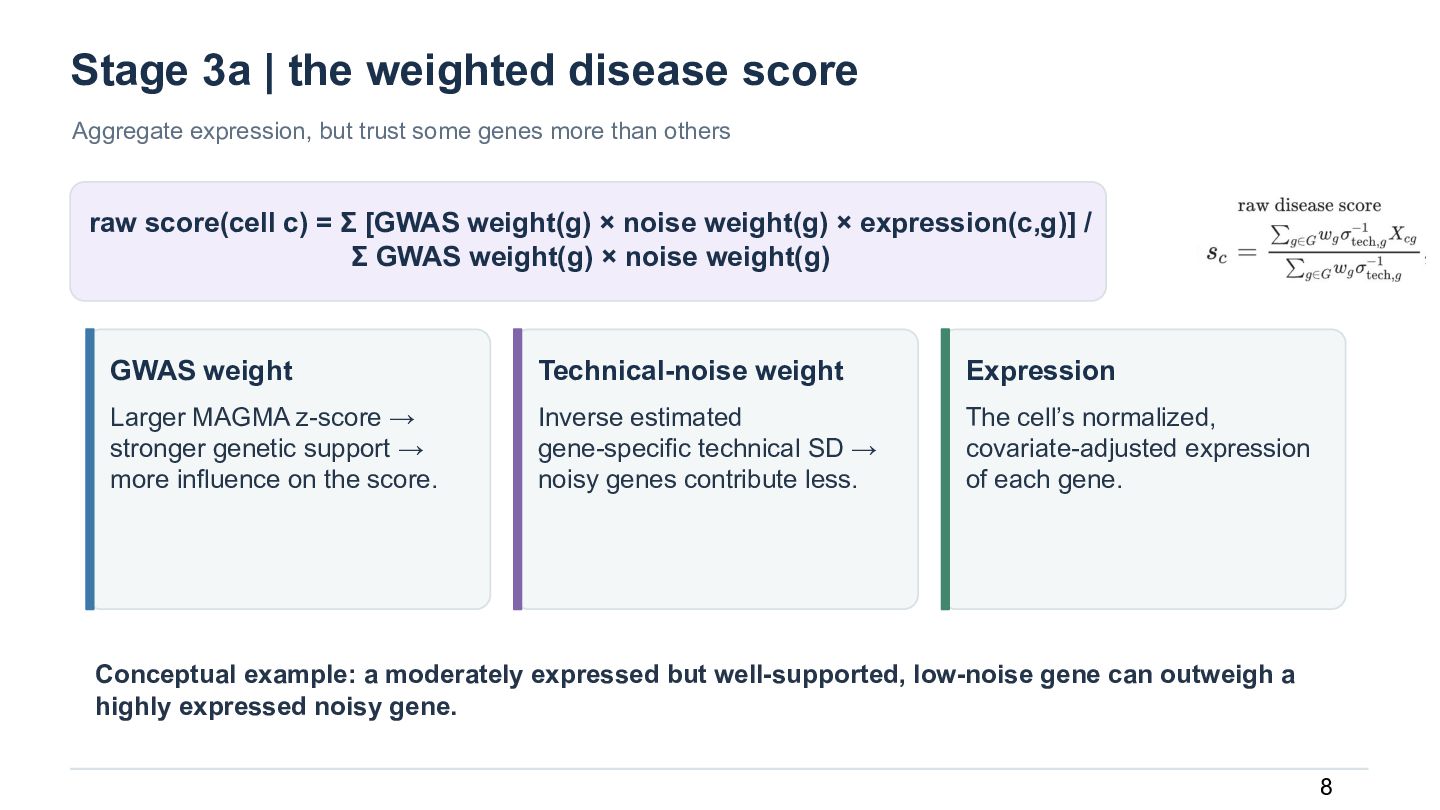
  9. Stage 3a | the weighted disease score Aggregate expression, but

    trust some genes more than others raw score(cell c) = Σ [GWAS weight(g) × noise weight(g) × expression(c,g)] / Σ GWAS weight(g) × noise weight(g) GWAS weight Technical-noise weight Expression Larger MAGMA z-score → stronger genetic support → more influence on the score. Inverse estimated gene-specific technical SD → noisy genes contribute less. The cell’s normalized, covariate-adjusted expression of each gene. Conceptual example: a moderately expressed but well-supported, low-noise gene can outweigh a highly expressed noisy gene. 8
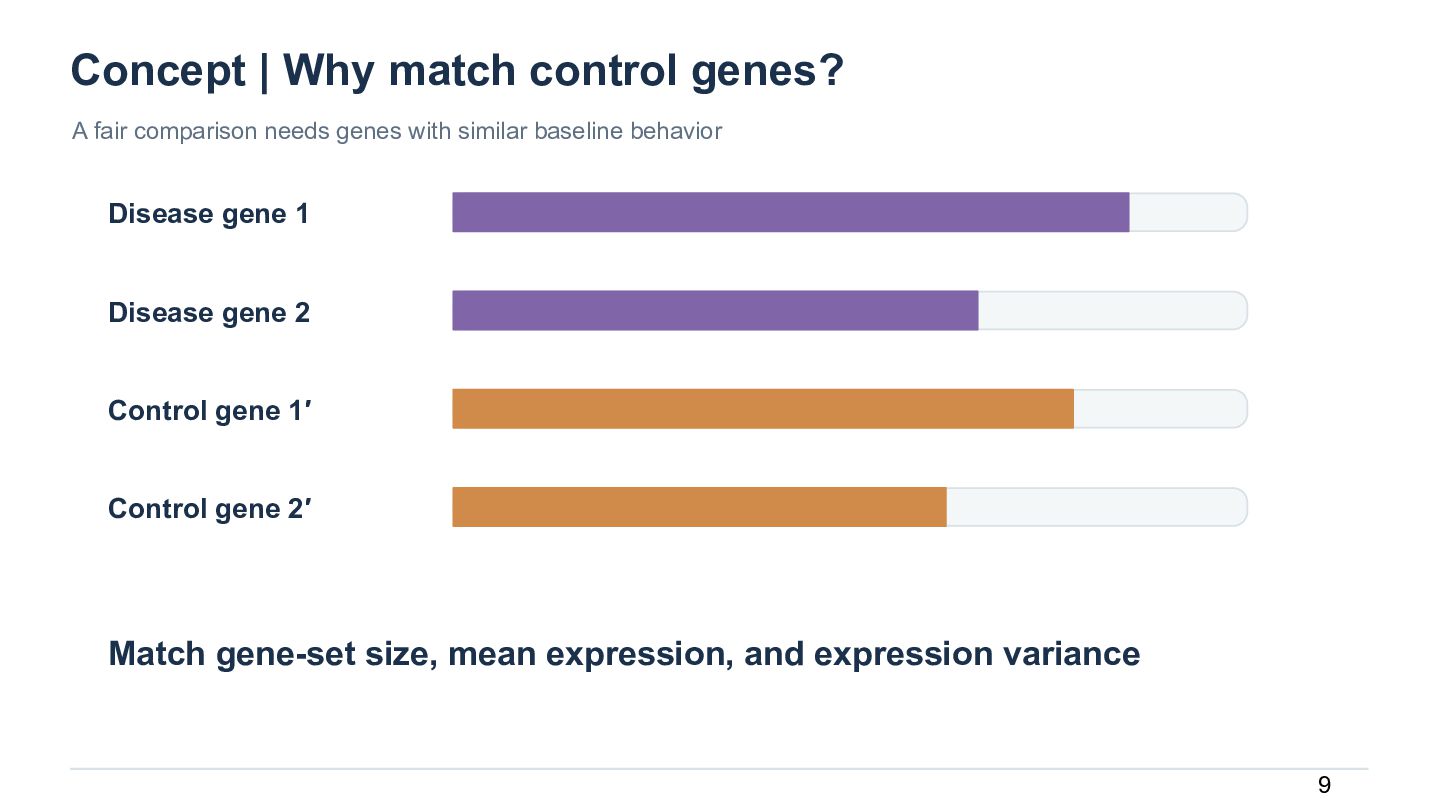
  10. Concept | Why match control genes? A fair comparison needs

    genes with similar baseline behavior Disease gene 1 Disease gene 2 Control gene 1′ Control gene 2′ Match gene-set size, mean expression, and expression variance 9
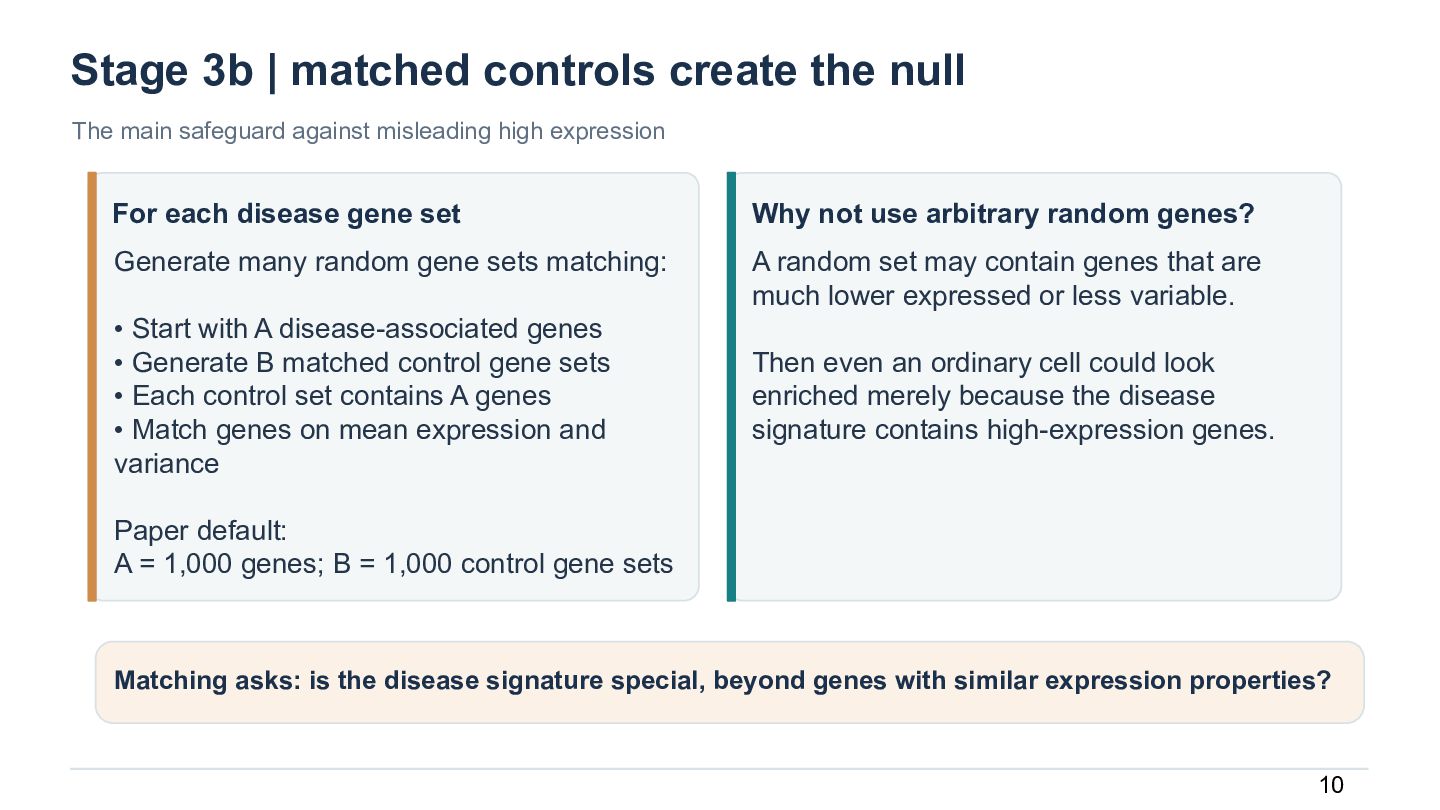
  11. Stage 3b | matched controls create the null The main

    safeguard against misleading high expression For each disease gene set Why not use arbitrary random genes? Generate many random gene sets matching: A random set may contain genes that are much lower expressed or less variable. • Start with A disease-associated genes • Generate B matched control gene sets • Each control set contains A genes • Match genes on mean expression and variance Then even an ordinary cell could look enriched merely because the disease signature contains high-expression genes. Paper default: A = 1,000 genes; B = 1,000 control gene sets Matching asks: is the disease signature special, beyond genes with similar expression properties? 10
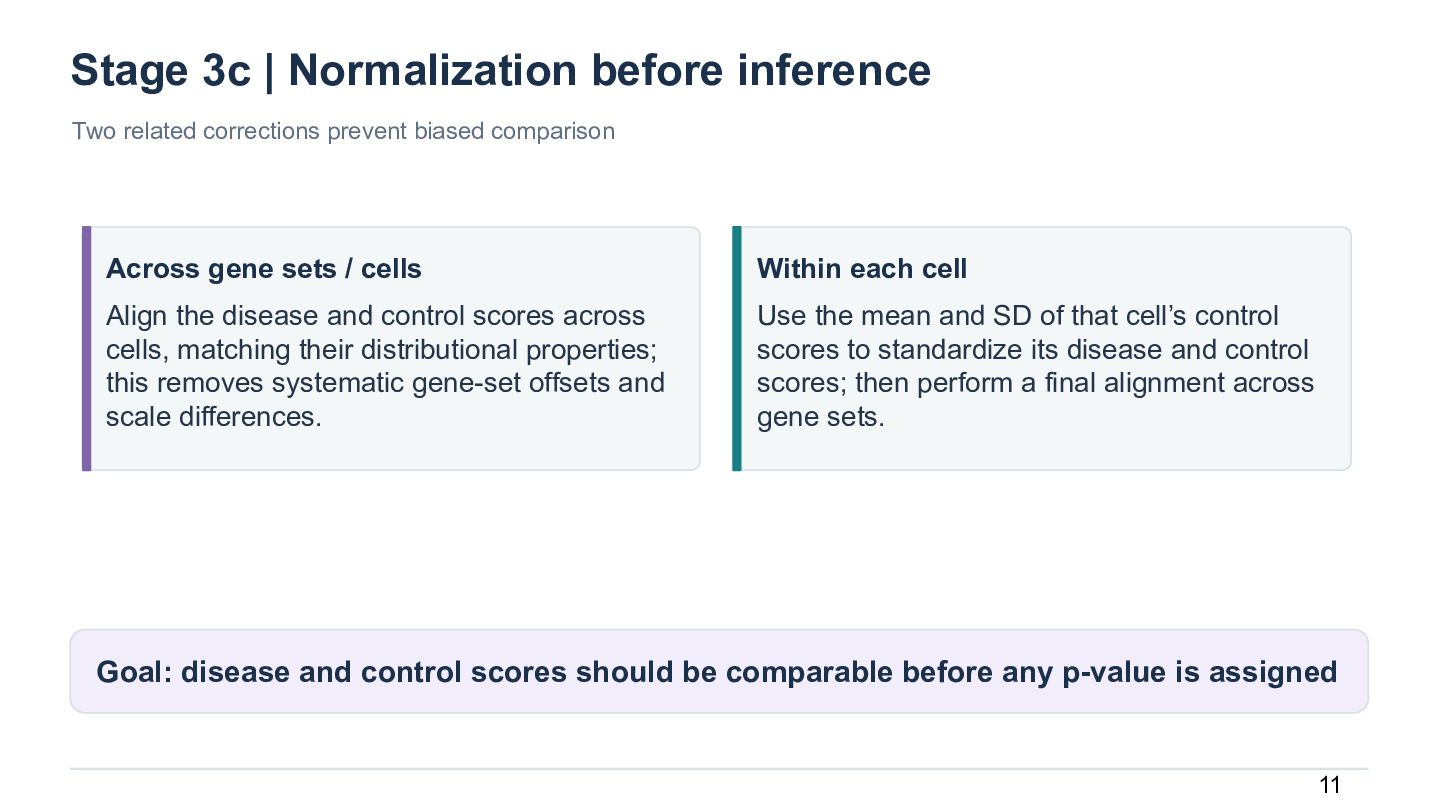
  12. Stage 3c | Normalization before inference Two related corrections prevent

    biased comparison Across gene sets / cells Within each cell Align the disease and control scores across cells, matching their distributional properties; this removes systematic gene-set offsets and scale differences. Use the mean and SD of that cell’s control scores to standardize its disease and control scores; then perform a final alignment across gene sets. Goal: disease and control scores should be comparable before any p-value is assigned 11
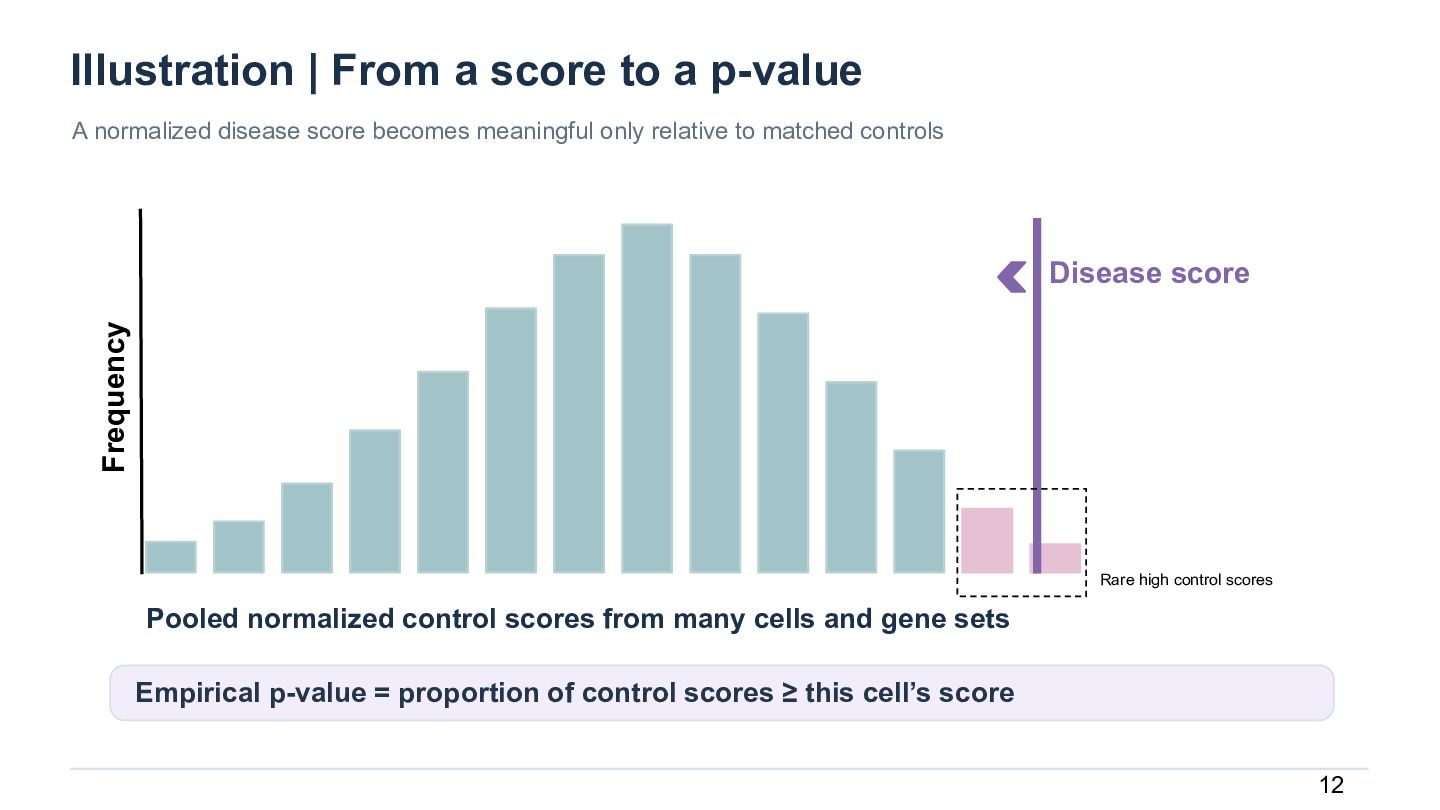
  13. Illustration | From a score to a p-value A normalized

    disease score becomes meaningful only relative to matched controls Frequency Disease score Rare high control scores Pooled normalized control scores from many cells and gene sets Empirical p-value = proportion of control scores ≥ this cell’s score 12
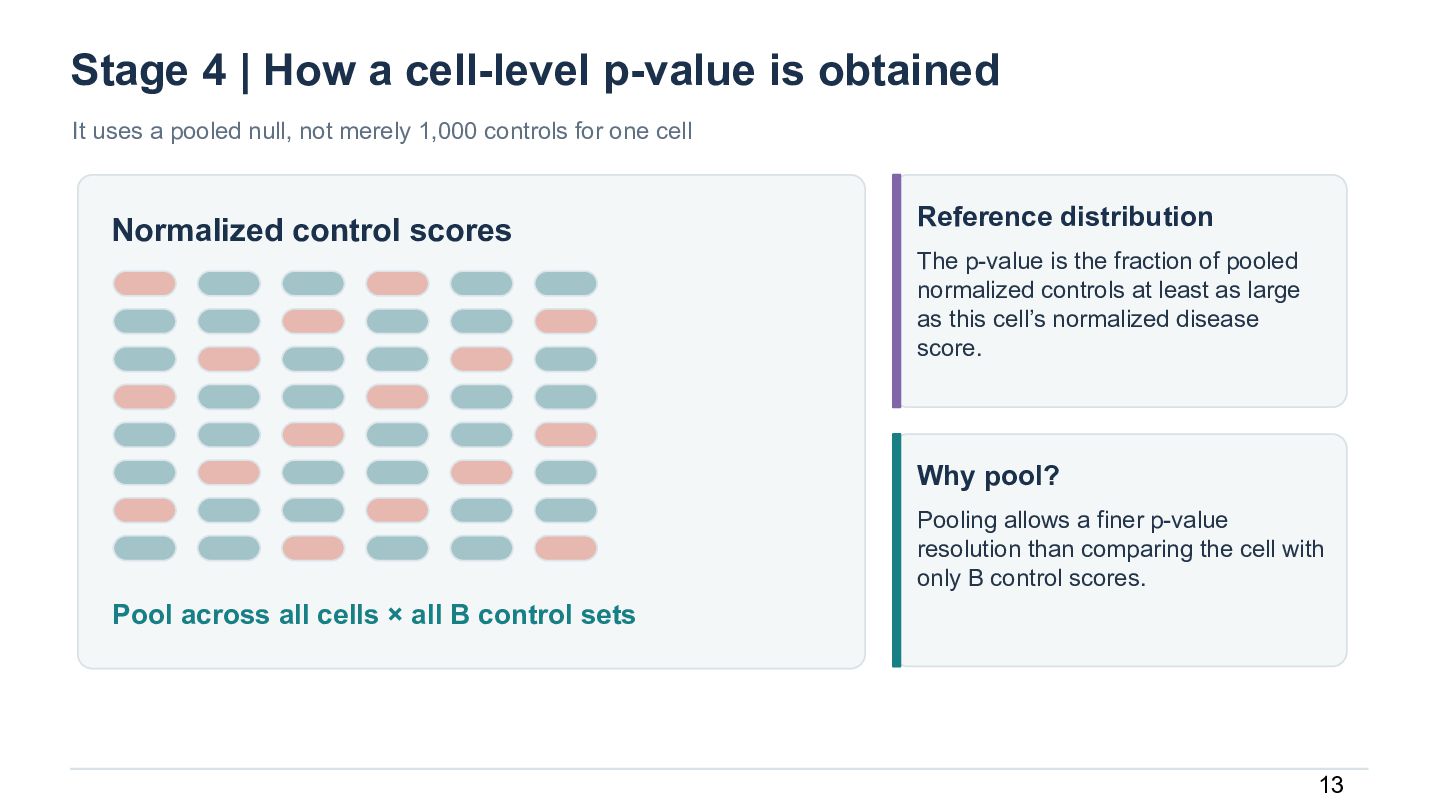
  14. Stage 4 | How a cell-level p-value is obtained It

    uses a pooled null, not merely 1,000 controls for one cell Normalized control scores Reference distribution The p-value is the fraction of pooled normalized controls at least as large as this cell’s normalized disease score. Why pool? Pooling allows a finer p-value resolution than comparing the cell with only B control scores. Pool across all cells × all B control sets 13
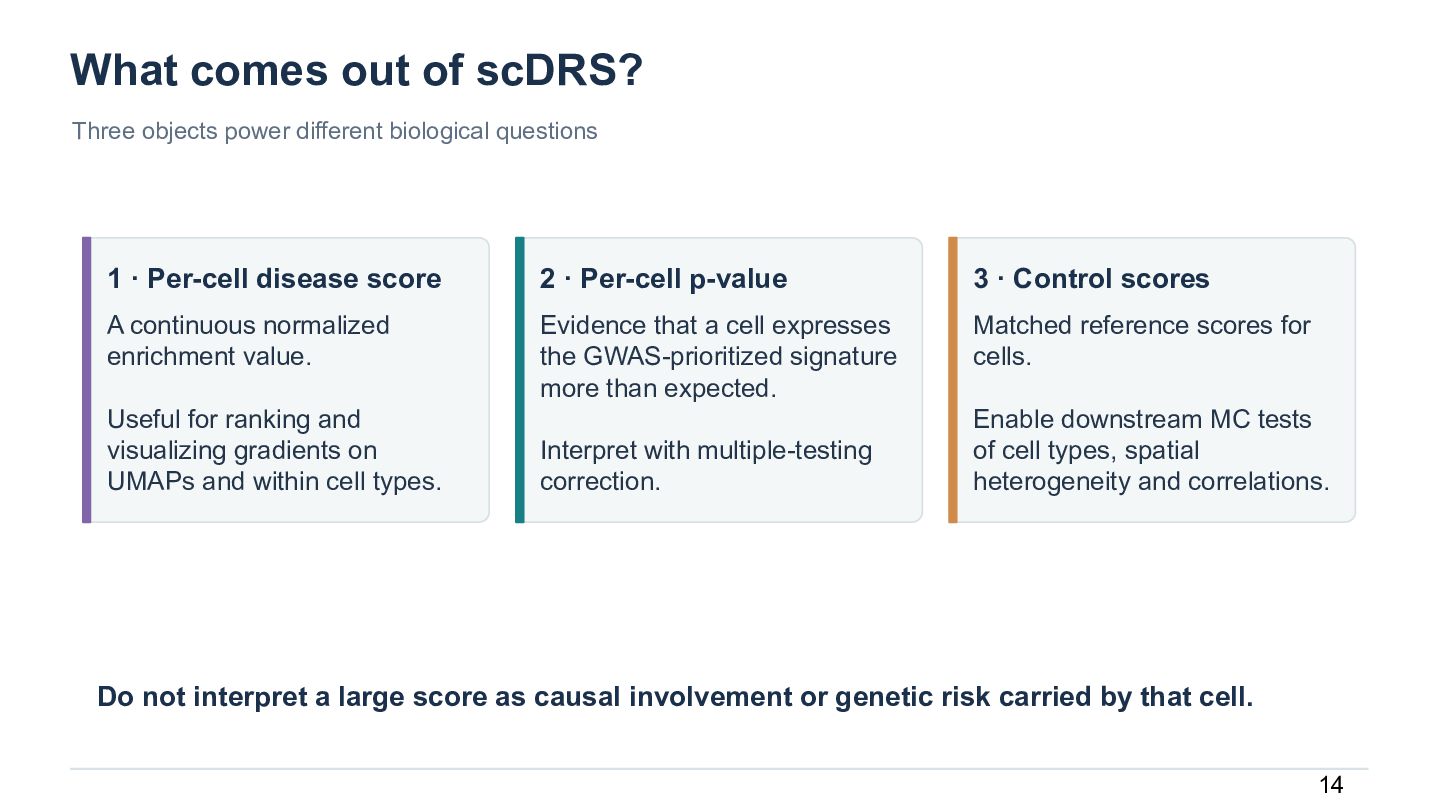
  15. What comes out of scDRS? Three objects power different biological

    questions 1 · Per-cell disease score 2 · Per-cell p-value 3 · Control scores A continuous normalized enrichment value. Evidence that a cell expresses the GWAS-prioritized signature more than expected. Matched reference scores for cells. Useful for ranking and visualizing gradients on UMAPs and within cell types. Interpret with multiple-testing correction. Enable downstream MC tests of cell types, spatial heterogeneity and correlations. Do not interpret a large score as causal involvement or genetic risk carried by that cell. 14
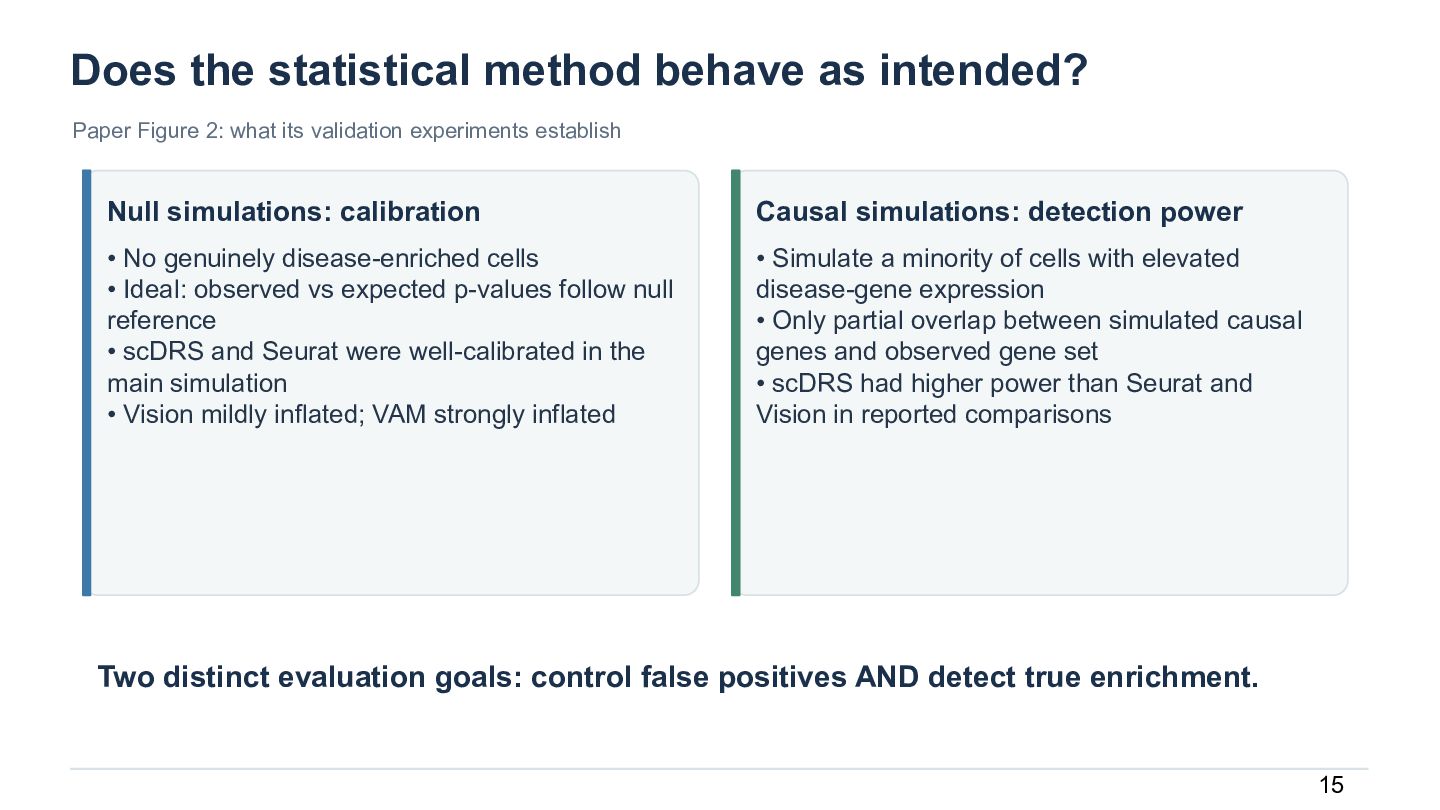
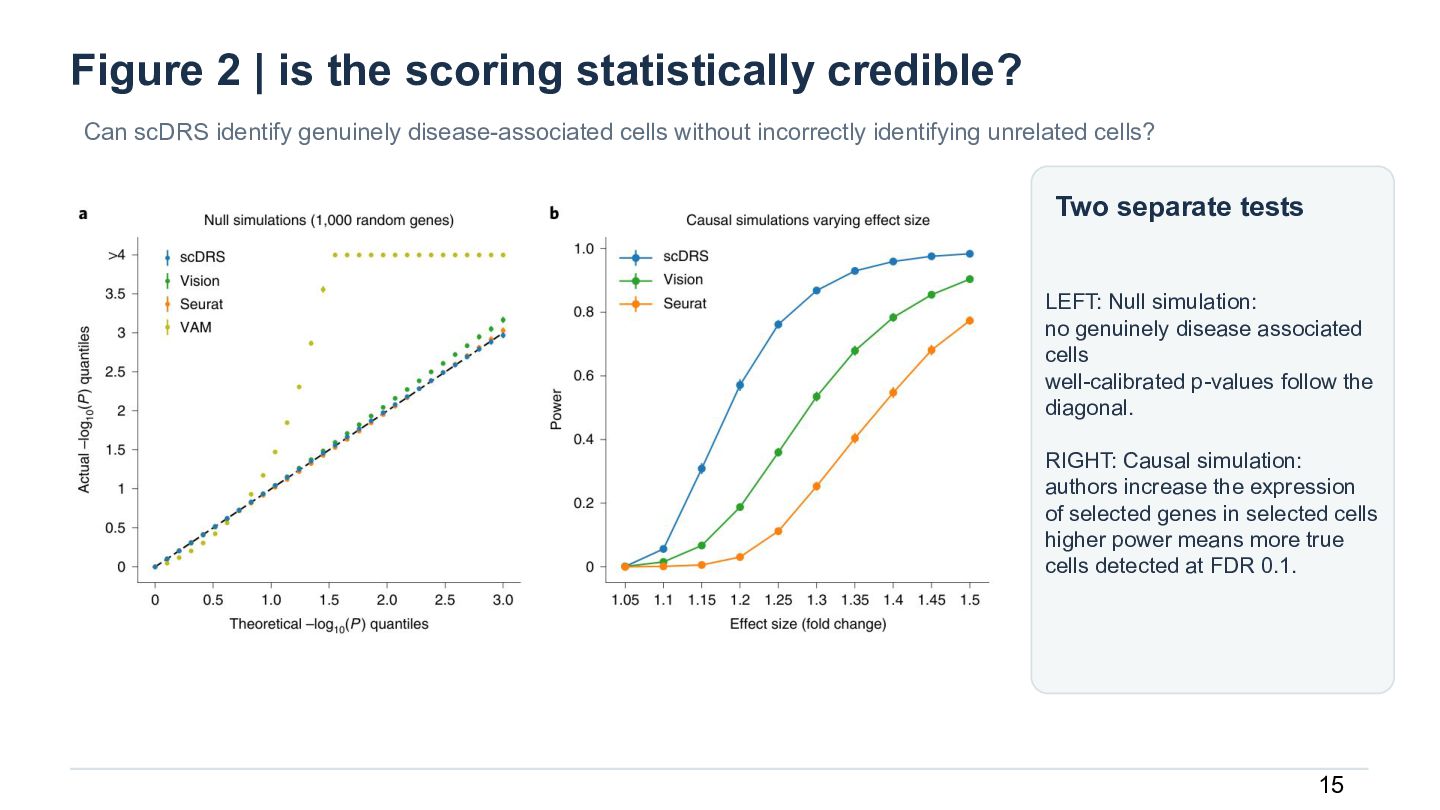
  16. Does the statistical method behave as intended? Paper Figure 2:

    what its validation experiments establish Null simulations: calibration Causal simulations: detection power • No genuinely disease-enriched cells • Ideal: observed vs expected p-values follow null reference • scDRS and Seurat were well-calibrated in the main simulation • Vision mildly inflated; VAM strongly inflated • Simulate a minority of cells with elevated disease-gene expression • Only partial overlap between simulated causal genes and observed gene set • scDRS had higher power than Seurat and Vision in reported comparisons Two distinct evaluation goals: control false positives AND detect true enrichment. 15
  17. Figure 2 | is the scoring statistically credible? Can scDRS

    identify genuinely disease-associated cells without incorrectly identifying unrelated cells? Two separate tests LEFT: Null simulation: no genuinely disease associated cells well-calibrated p-values follow the diagonal. RIGHT: Causal simulation: authors increase the expression of selected genes in selected cells higher power means more true cells detected at FDR 0.1. 15
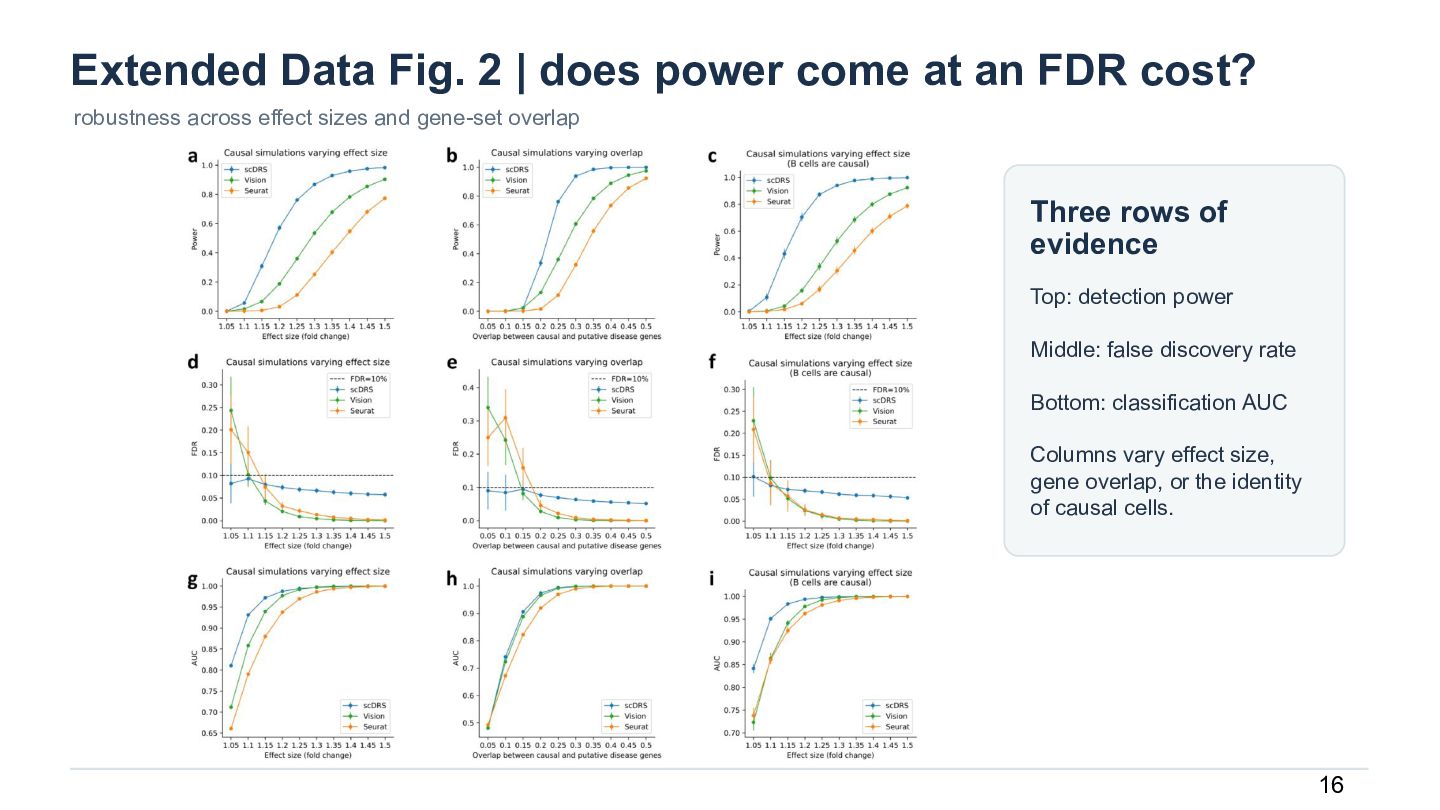
  18. Extended Data Fig. 2 | does power come at an

    FDR cost? robustness across effect sizes and gene-set overlap Three rows of evidence Top: detection power Middle: false discovery rate Bottom: classification AUC Columns vary effect size, gene overlap, or the identity of causal cells. 16
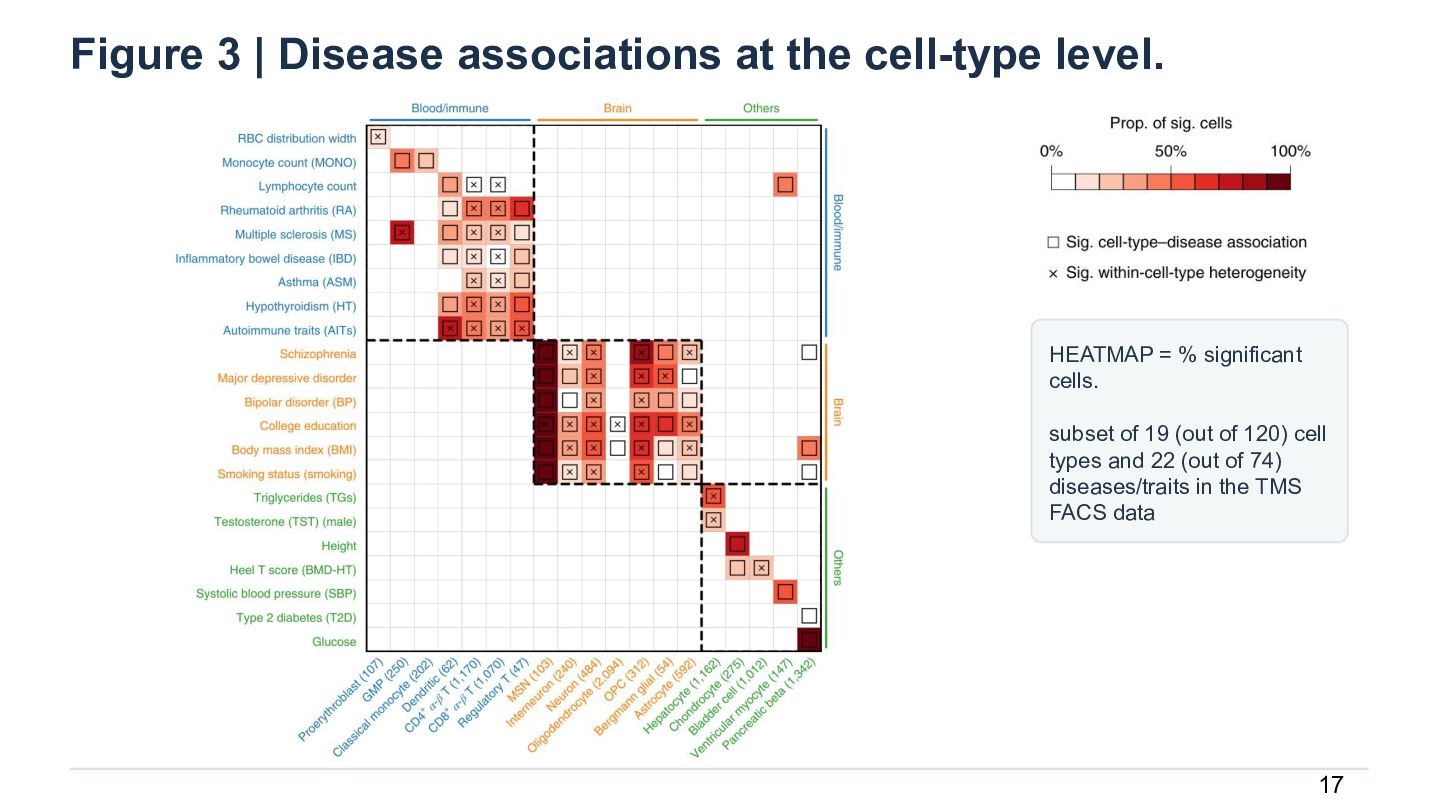
  19. Figure 3 | Disease associations at the cell-type level. HEATMAP

    = % significant cells. subset of 19 (out of 120) cell types and 22 (out of 74) diseases/traits in the TMS FACS data 17
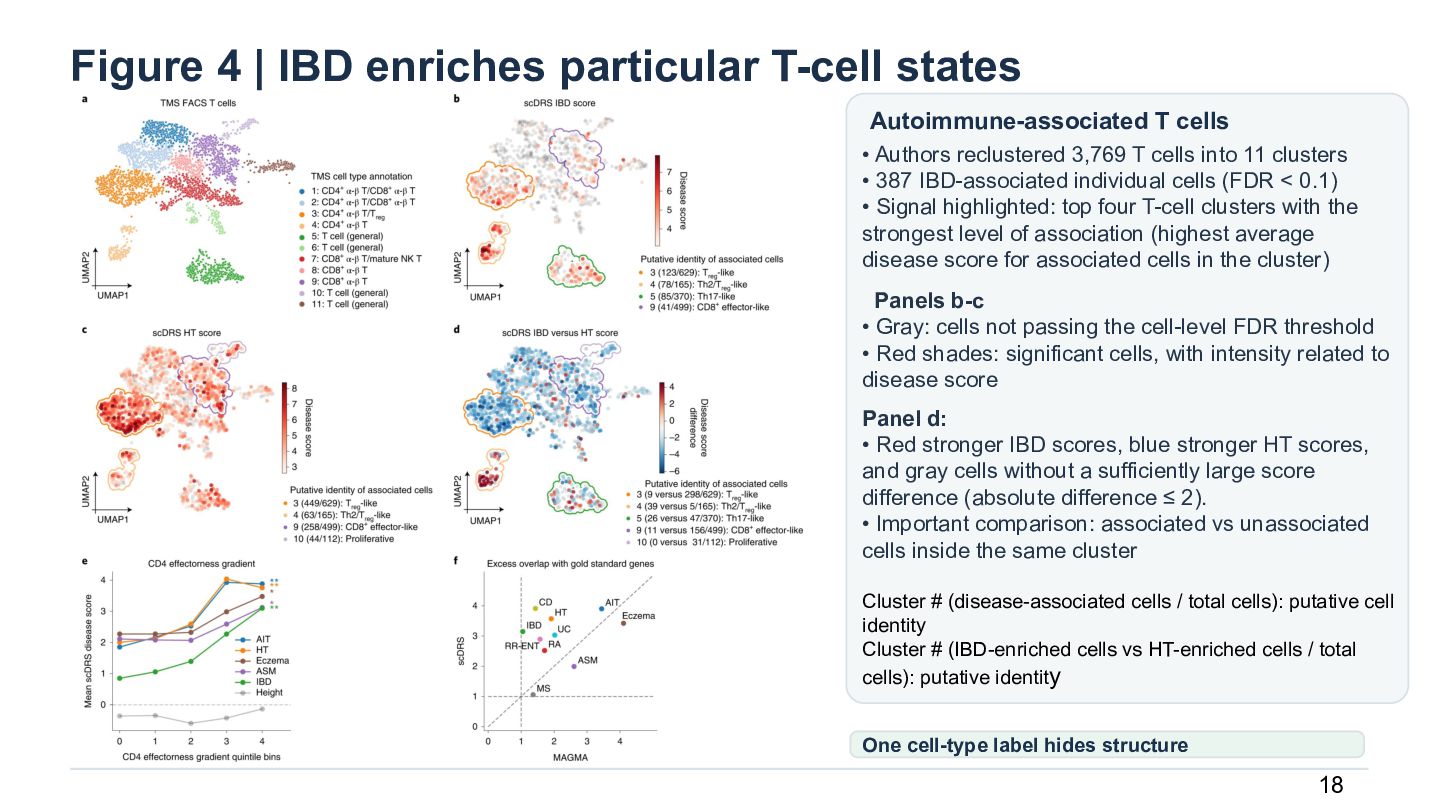
  20. Figure 4 | IBD enriches particular T-cell states Autoimmune-associated T

    cells • Authors reclustered 3,769 T cells into 11 clusters • 387 IBD-associated individual cells (FDR < 0.1) • Signal highlighted: top four T-cell clusters with the strongest level of association (highest average disease score for associated cells in the cluster) Panels b-c • Gray: cells not passing the cell-level FDR threshold • Red shades: significant cells, with intensity related to disease score Panel d: • Red stronger IBD scores, blue stronger HT scores, and gray cells without a sufficiently large score difference (absolute difference ≤ 2). • Important comparison: associated vs unassociated cells inside the same cluster Cluster # (disease-associated cells / total cells): putative cell identity Cluster # (IBD-enriched cells vs HT-enriched cells / total cells): putative identity One cell-type label hides structure 18
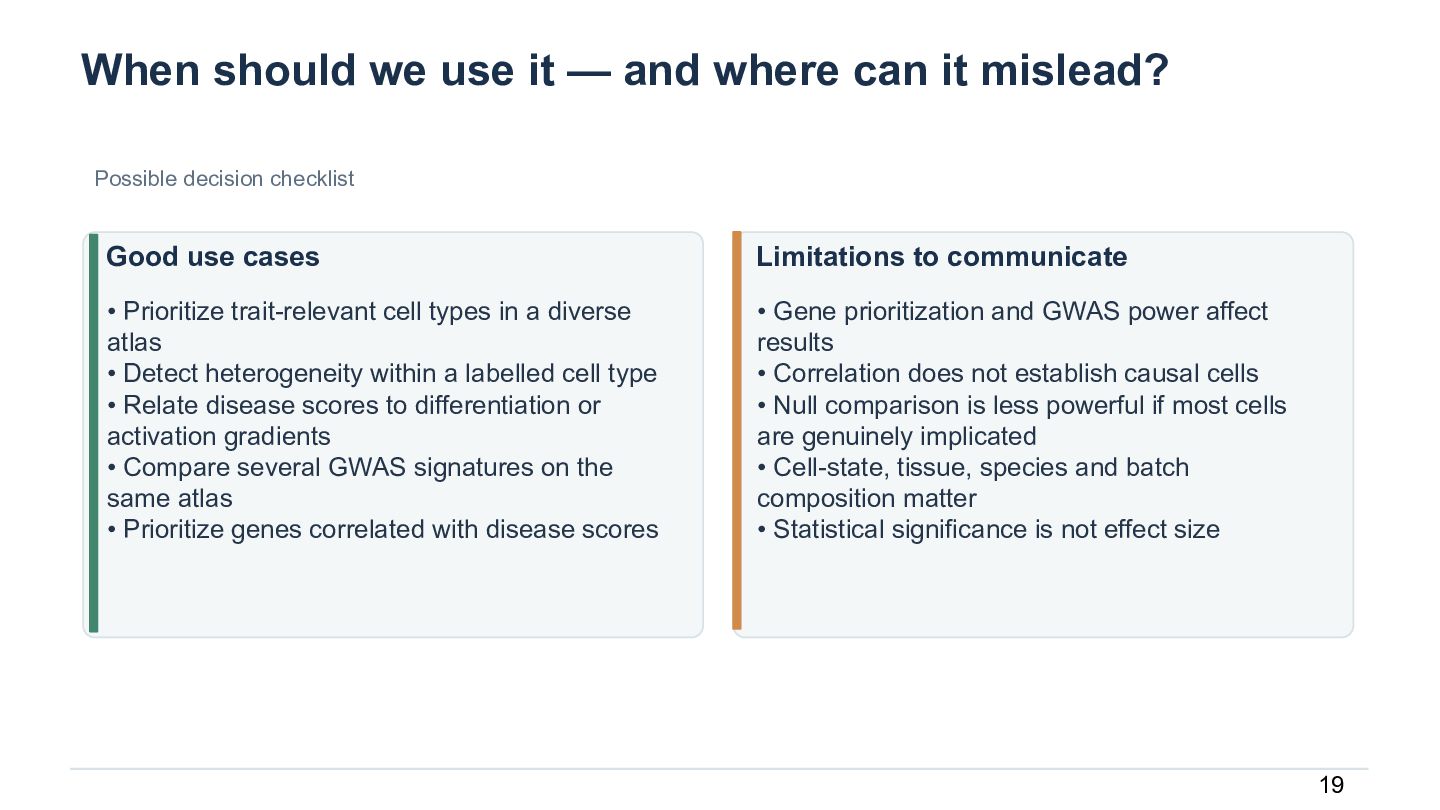
  21. When should we use it — and where can it

    mislead? Possible decision checklist Good use cases Limitations to communicate • Prioritize trait-relevant cell types in a diverse atlas • Detect heterogeneity within a labelled cell type • Relate disease scores to differentiation or activation gradients • Compare several GWAS signatures on the same atlas • Prioritize genes correlated with disease scores • Gene prioritization and GWAS power affect results • Correlation does not establish causal cells • Null comparison is less powerful if most cells are genuinely implicated • Cell-state, tissue, species and batch composition matter • Statistical significance is not effect size 19
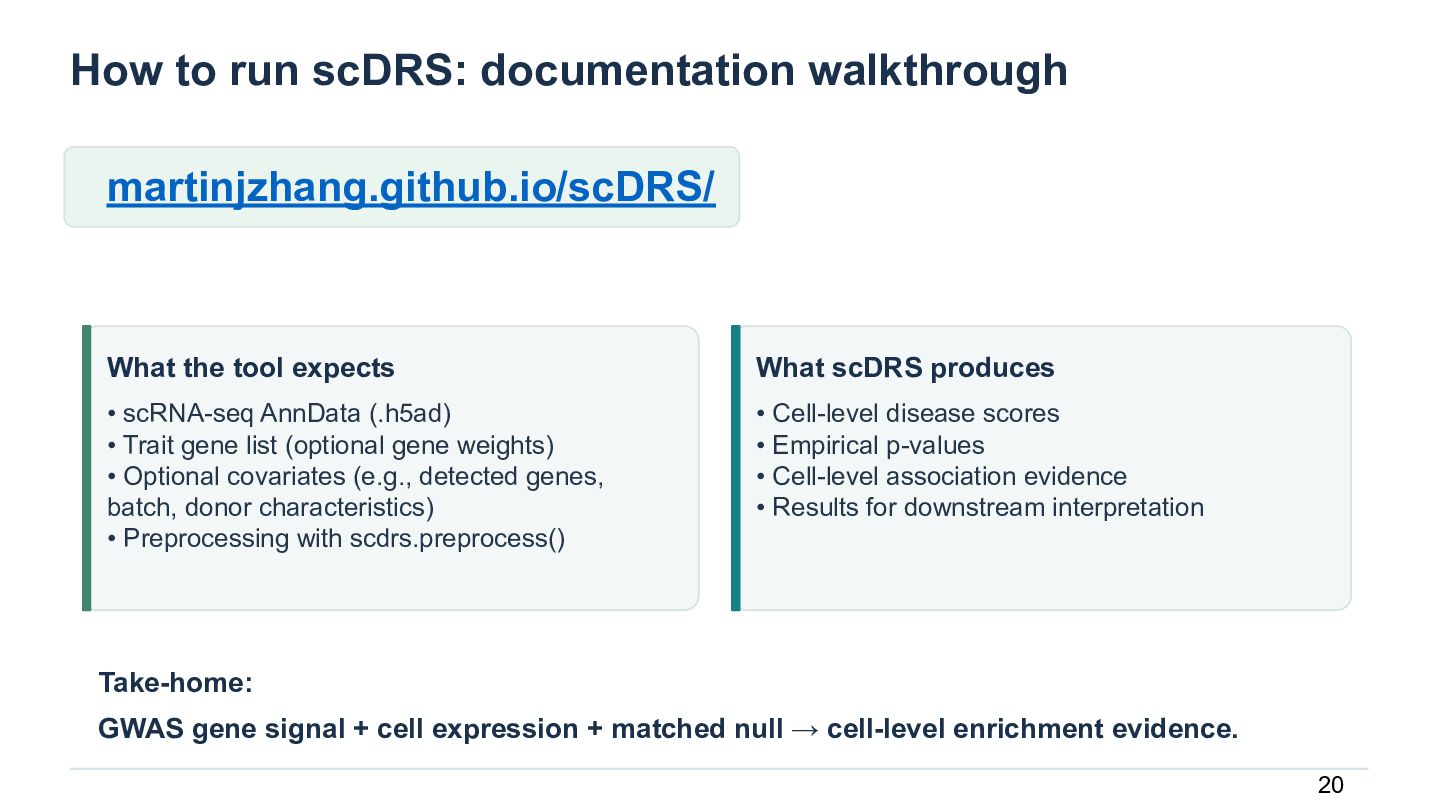
  22. How to run scDRS: documentation walkthrough martinjzhang.github.io/scDRS/ What the tool

    expects What scDRS produces • scRNA-seq AnnData (.h5ad) • Trait gene list (optional gene weights) • Optional covariates (e.g., detected genes, batch, donor characteristics) • Preprocessing with scdrs.preprocess() • Cell-level disease scores • Empirical p-values • Cell-level association evidence • Results for downstream interpretation Take-home: GWAS gene signal + cell expression + matched null → cell-level enrichment evidence. 20

More Decks by Manisha Barse

Other Decks in Research