Upgrade to Pro — share decks privately, control downloads, hide ads and more …

Team lcolladotor Journal Club January 2026

Avatar for Manisha Barse Manisha Barse
September 02, 2026

Team lcolladotor Journal Club January 2026

Team lcolladotor Journal Club: Spatial cell type mapping of multiple sclerosis lesions
doi preprint: https://doi.org/10.1101/2022.11.03.514906
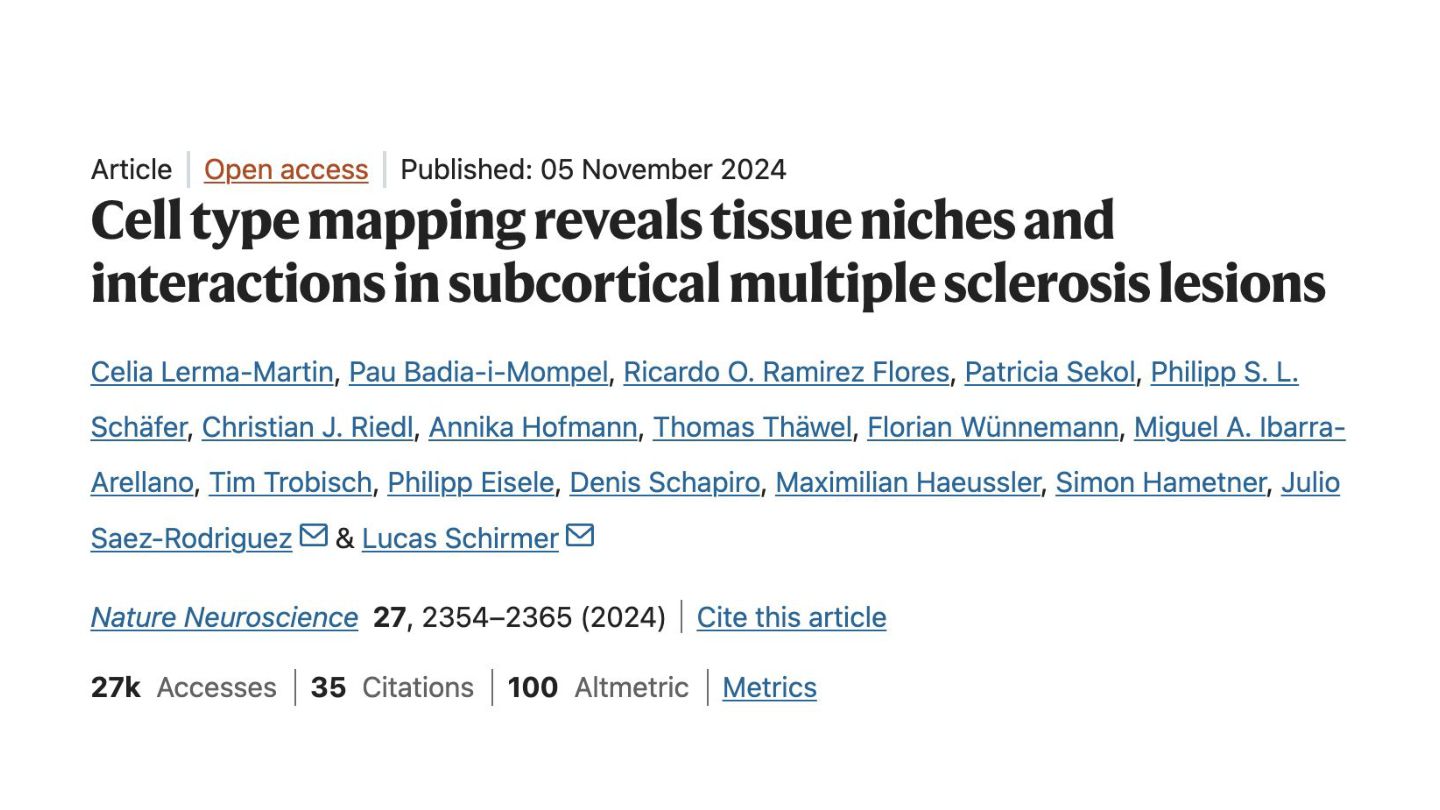
doi latest: https://doi.org/10.1038/s41593-024-01796-z
Presented By: Manisha Barse
Date: January 14, 2026

Avatar for Manisha Barse

Manisha Barse

September 02, 2026

More Decks by Manisha Barse

Other Decks in Research

Transcript

  1. Team lcolladotor Journal Club Spatial cell type mapping of multiple

    sclerosis lesions Celia Lerma-Martin et.al (2022) doi: https://doi.org/10.1101/2022.11.03.514906 Presented By: Manisha Barse January 14, 2026
  2. Multiple sclerosis (MS) • Chronic(long-lasting) autoimmune disorder: mainly affects the

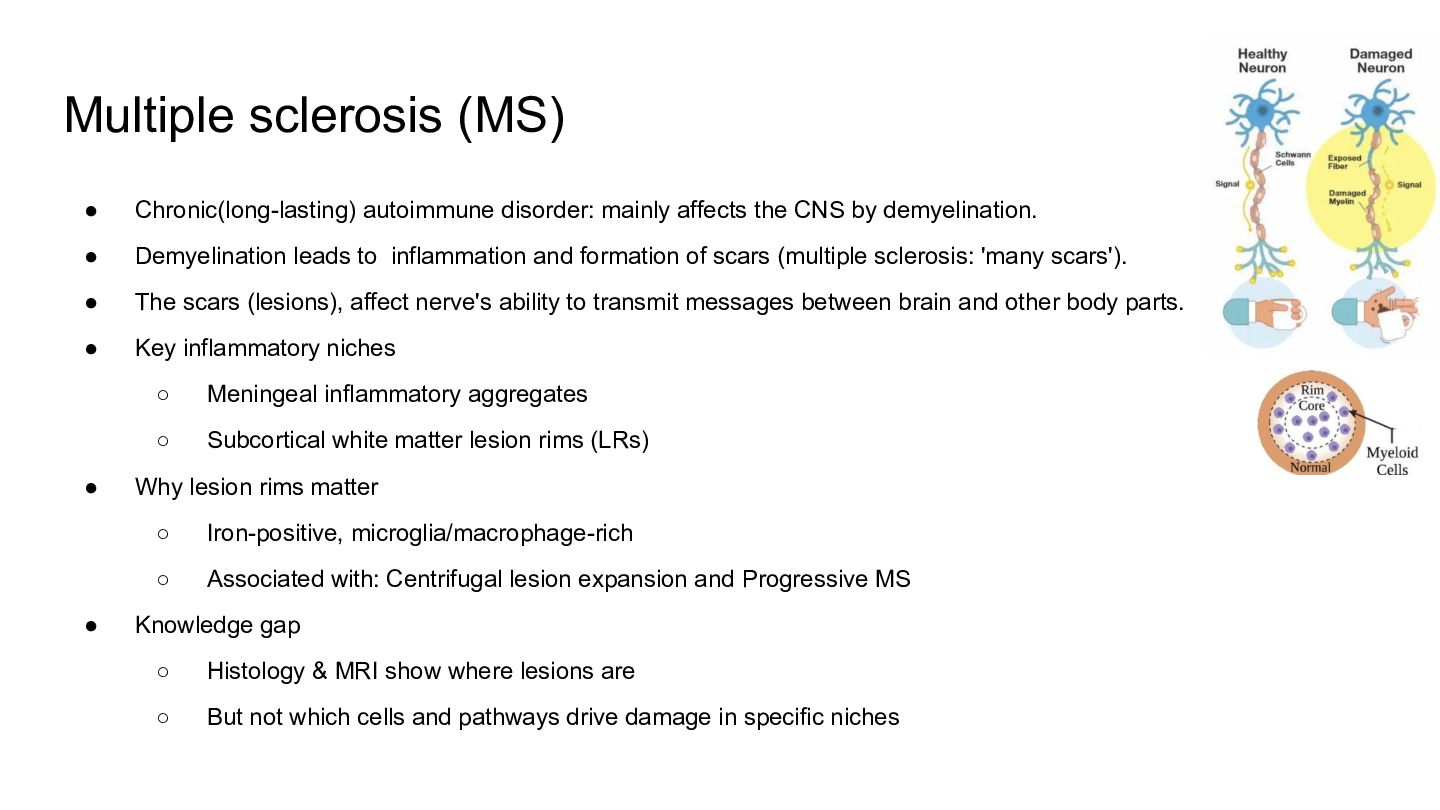
    CNS by demyelination. • Demyelination leads to inflammation and formation of scars (multiple sclerosis: 'many scars'). • The scars (lesions), affect nerve's ability to transmit messages between brain and other body parts. • Key inflammatory niches • • ◦ Meningeal inflammatory aggregates ◦ Subcortical white matter lesion rims (LRs) Why lesion rims matter ◦ Iron-positive, microglia/macrophage-rich ◦ Associated with: Centrifugal lesion expansion and Progressive MS Knowledge gap ◦ Histology & MRI show where lesions are ◦ But not which cells and pathways drive damage in specific niches
  3. Knowledge Gap & Study Aim What we don’t know •

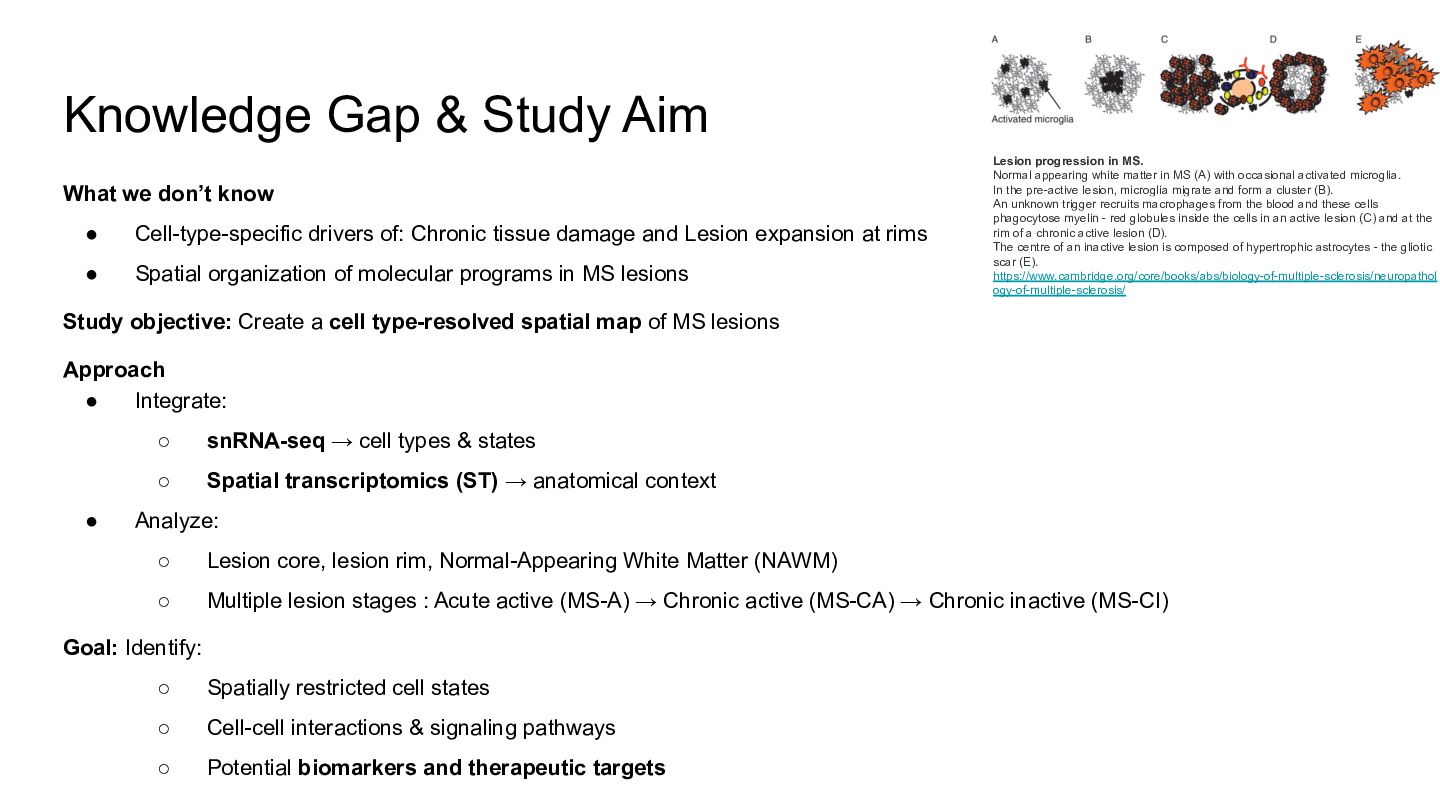
    Cell-type-specific drivers of: Chronic tissue damage and Lesion expansion at rims • Spatial organization of molecular programs in MS lesions Lesion progression in MS. Normal appearing white matter in MS (A) with occasional activated microglia. In the pre-active lesion, microglia migrate and form a cluster (B). An unknown trigger recruits macrophages from the blood and these cells phagocytose myelin - red globules inside the cells in an active lesion (C) and at the rim of a chronic active lesion (D). The centre of an inactive lesion is composed of hypertrophic astrocytes - the gliotic scar (E). https://www.cambridge.org/core/books/abs/biology-of-multiple-sclerosis/neuropathol ogy-of-multiple-sclerosis/ Study objective: Create a cell type-resolved spatial map of MS lesions Approach • Integrate: • ◦ snRNA-seq → cell types & states ◦ Spatial transcriptomics (ST) → anatomical context Analyze: ◦ Lesion core, lesion rim, Normal-Appearing White Matter (NAWM) ◦ Multiple lesion stages : Acute active (MS-A) → Chronic active (MS-CA) → Chronic inactive (MS-CI) Goal: Identify: ◦ Spatially restricted cell states ◦ Cell-cell interactions & signaling pathways ◦ Potential biomarkers and therapeutic targets
  4. Spatial and cell type profiling of subcortical control and MS

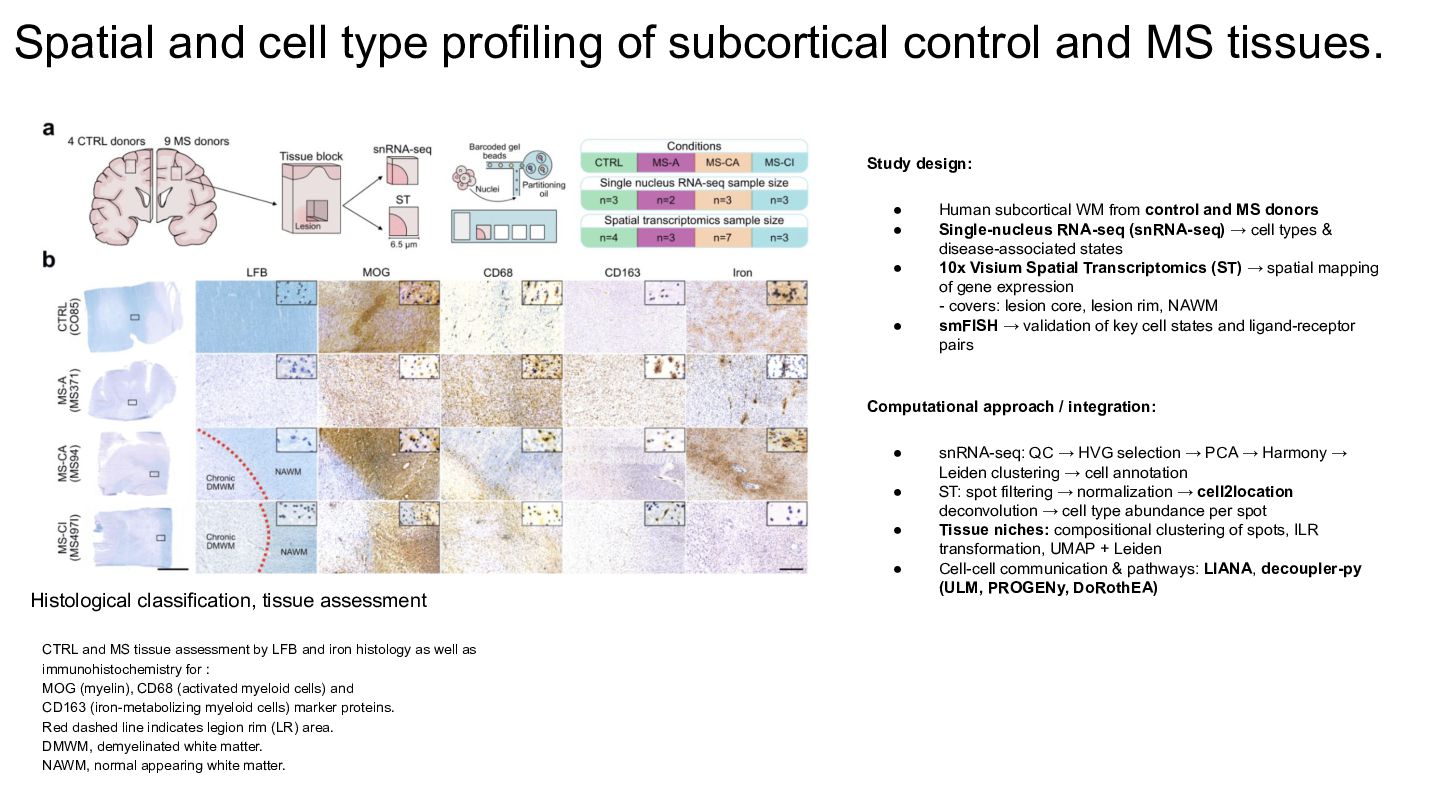
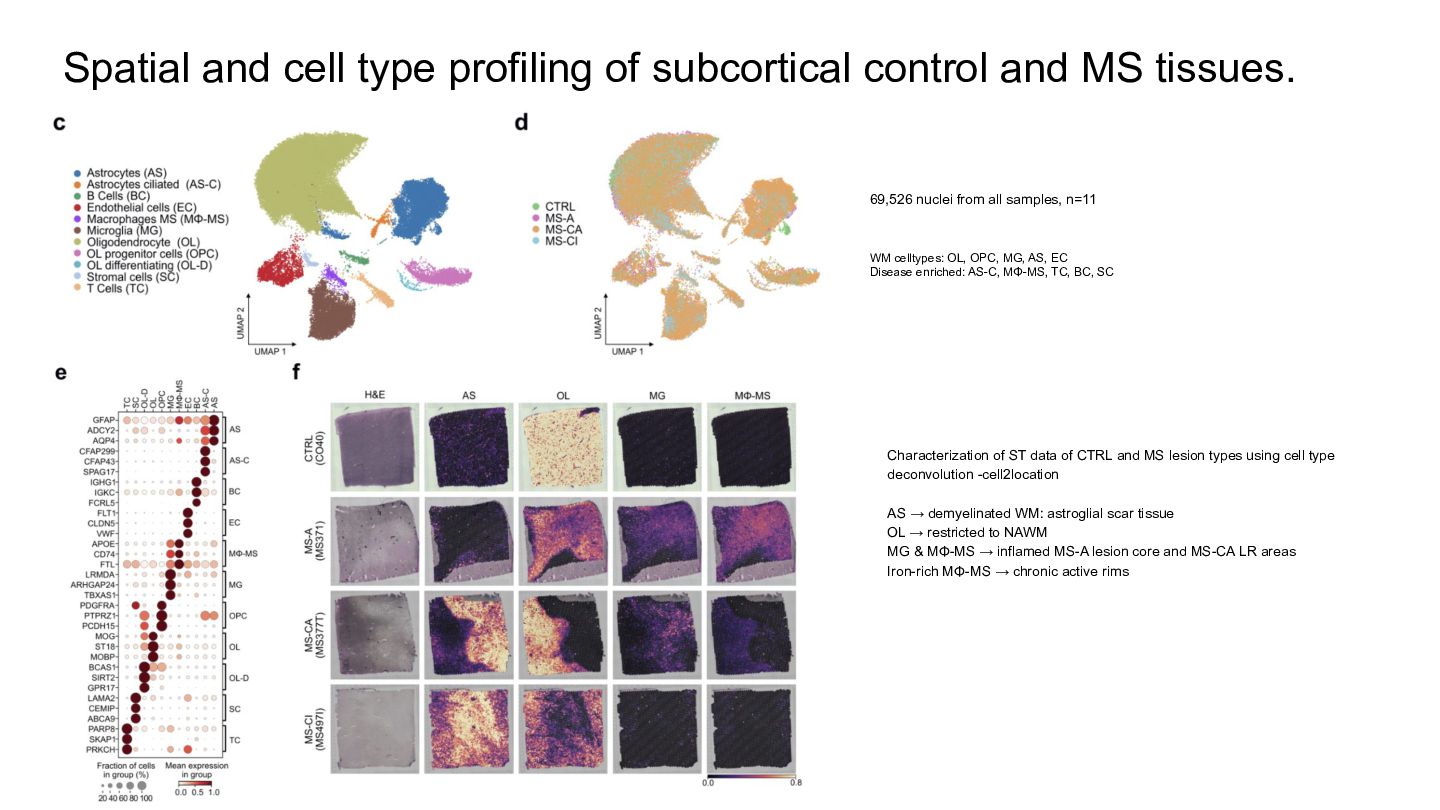
    tissues. Study design: • • • • Human subcortical WM from control and MS donors Single-nucleus RNA-seq (snRNA-seq) → cell types & disease-associated states 10x Visium Spatial Transcriptomics (ST) → spatial mapping of gene expression - covers: lesion core, lesion rim, NAWM smFISH → validation of key cell states and ligand-receptor pairs Computational approach / integration: • • • • Histological classification, tissue assessment CTRL and MS tissue assessment by LFB and iron histology as well as immunohistochemistry for : MOG (myelin), CD68 (activated myeloid cells) and CD163 (iron-metabolizing myeloid cells) marker proteins. Red dashed line indicates legion rim (LR) area. DMWM, demyelinated white matter. NAWM, normal appearing white matter. snRNA-seq: QC → HVG selection → PCA → Harmony → Leiden clustering → cell annotation ST: spot filtering → normalization → cell2location deconvolution → cell type abundance per spot Tissue niches: compositional clustering of spots, ILR transformation, UMAP + Leiden Cell-cell communication & pathways: LIANA, decoupler-py (ULM, PROGENy, DoRothEA)
  5. Spatial and cell type profiling of subcortical control and MS

    tissues. 69,526 nuclei from all samples, n=11 WM celltypes: OL, OPC, MG, AS, EC Disease enriched: AS-C, MΦ-MS, TC, BC, SC Characterization of ST data of CTRL and MS lesion types using cell type deconvolution -cell2location AS → demyelinated WM: astroglial scar tissue OL → restricted to NAWM MG & MΦ-MS → inflamed MS-A lesion core and MS-CA LR areas Iron-rich MΦ-MS → chronic active rims
  6. Spatial organization of subcortical control and MS tissues Cell type

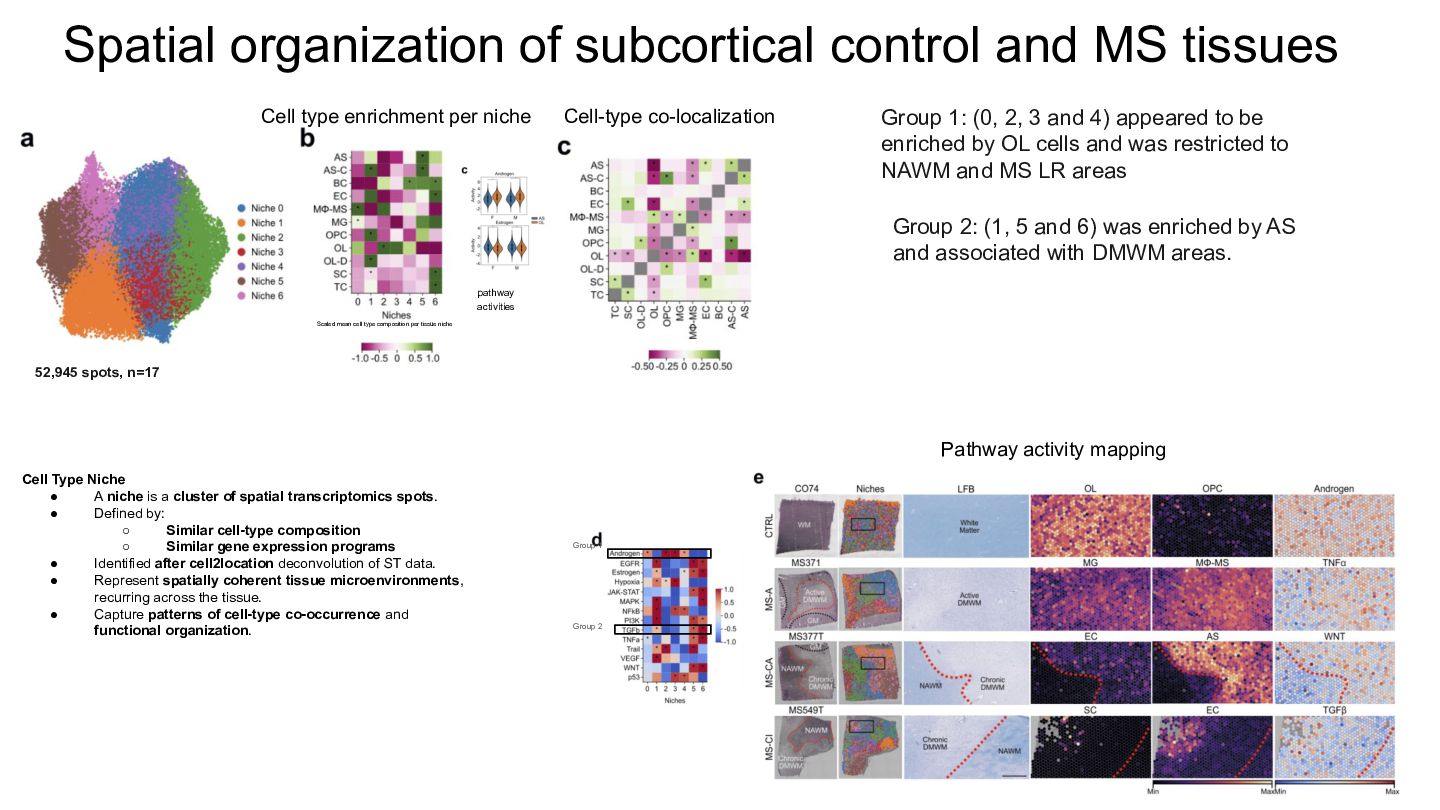
    enrichment per niche Cell-type co-localization Group 1: (0, 2, 3 and 4) appeared to be enriched by OL cells and was restricted to NAWM and MS LR areas Group 2: (1, 5 and 6) was enriched by AS and associated with DMWM areas. pathway activities Scaled mean cell type composition per tissue niche 52,945 spots, n=17 Pathway activity mapping Cell Type Niche • A niche is a cluster of spatial transcriptomics spots. • Defined by: ◦ Similar cell-type composition ◦ Similar gene expression programs • Identified after cell2location deconvolution of ST data. • Represent spatially coherent tissue microenvironments, recurring across the tissue. • Capture patterns of cell-type co-occurrence and functional organization. Group 1 Group 2
  7. Spatial organization of subcortical control and MS tissues Oligodendrocytes (OL)

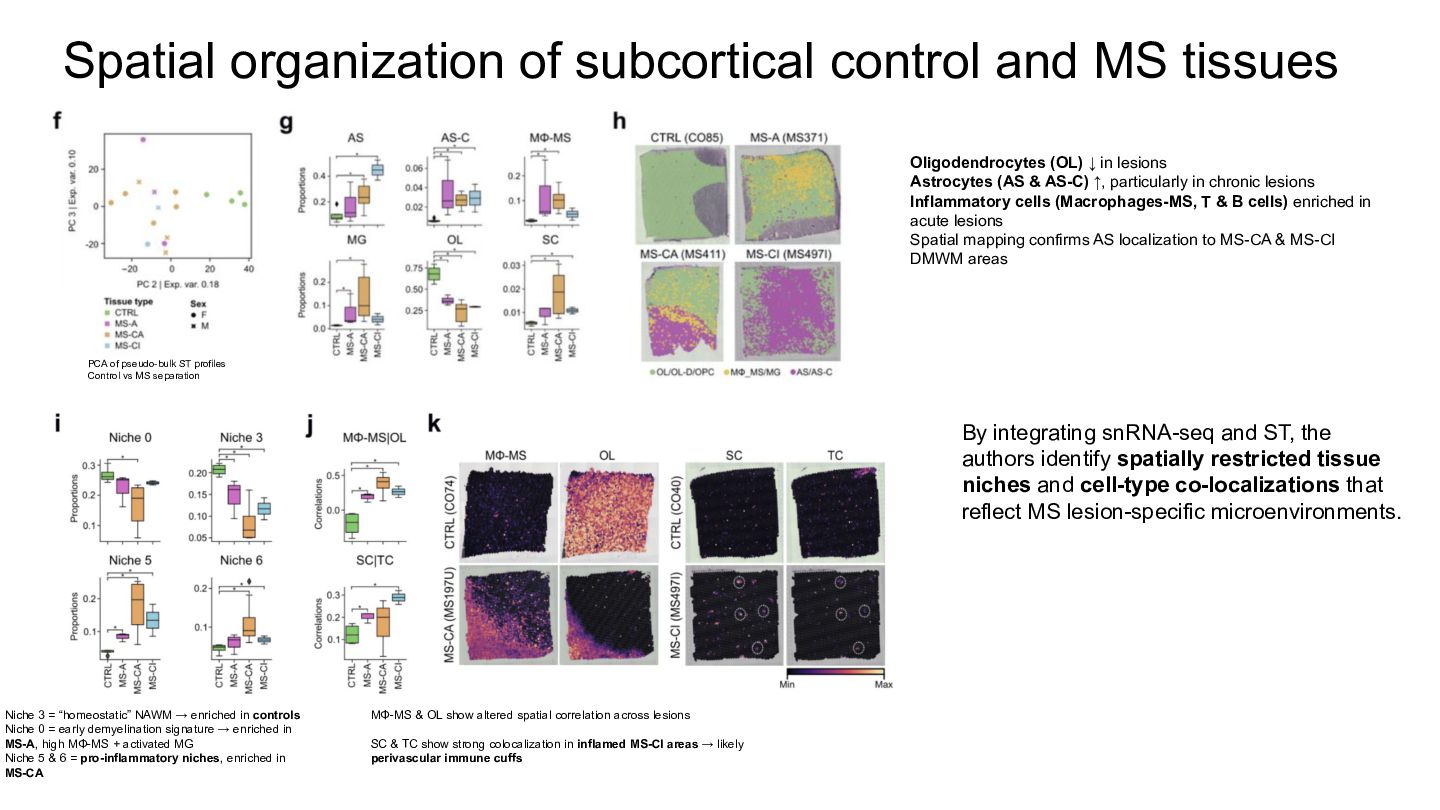
    ↓ in lesions Astrocytes (AS & AS-C) ↑, particularly in chronic lesions Inflammatory cells (Macrophages-MS, T & B cells) enriched in acute lesions Spatial mapping confirms AS localization to MS-CA & MS-CI DMWM areas PCA of pseudo-bulk ST profiles Control vs MS separation By integrating snRNA-seq and ST, the authors identify spatially restricted tissue niches and cell-type co-localizations that reflect MS lesion-specific microenvironments. Niche 3 = “homeostatic” NAWM → enriched in controls Niche 0 = early demyelination signature → enriched in MS-A, high MΦ-MS + activated MG Niche 5 & 6 = pro-inflammatory niches, enriched in MS-CA MΦ-MS & OL show altered spatial correlation across lesions SC & TC show strong colocalization in inflamed MS-CI areas → likely perivascular immune cuffs
  8. Identification and spatial characterization of MG cell states homeostatic activated/

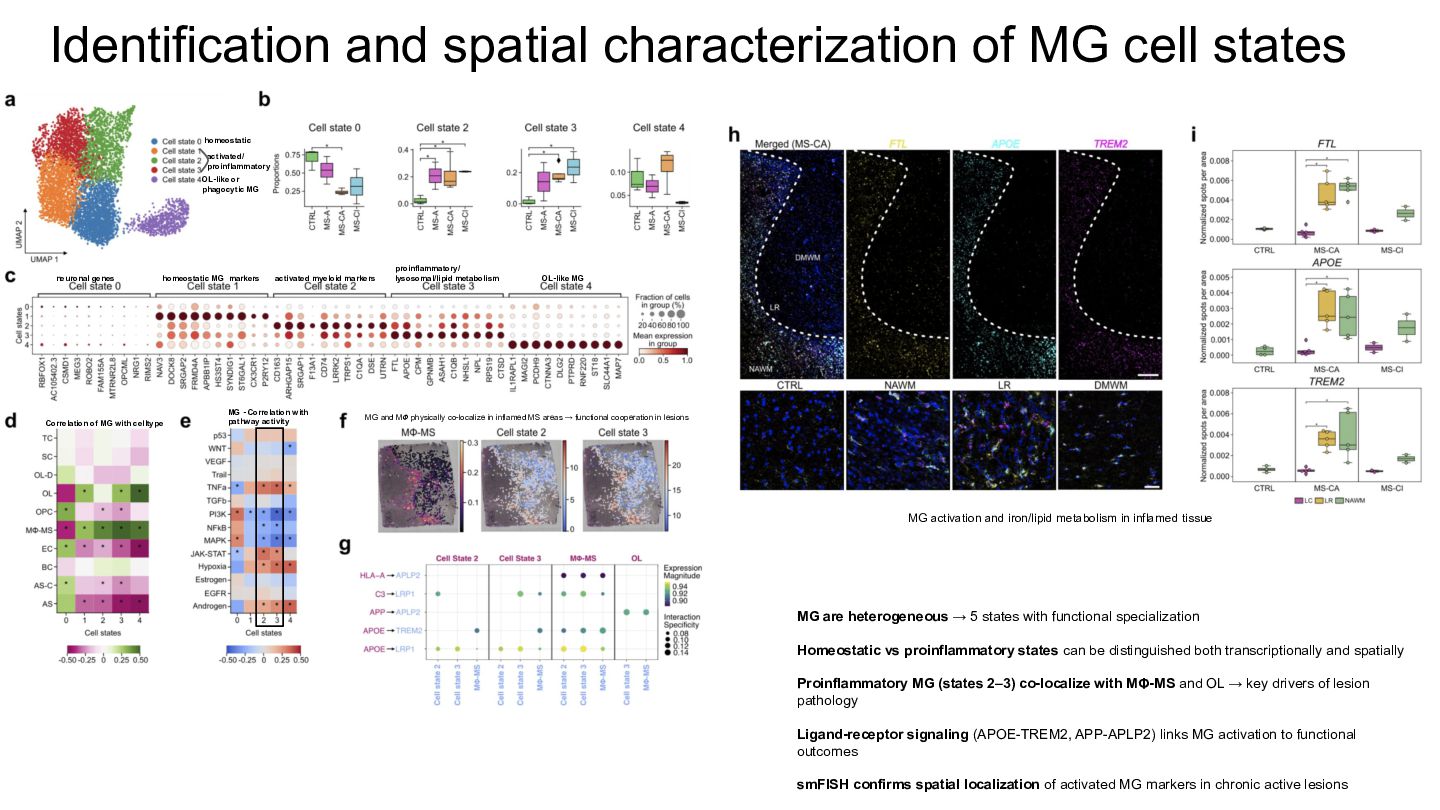
    proinflammatory OL-like or phagocytic MG neuronal genes homeostatic MG markers Correlation of MG with celltype activated myeloid markers MG - Correlation with pathway activity proinflammatory/ lysosomal/lipid metabolism OL-like MG MG and M𝞥 physically co-localize in inflamed MS areas → functional cooperation in lesions MG activation and iron/lipid metabolism in inflamed tissue MG are heterogeneous → 5 states with functional specialization Homeostatic vs proinflammatory states can be distinguished both transcriptionally and spatially Proinflammatory MG (states 2–3) co-localize with MΦ-MS and OL → key drivers of lesion pathology Ligand-receptor signaling (APOE-TREM2, APP-APLP2) links MG activation to functional outcomes smFISH confirms spatial localization of activated MG markers in chronic active lesions
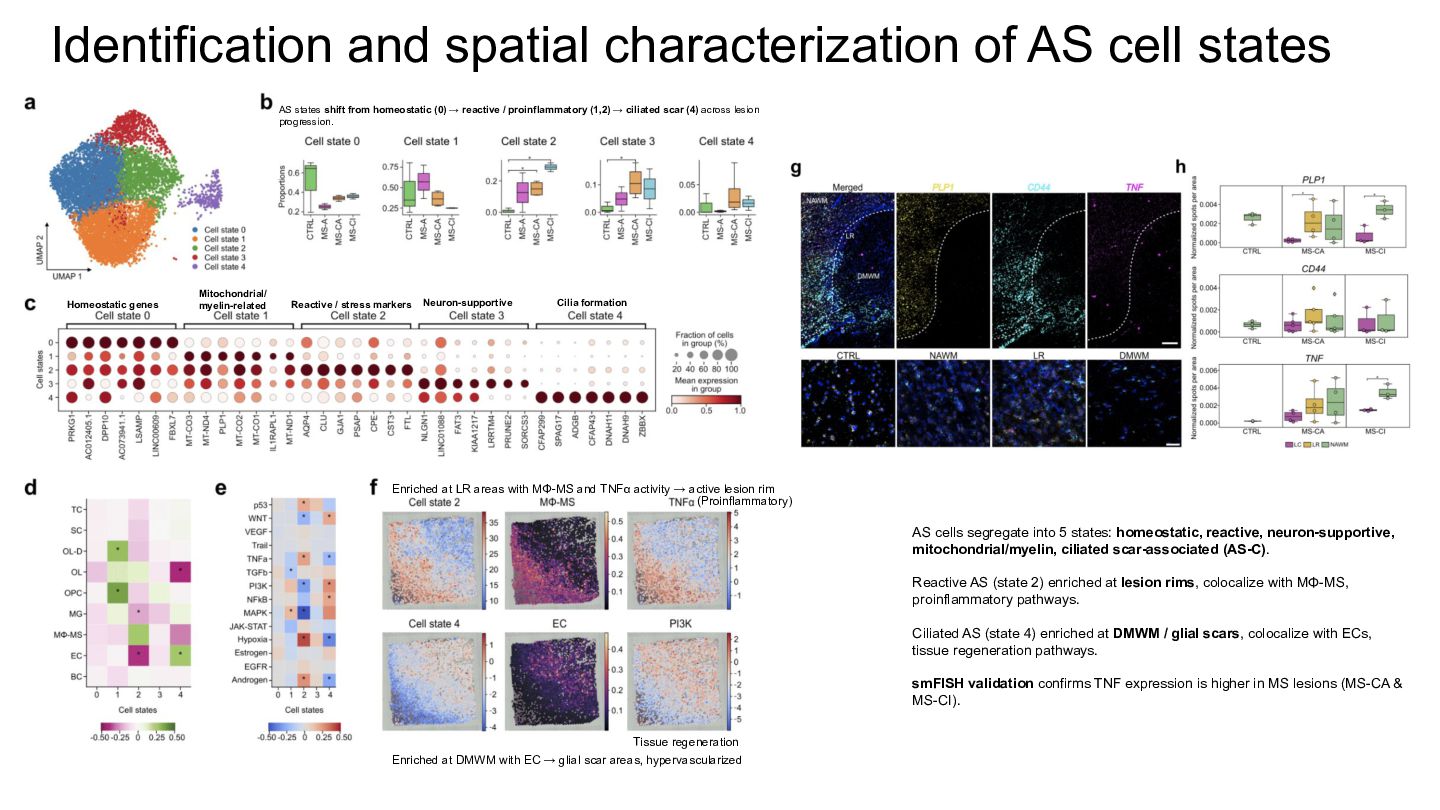
  9. Identification and spatial characterization of AS cell states AS states

    shift from homeostatic (0) → reactive / proinflammatory (1,2) → ciliated scar (4) across lesion progression. Homeostatic genes Mitochondrial/ myelin-related Reactive / stress markers Neuron-supportive Cilia formation Enriched at LR areas with MΦ-MS and TNFα activity → active lesion rim (Proinflammatory) AS cells segregate into 5 states: homeostatic, reactive, neuron-supportive, mitochondrial/myelin, ciliated scar-associated (AS-C). Reactive AS (state 2) enriched at lesion rims, colocalize with MΦ-MS, proinflammatory pathways. Ciliated AS (state 4) enriched at DMWM / glial scars, colocalize with ECs, tissue regeneration pathways. smFISH validation confirms TNF expression is higher in MS lesions (MS-CA & MS-CI). Tissue regeneration Enriched at DMWM with EC → glial scar areas, hypervascularized
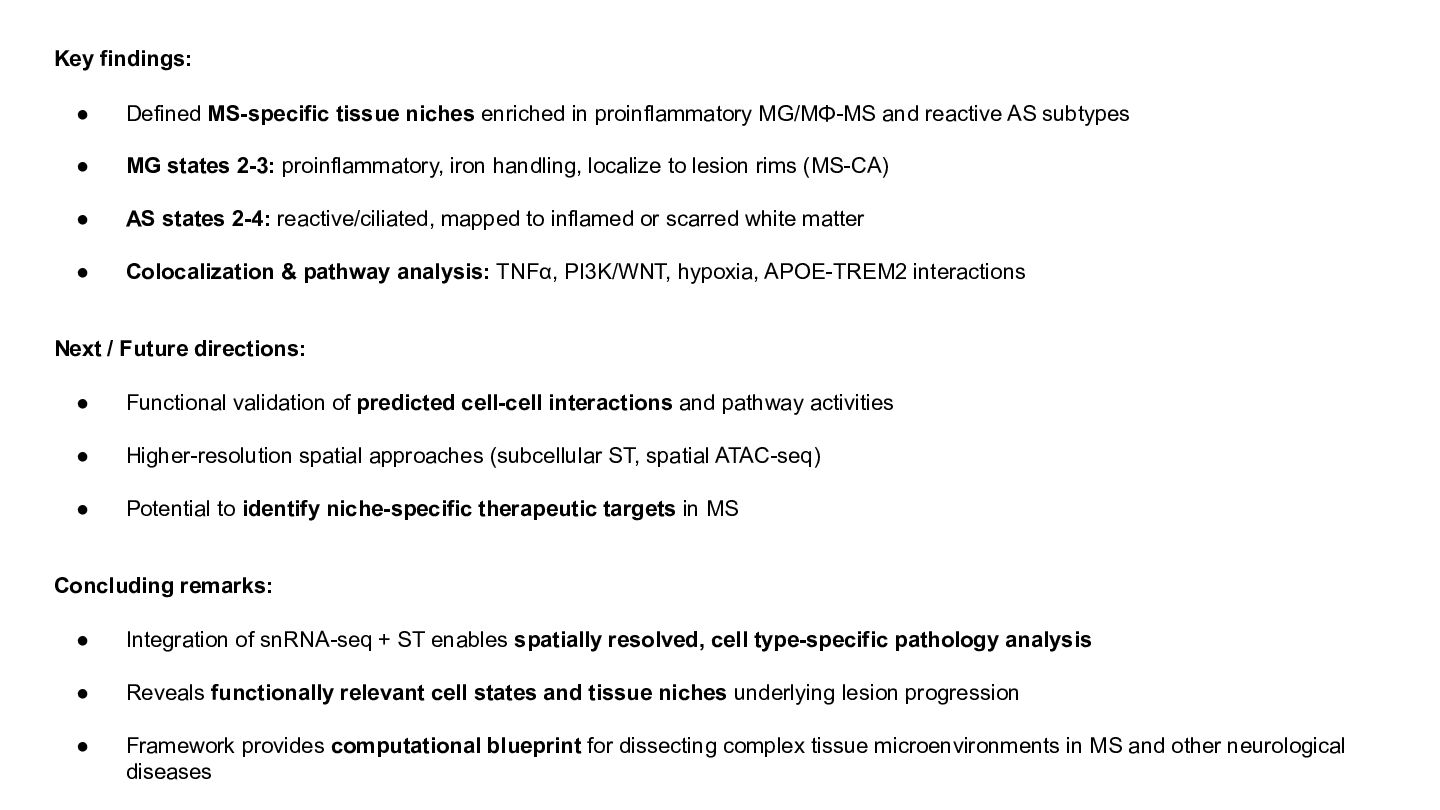
  10. Key findings: • Defined MS-specific tissue niches enriched in proinflammatory

    MG/MΦ-MS and reactive AS subtypes • MG states 2-3: proinflammatory, iron handling, localize to lesion rims (MS-CA) • AS states 2-4: reactive/ciliated, mapped to inflamed or scarred white matter • Colocalization & pathway analysis: TNFα, PI3K/WNT, hypoxia, APOE-TREM2 interactions Next / Future directions: • Functional validation of predicted cell-cell interactions and pathway activities • Higher-resolution spatial approaches (subcellular ST, spatial ATAC-seq) • Potential to identify niche-specific therapeutic targets in MS Concluding remarks: • Integration of snRNA-seq + ST enables spatially resolved, cell type-specific pathology analysis • Reveals functionally relevant cell states and tissue niches underlying lesion progression • Framework provides computational blueprint for dissecting complex tissue microenvironments in MS and other neurological diseases