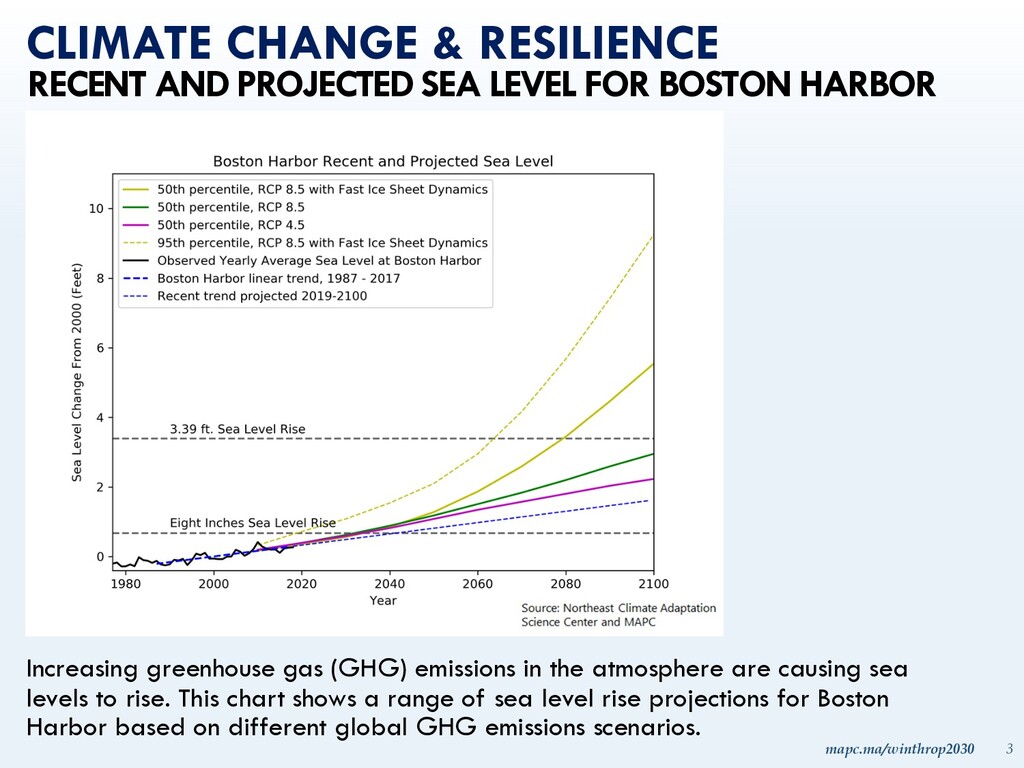
LEVEL FOR BOSTON HARBOR Increasing greenhouse gas (GHG) emissions in the atmosphere are causing sea levels to rise. This chart shows a range of sea level rise projections for Boston Harbor based on different global GHG emissions scenarios.
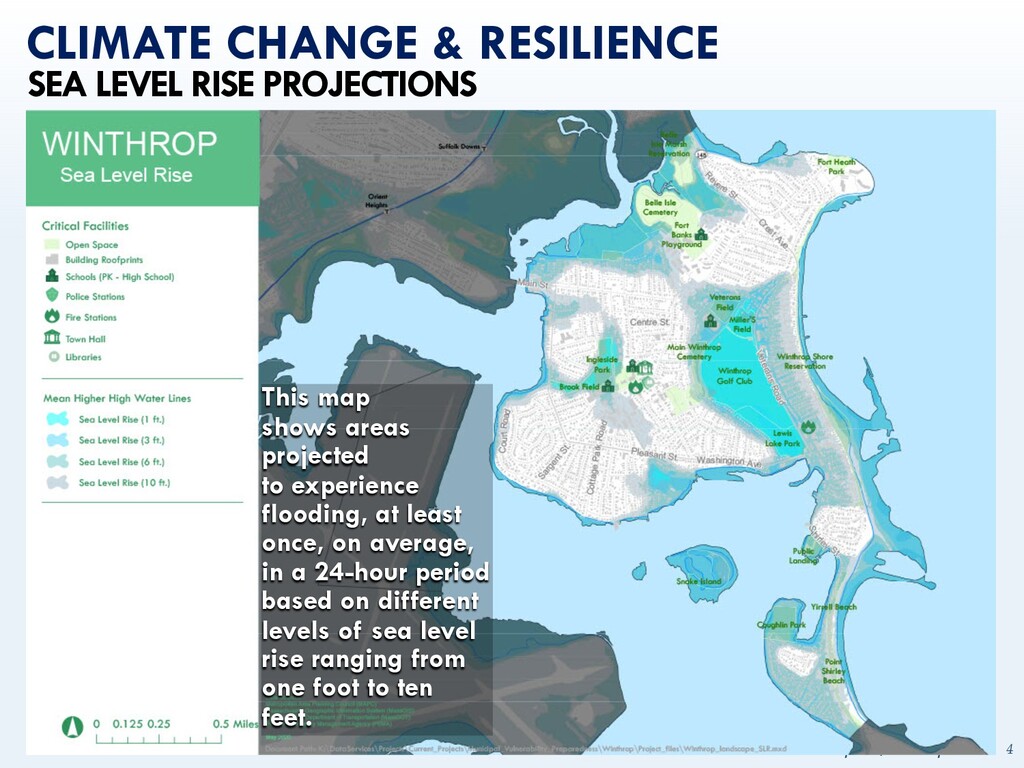
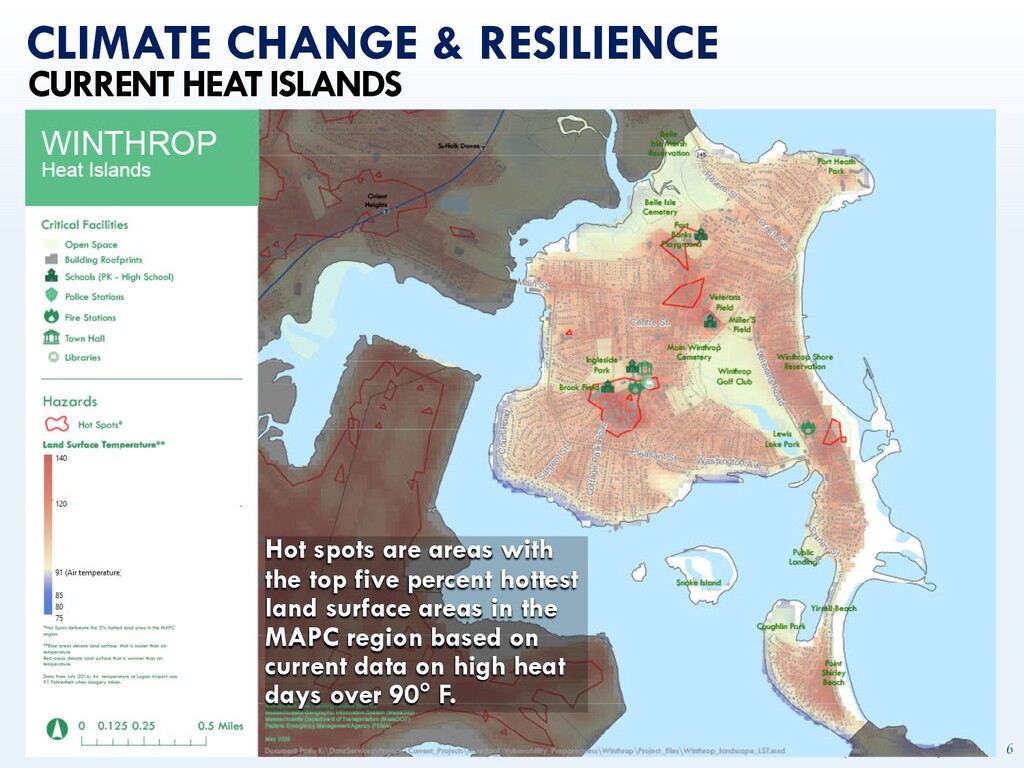
This map shows areas projected to experience flooding, at least once, on average, in a 24-hour period based on different levels of sea level rise ranging from one foot to ten feet.
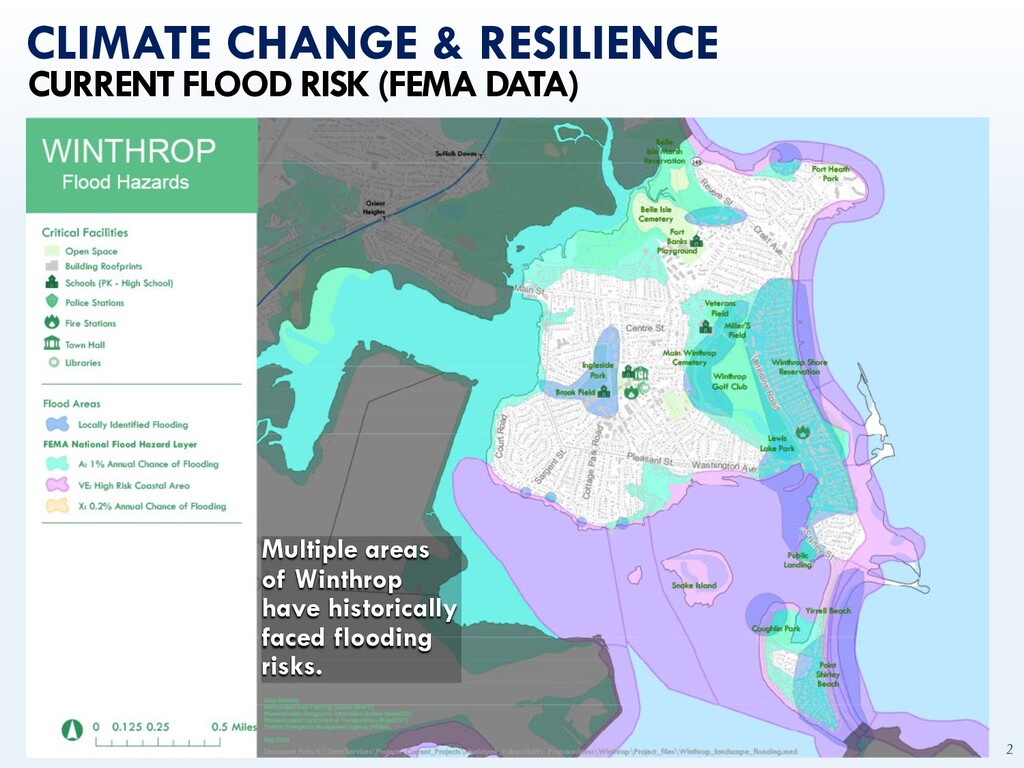
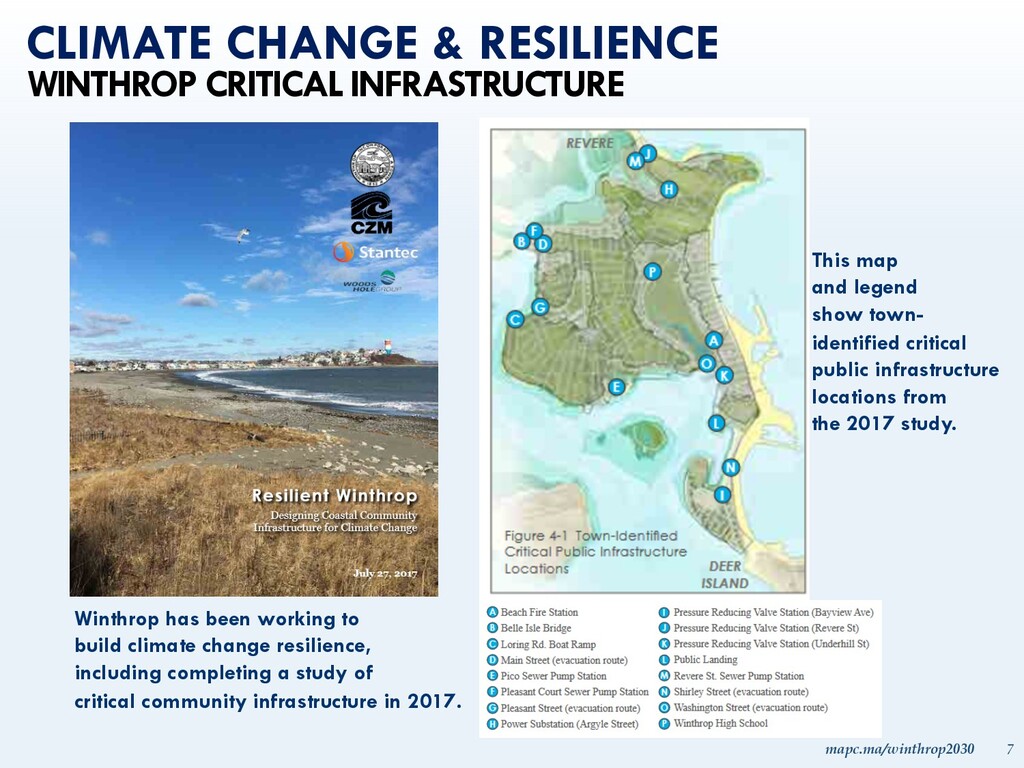
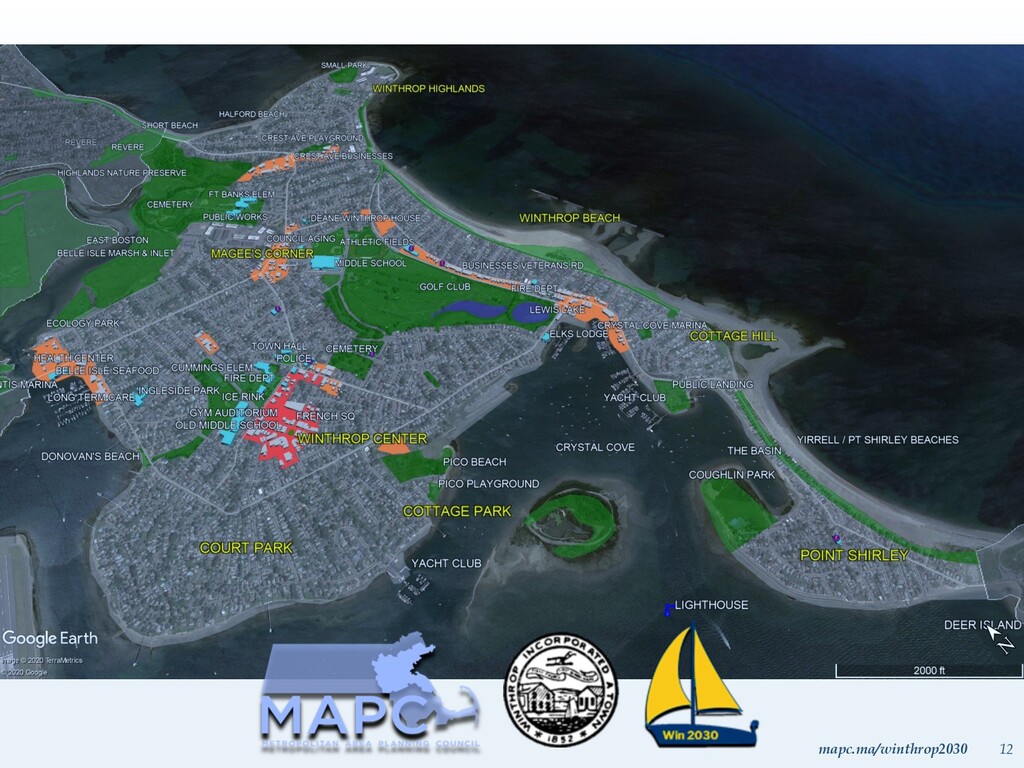
has been working to build climate change resilience, including completing a study of critical community infrastructure in 2017. This map and legend show town- identified critical public infrastructure locations from the 2017 study.
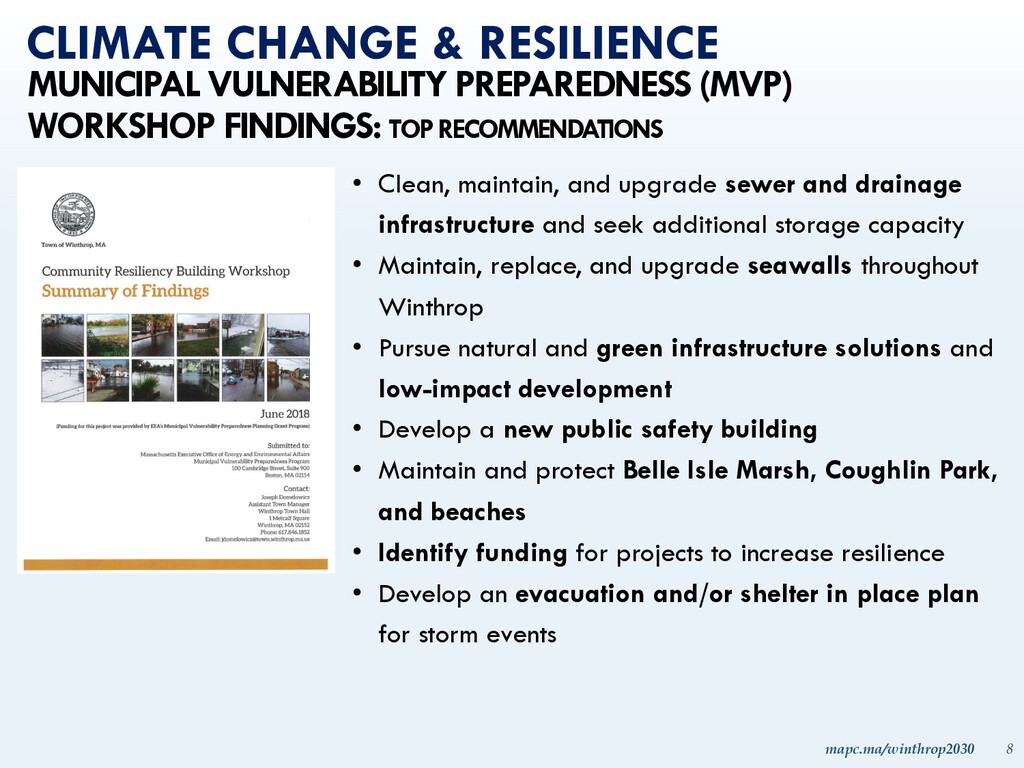
infrastructure and seek additional storage capacity • Maintain, replace, and upgrade seawalls throughout Winthrop • Pursue natural and green infrastructure solutions and low-impact development • Develop a new public safety building • Maintain and protect Belle Isle Marsh, Coughlin Park, and beaches • Identify funding for projects to increase resilience • Develop an evacuation and/or shelter in place plan for storm events CLIMATE CHANGE & RESILIENCE MUNICIPAL VULNERABILITY PREPAREDNESS (MVP) WORKSHOP FINDINGS: TOP RECOMMENDATIONS
floodproofing • Perimeter barriers and elevation of buildings and utilities • Green and gray infrastructure • Floodable infrastructure and elevating infrastructure • Policy and Planning • Zoning tools to account for future floodplain projections • Resilience checklist for new development and retrofits • Voluntary design guidelines for new development and retrofits • Community Programs • Programs to increase personal/family and business resiliency and preparedness • Updated emergency response plan CLIMATE CHANGE & RESILIENCE CATEGORIES FOR POTENTIAL FLOOD RISK REDUCTION SOLUTIONS