Upgrade to Pro — share decks privately, control downloads, hide ads and more …

Smart City & Economic Development Insights for ...

Smart City & Economic Development Insights for Civic Leaders

Empower your city’s growth with AI-driven analytics. MapZot.AI helps civic departments identify retail leakage, track tourism trends, and measure event success for smarter urban planning.

https://bit.ly/4hTMY3v

#economicimpactanalysis, #retailsalesdata, #useconomicdata, #economicdataanalysis, #benefitsofeconomicgrowth, #useconomyanalysis, #freeeconomicdata, #latesteconomicdata, #economicdevelopmentdata, #impactofbusinessineconomy, #communityeconomicanalysis, #economicforecastus

Avatar for James Williams

James Williams

November 11, 2025

More Decks by James Williams

Other Decks in Business

Transcript

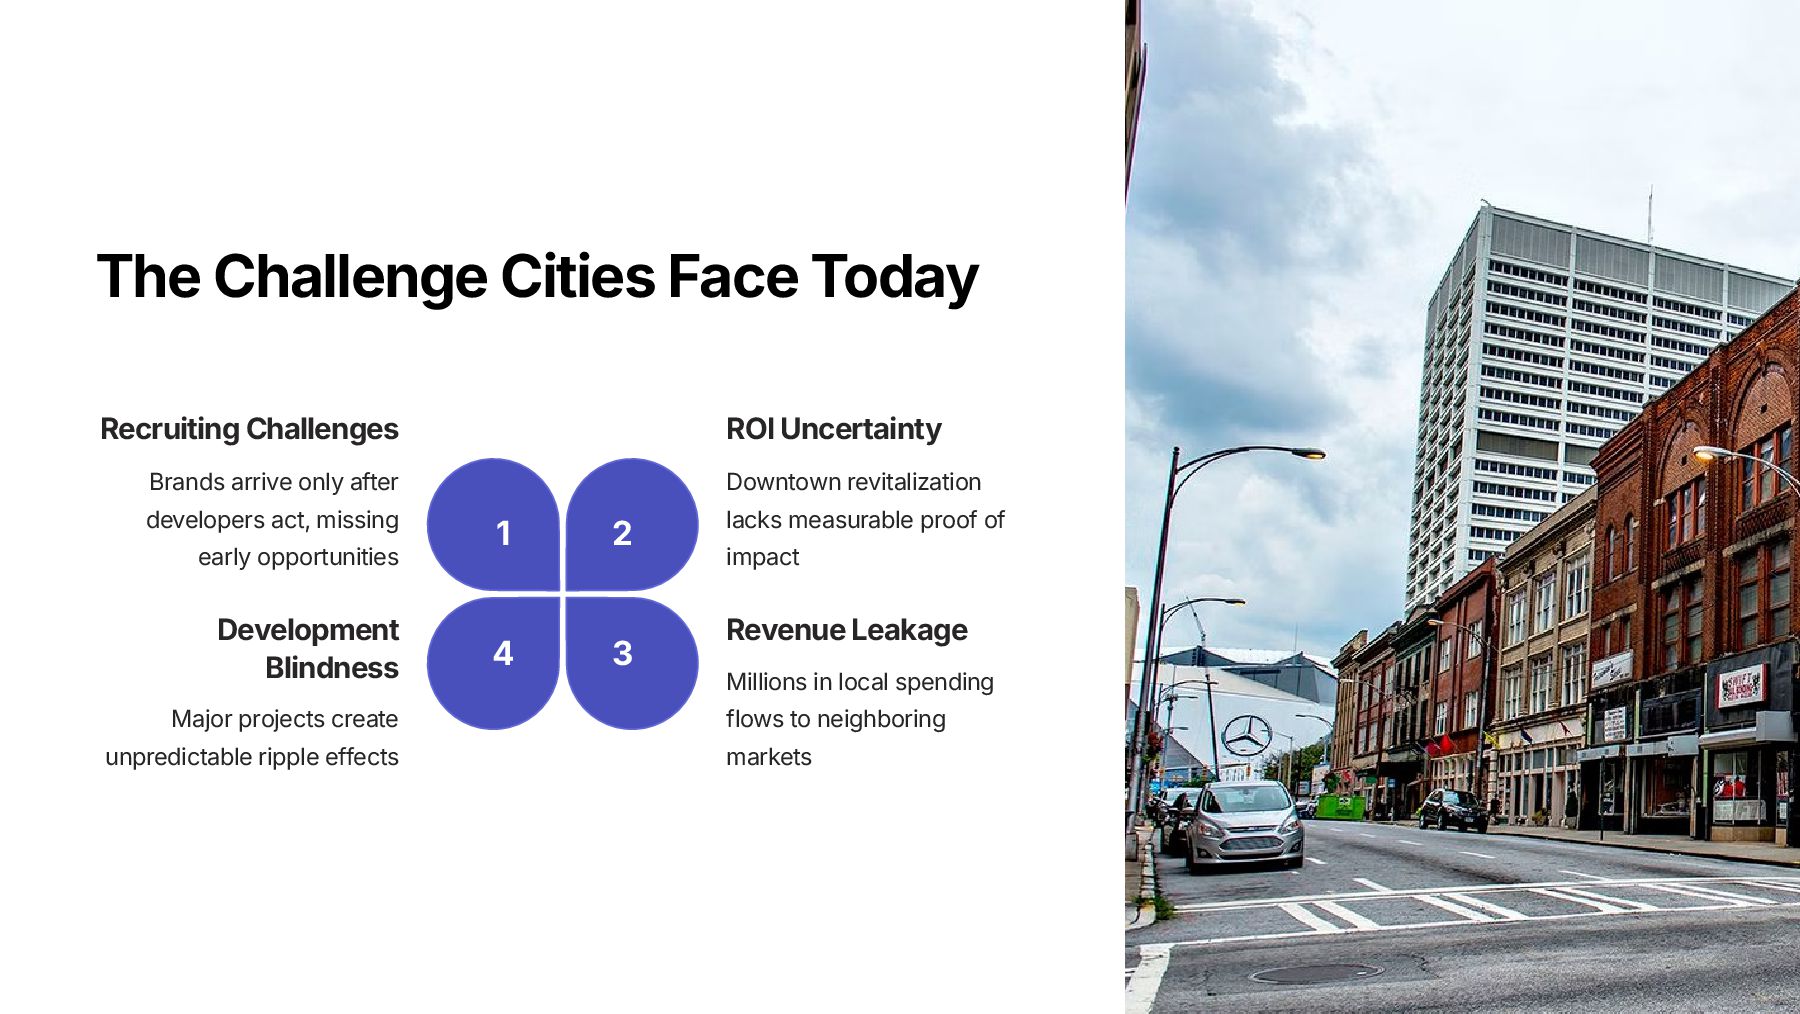
  1. The Challenge Cities Face Today 1 2 3 4 Recruiting

    Challenges Brands arrive only after developers act, missing early opportunities ROI Uncertainty Downtown revitalization lacks measurable proof of impact Revenue Leakage Millions in local spending flows to neighboring markets Development Blindness Major projects create unpredictable ripple effects
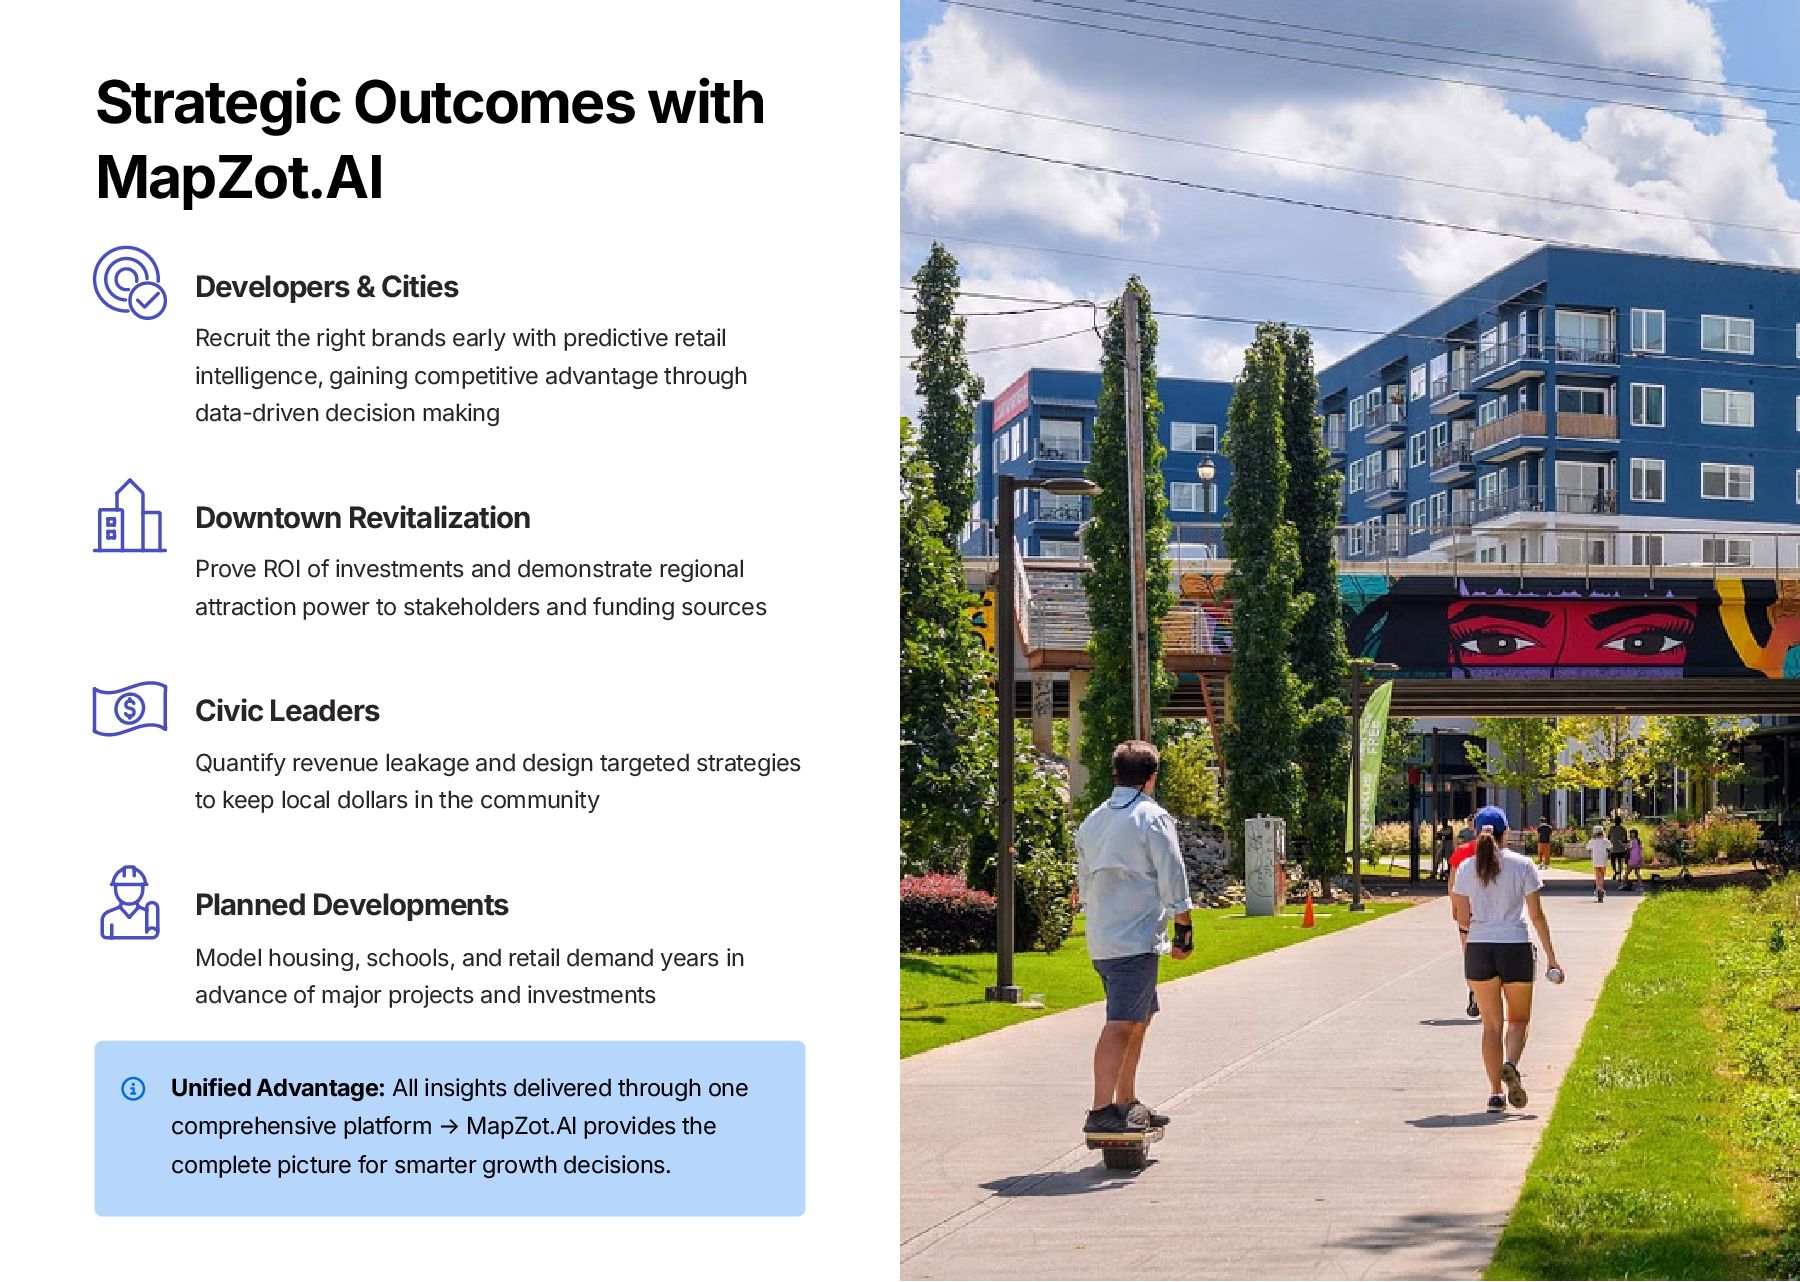
  2. Strategic Outcomes with MapZot.AI Developers & Cities Recruit the right

    brands early with predictive retail intelligence, gaining competitive advantage through data-driven decision making Downtown Revitalization Prove ROI of investments and demonstrate regional attraction power to stakeholders and funding sources Civic Leaders Quantify revenue leakage and design targeted strategies to keep local dollars in the community Planned Developments Model housing, schools, and retail demand years in advance of major projects and investments Unified Advantage: All insights delivered through one comprehensive platform ³ MapZot.AI provides the complete picture for smarter growth decisions.
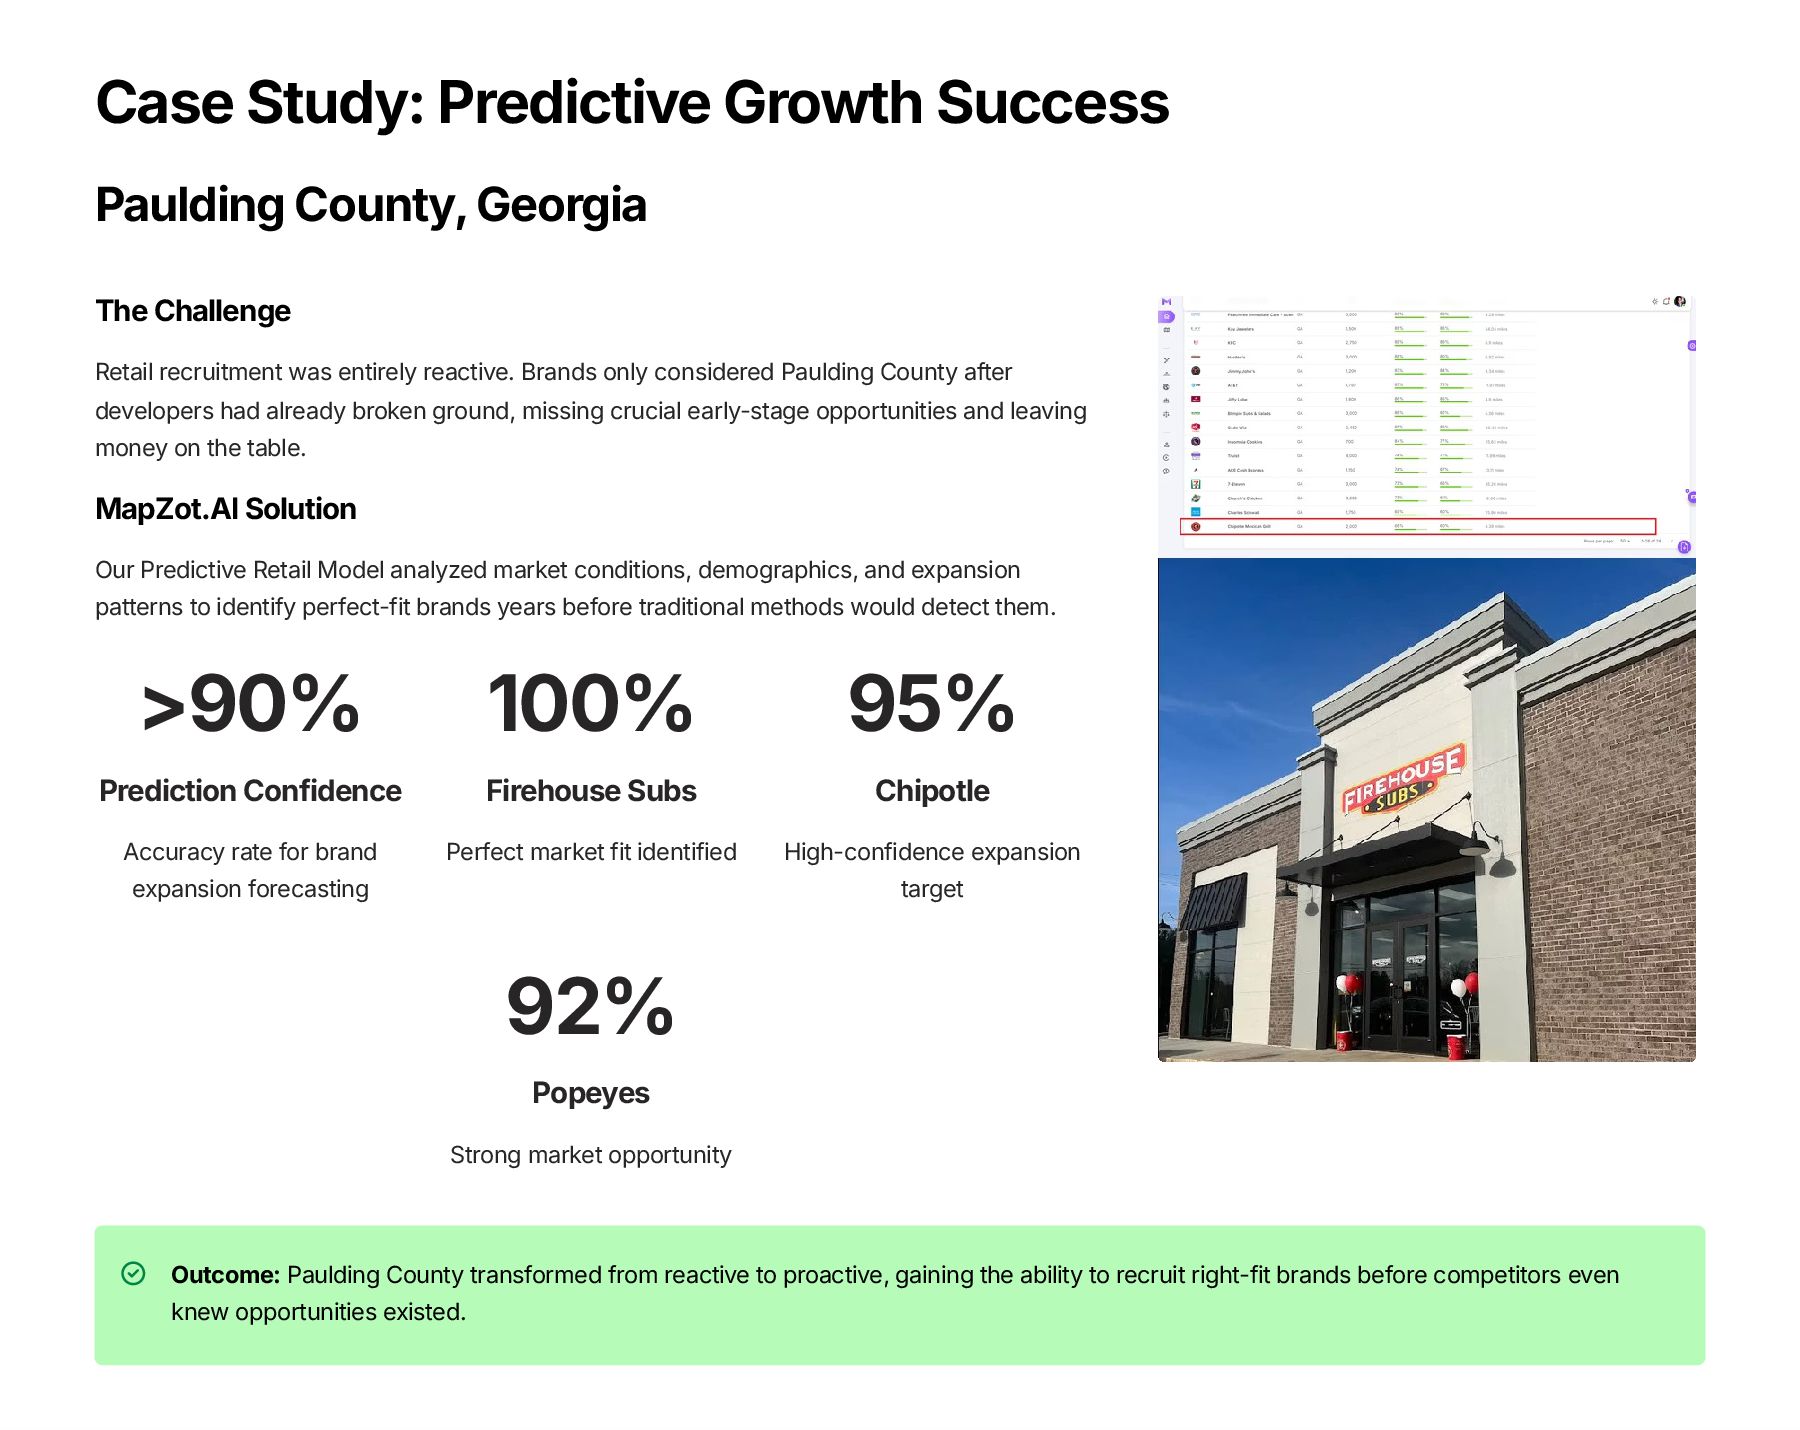
  3. Case Study: Predictive Growth Success Paulding County, Georgia The Challenge

    Retail recruitment was entirely reactive. Brands only considered Paulding County after developers had already broken ground, missing crucial early-stage opportunities and leaving money on the table. MapZot.AI Solution Our Predictive Retail Model analyzed market conditions, demographics, and expansion patterns to identify perfect-fit brands years before traditional methods would detect them. >90% Prediction Confidence Accuracy rate for brand expansion forecasting 100% Firehouse Subs Perfect market fit identified 95% Chipotle High-confidence expansion target 92% Popeyes Strong market opportunity Outcome: Paulding County transformed from reactive to proactive, gaining the ability to recruit right-fit brands before competitors even knew opportunities existed.
  4. Case Study: Proving Revitalization ROI Powder Springs, Georgia The Challenge

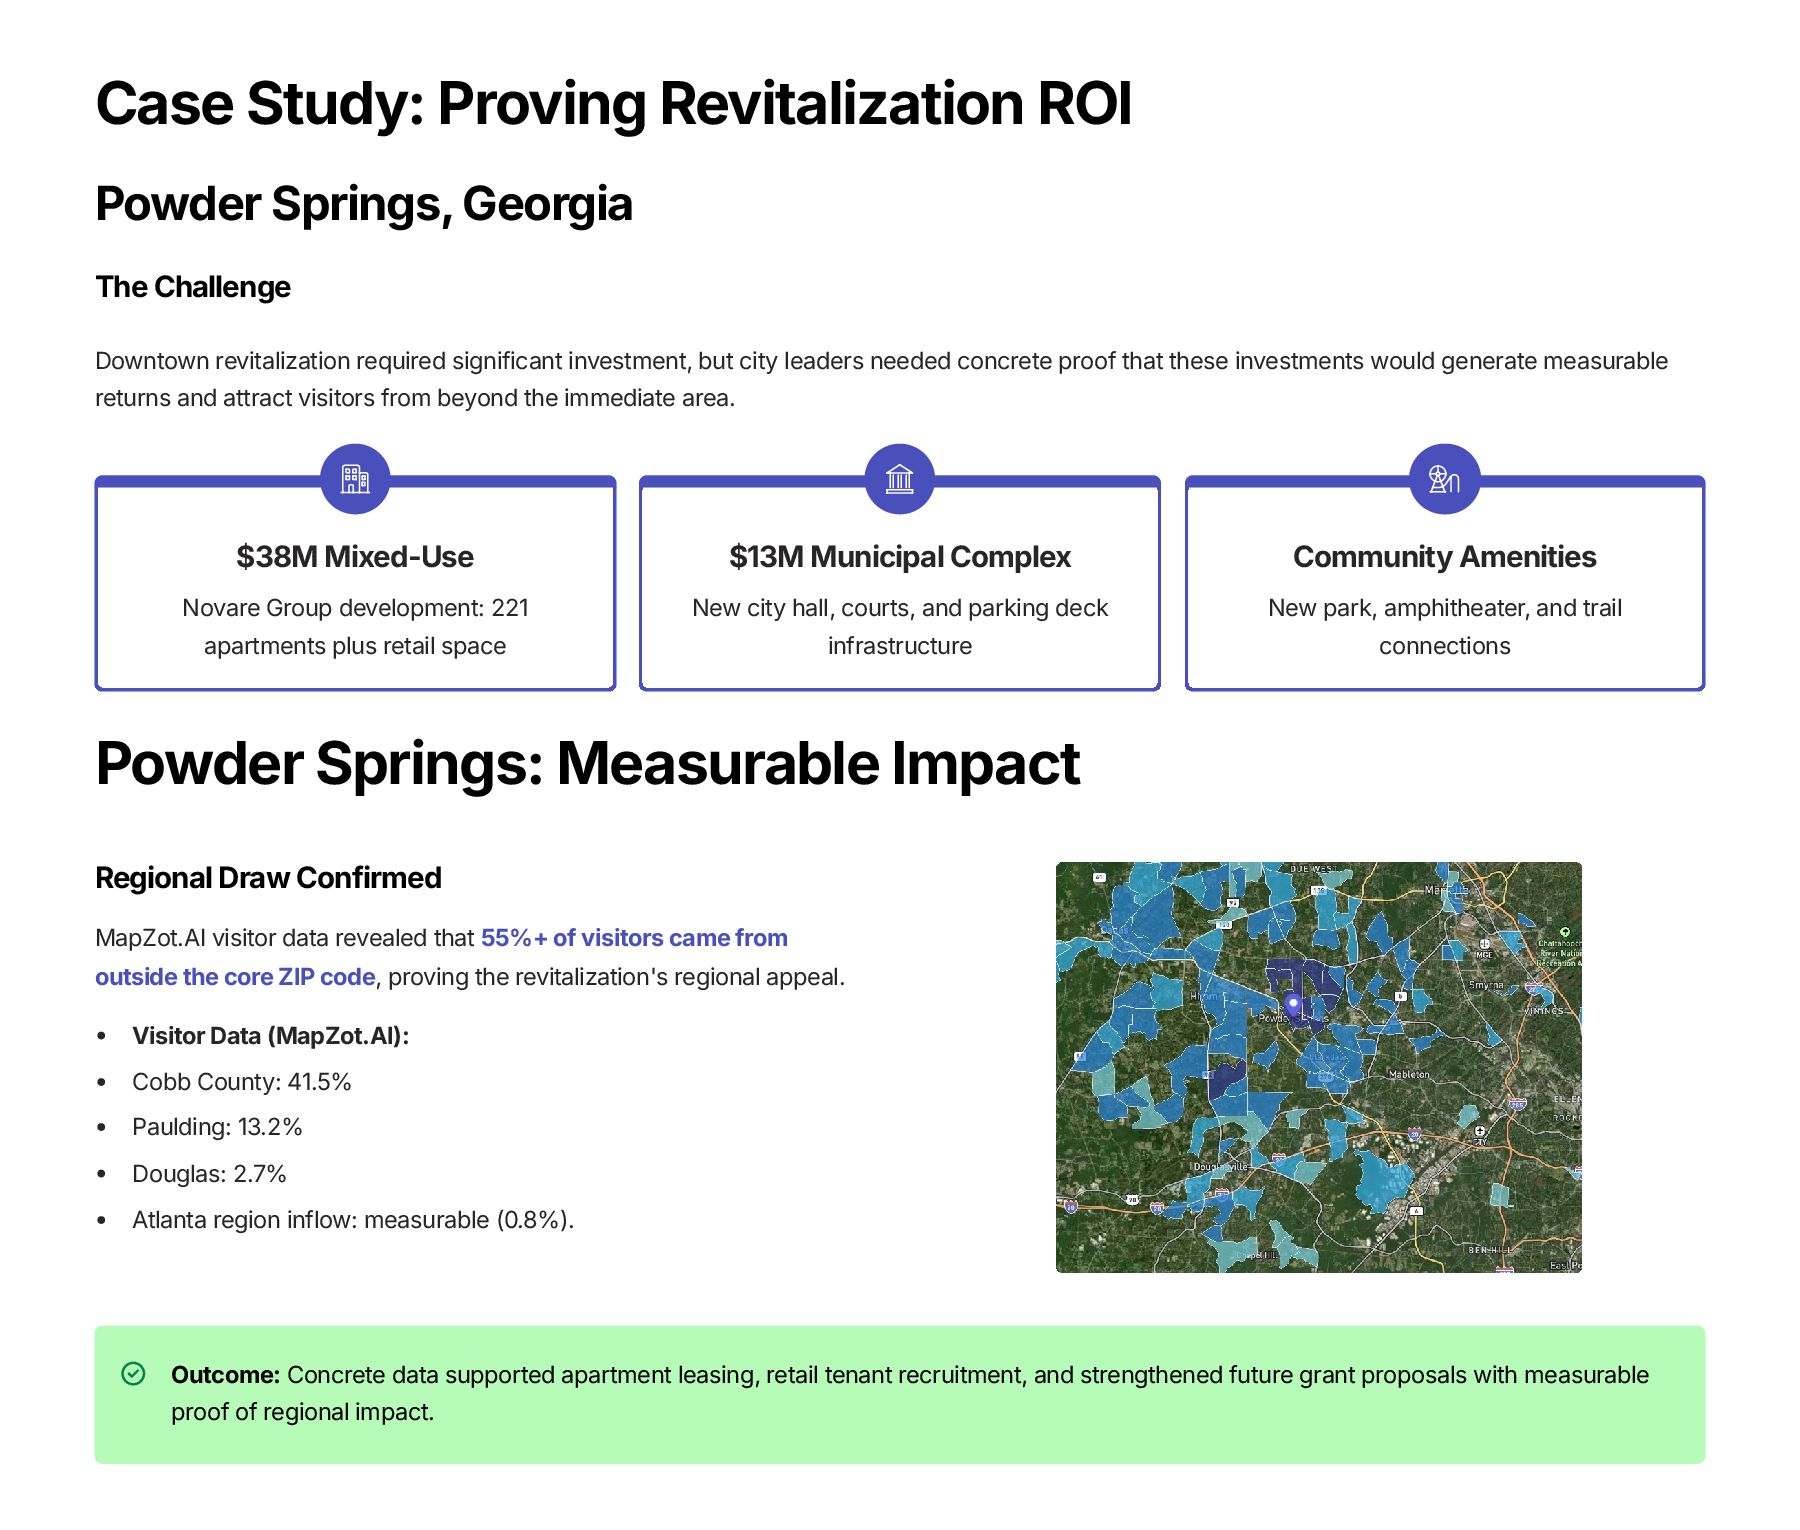
    Downtown revitalization required significant investment, but city leaders needed concrete proof that these investments would generate measurable returns and attract visitors from beyond the immediate area. $38M Mixed-Use Novare Group development: 221 apartments plus retail space $13M Municipal Complex New city hall, courts, and parking deck infrastructure Community Amenities New park, amphitheater, and trail connections Powder Springs: Measurable Impact Regional Draw Confirmed MapZot.AI visitor data revealed that 55%+ of visitors came from outside the core ZIP code, proving the revitalization's regional appeal. Visitor Data (MapZot.AI): Cobb County: 41.5% Paulding: 13.2% Douglas: 2.7% Atlanta region inflow: measurable (0.8%). Outcome: Concrete data supported apartment leasing, retail tenant recruitment, and strengthened future grant proposals with measurable proof of regional impact.
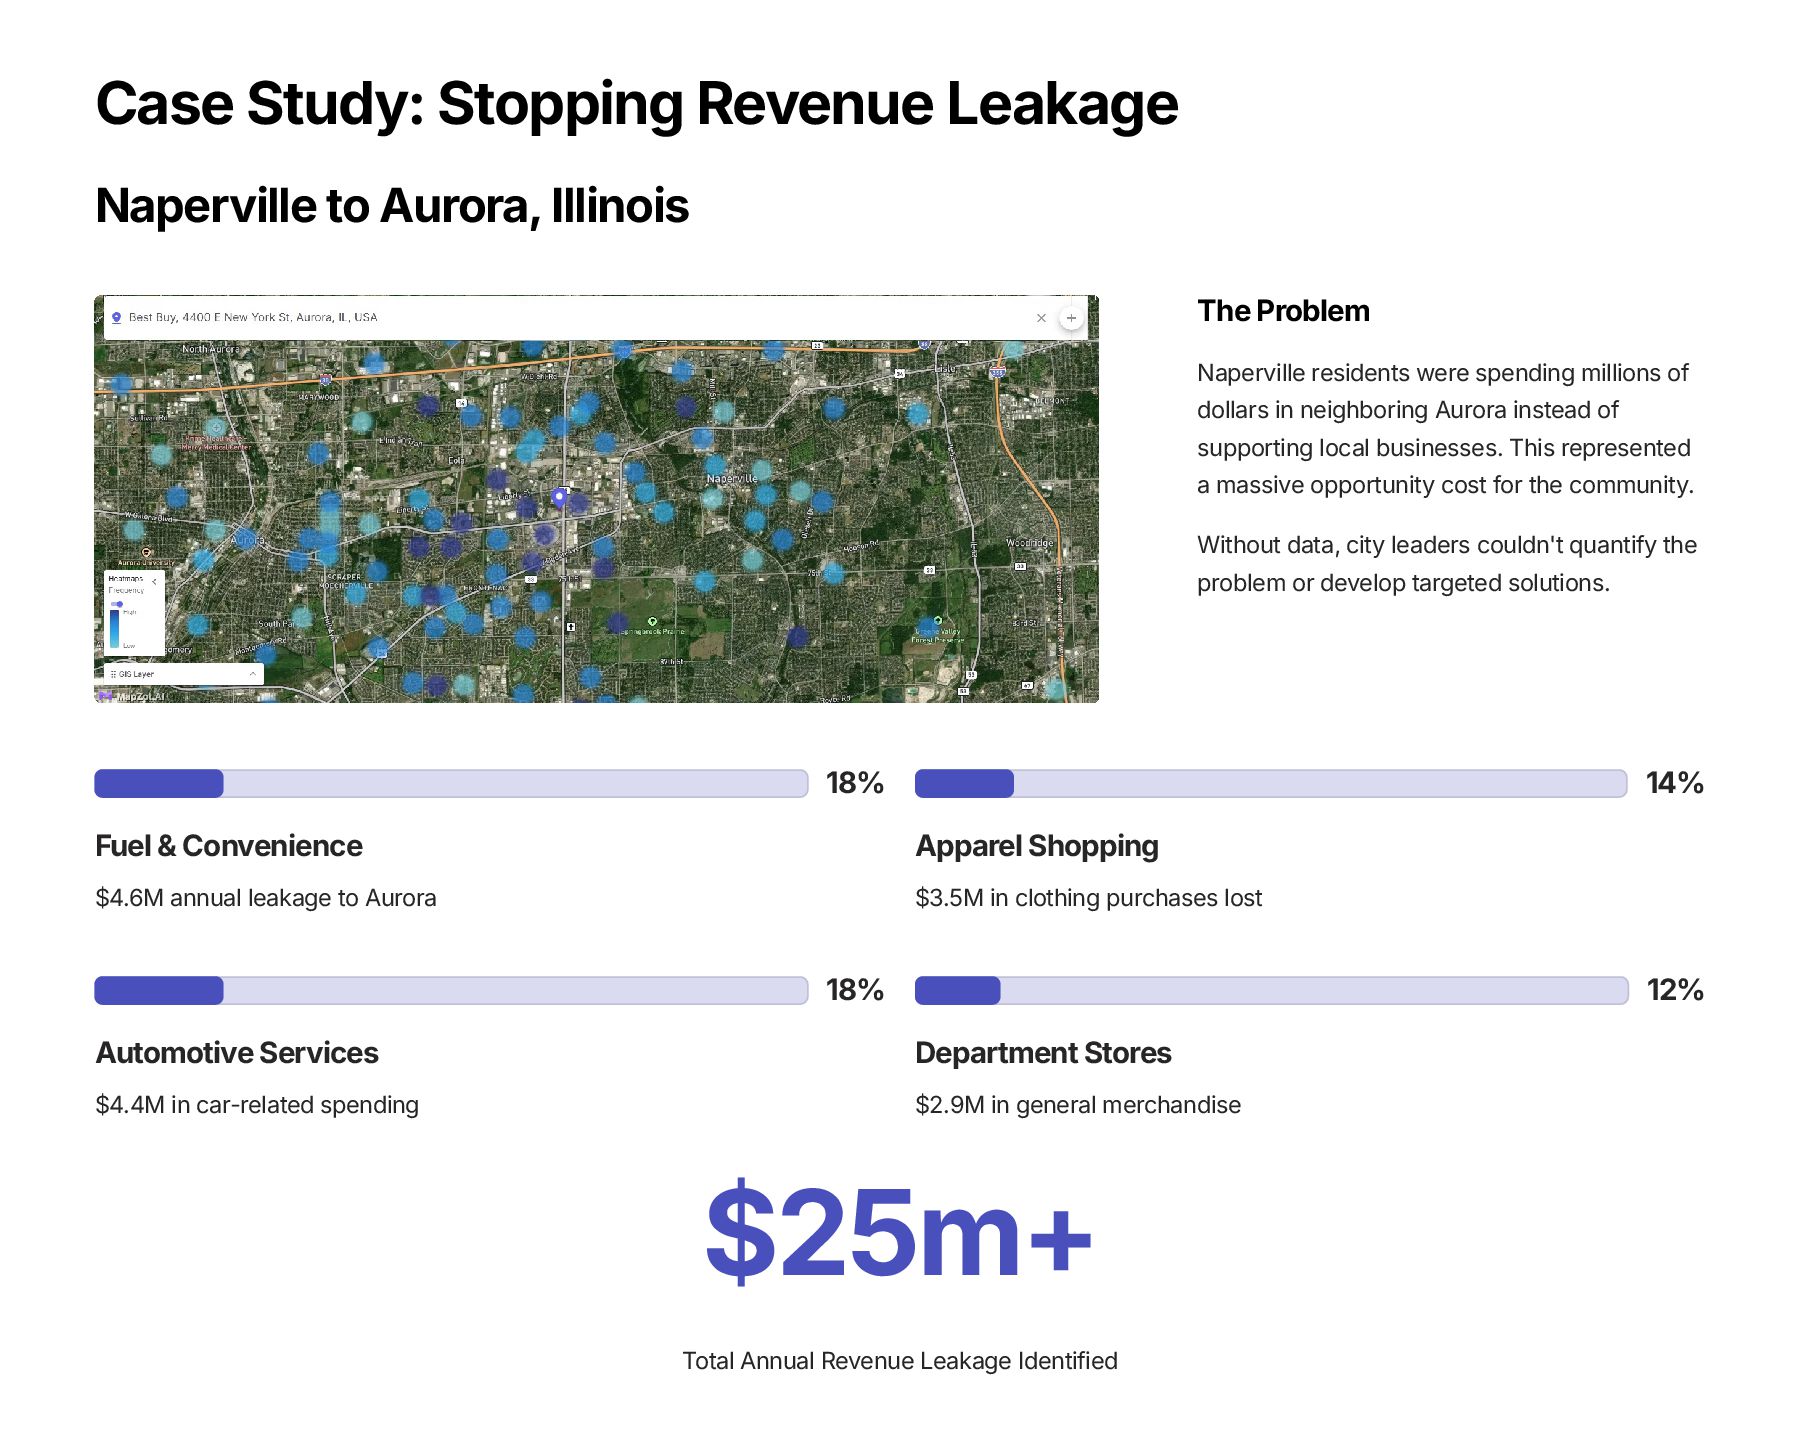
  5. Case Study: Stopping Revenue Leakage Naperville to Aurora, Illinois The

    Problem Naperville residents were spending millions of dollars in neighboring Aurora instead of supporting local businesses. This represented a massive opportunity cost for the community. Without data, city leaders couldn't quantify the problem or develop targeted solutions. 18% Fuel & Convenience $4.6M annual leakage to Aurora 14% Apparel Shopping $3.5M in clothing purchases lost 18% Automotive Services $4.4M in car-related spending 12% Department Stores $2.9M in general merchandise $25m+ Total Annual Revenue Leakage Identified
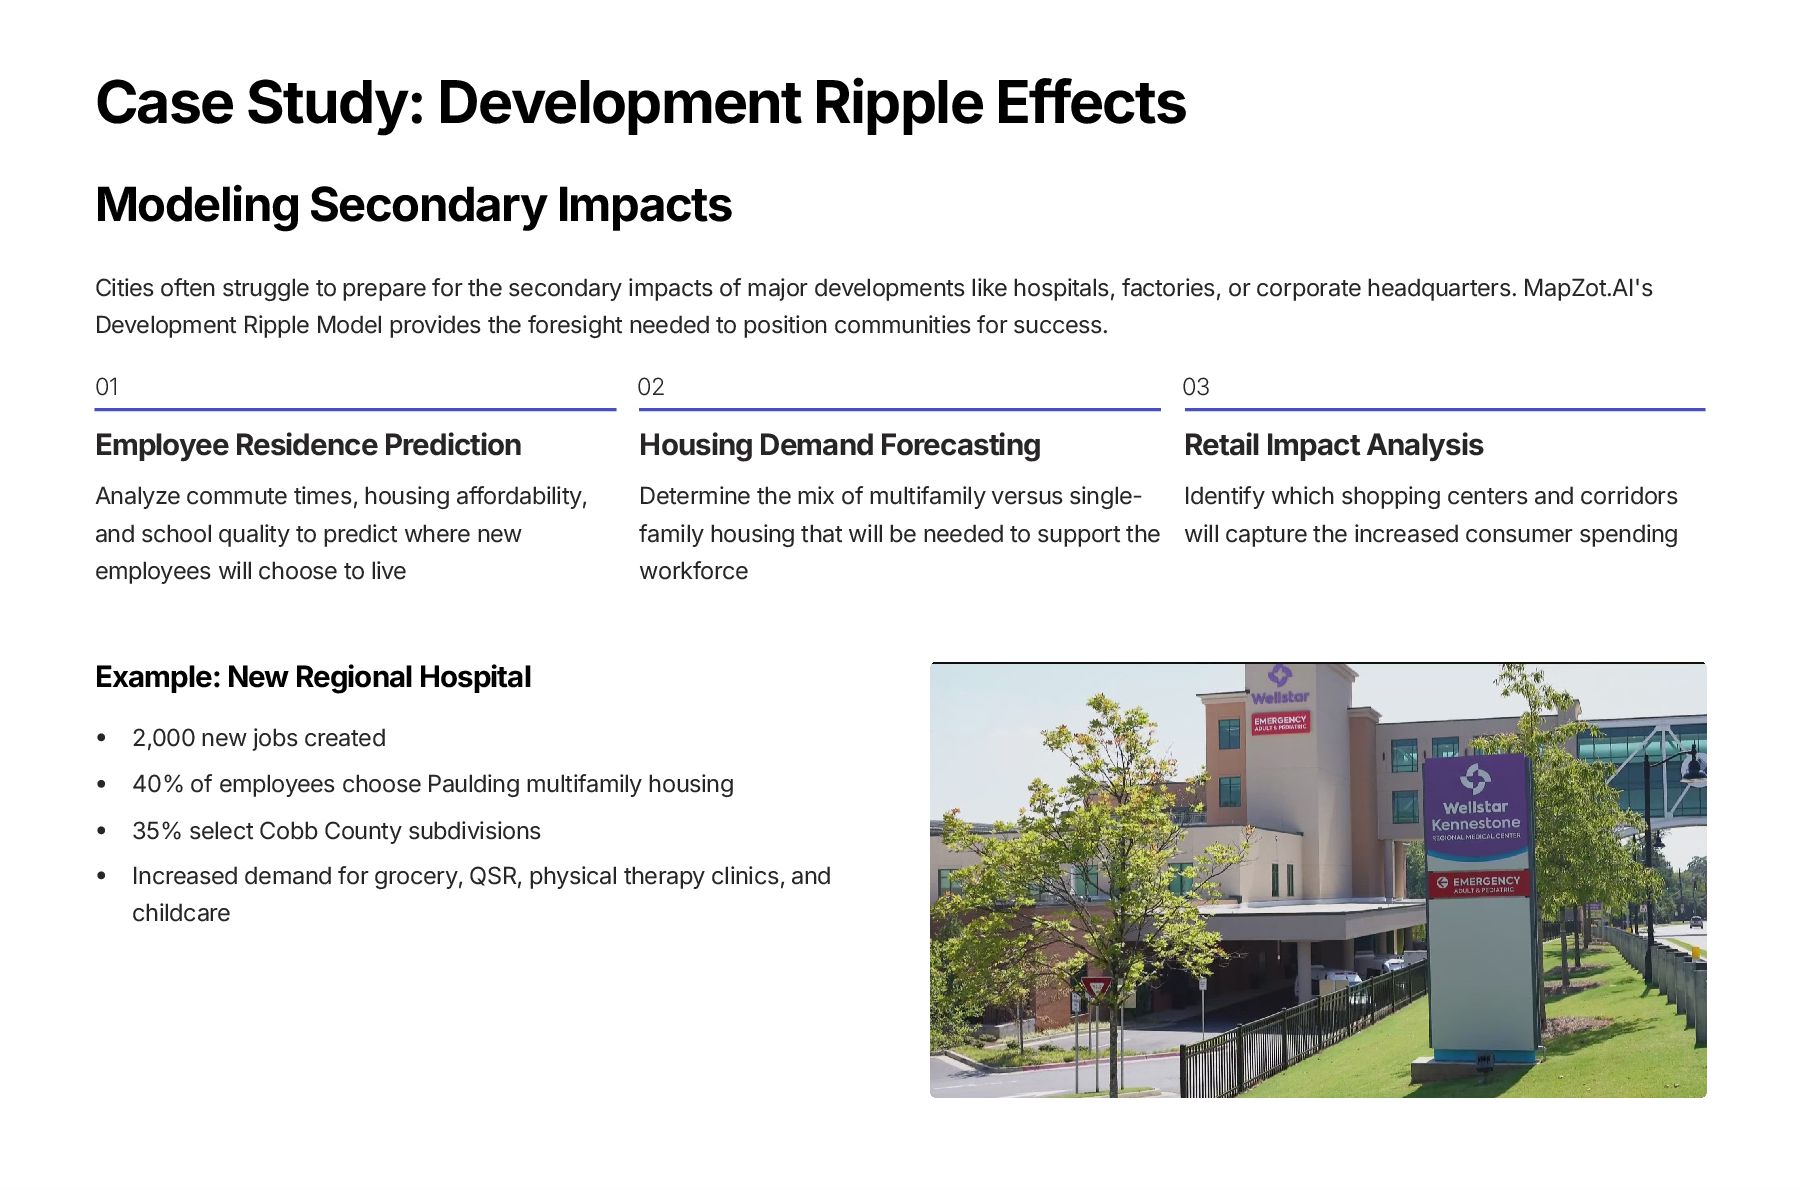
  6. Case Study: Development Ripple Effects Modeling Secondary Impacts Cities often

    struggle to prepare for the secondary impacts of major developments like hospitals, factories, or corporate headquarters. MapZot.AI's Development Ripple Model provides the foresight needed to position communities for success. 01 Employee Residence Prediction Analyze commute times, housing affordability, and school quality to predict where new employees will choose to live 02 Housing Demand Forecasting Determine the mix of multifamily versus single- family housing that will be needed to support the workforce 03 Retail Impact Analysis Identify which shopping centers and corridors will capture the increased consumer spending Example: New Regional Hospital 2,000 new jobs created 40% of employees choose Paulding multifamily housing 35% select Cobb County subdivisions Increased demand for grocery, QSR, physical therapy clinics, and childcare
  7. Ready to Transform Your Community? 1 Start with a Pilot

    Apply MapZot.AI to one district, corridor, or major project to demonstrate immediate value and build confidence 2 Deploy Full Intelligence Implement predictive growth, revitalization analytics, leakage modeling, and ripple effect forecasting 3 Scale for Impact Expand across your entire city or county to achieve measurable growth in jobs, tax base, and investor confidence Join us in kickstarting your community's transformation. Website Instagram Facebook