A Percona Support Engineer Walkthrough on pt-stalk
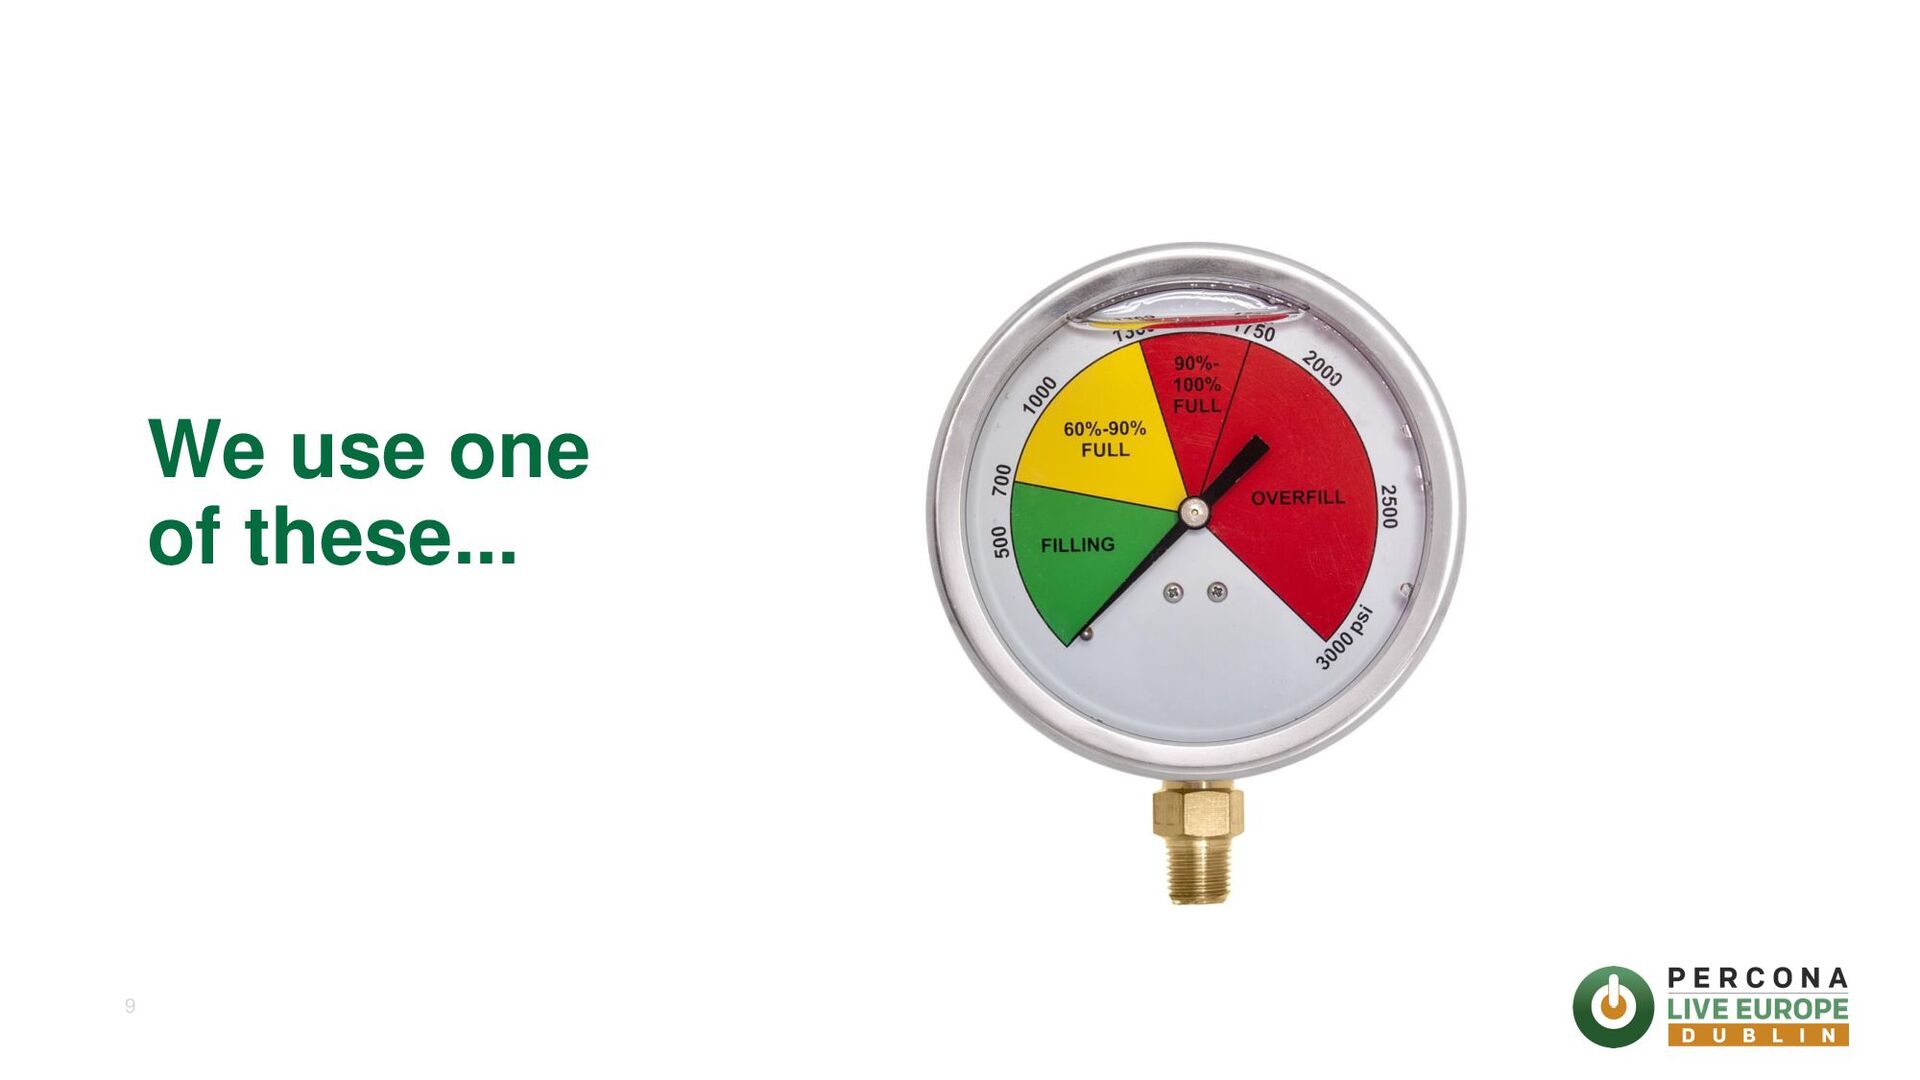
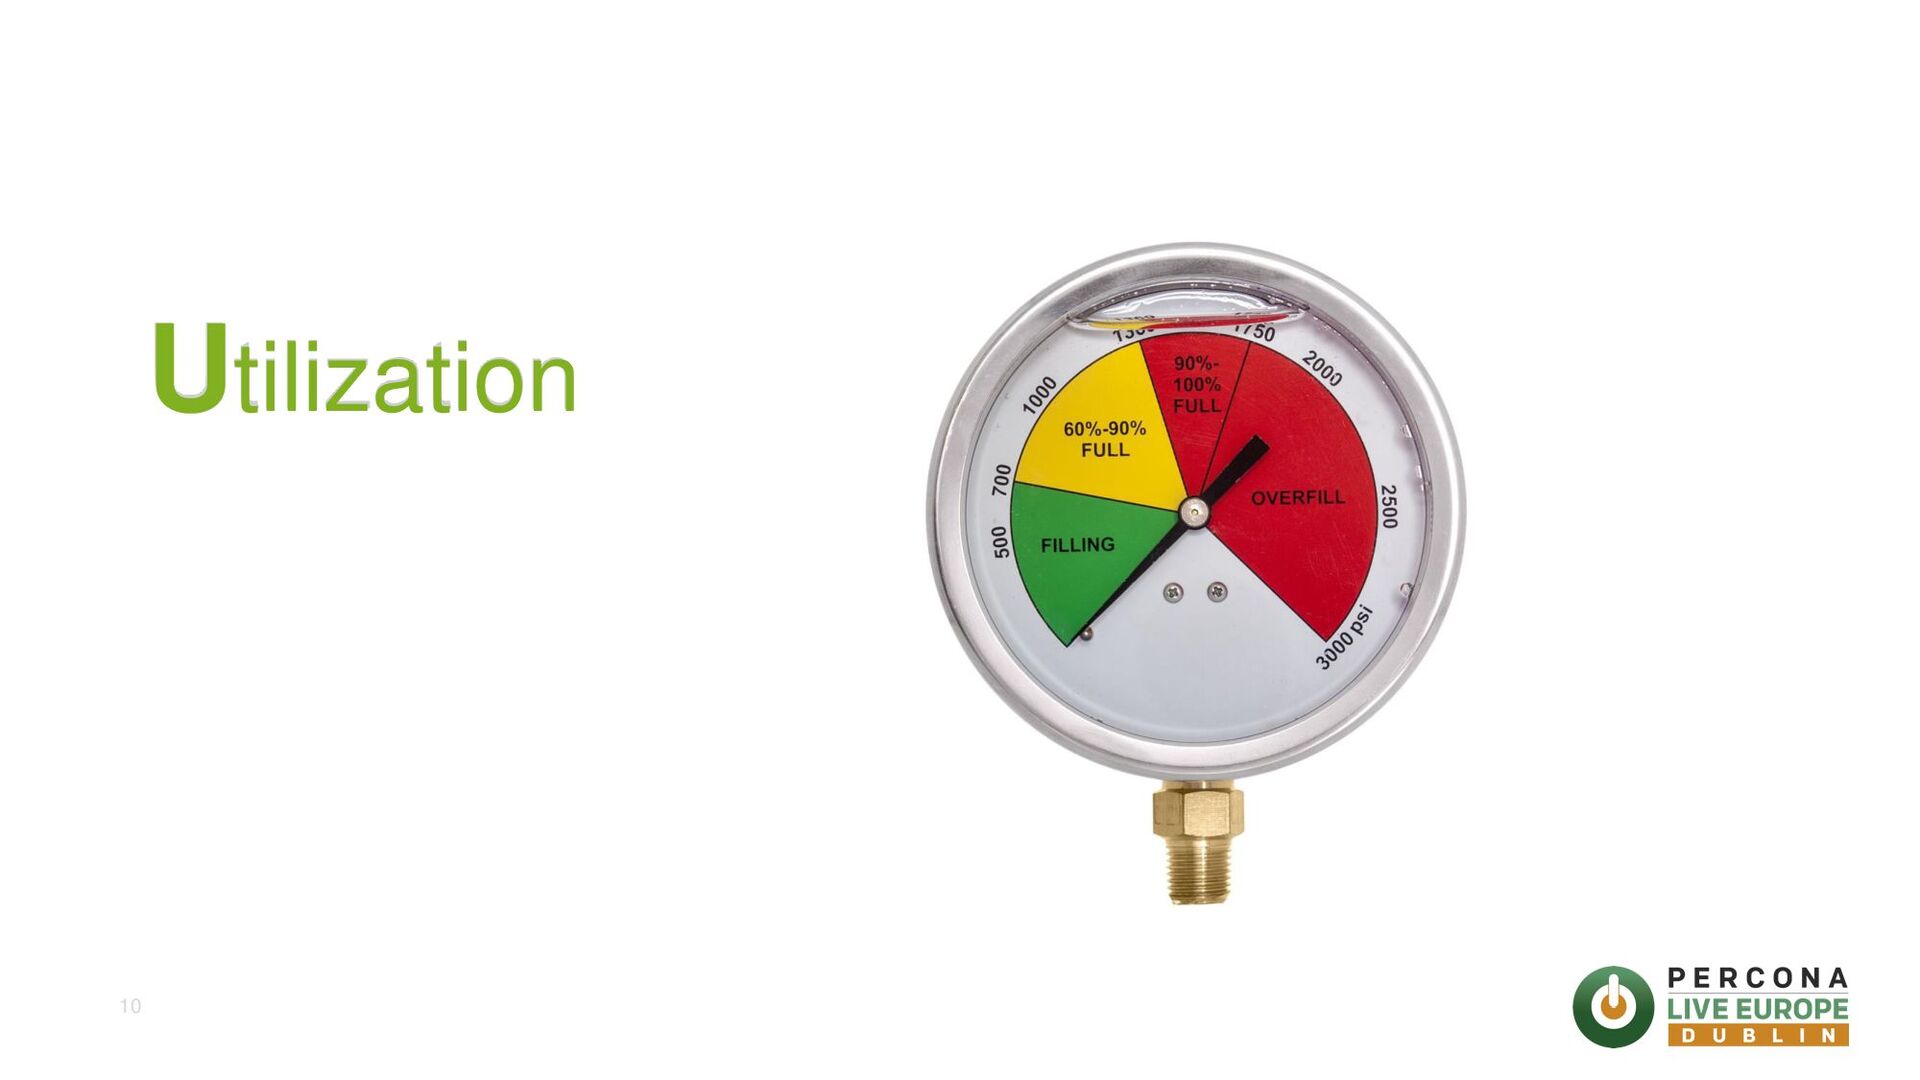
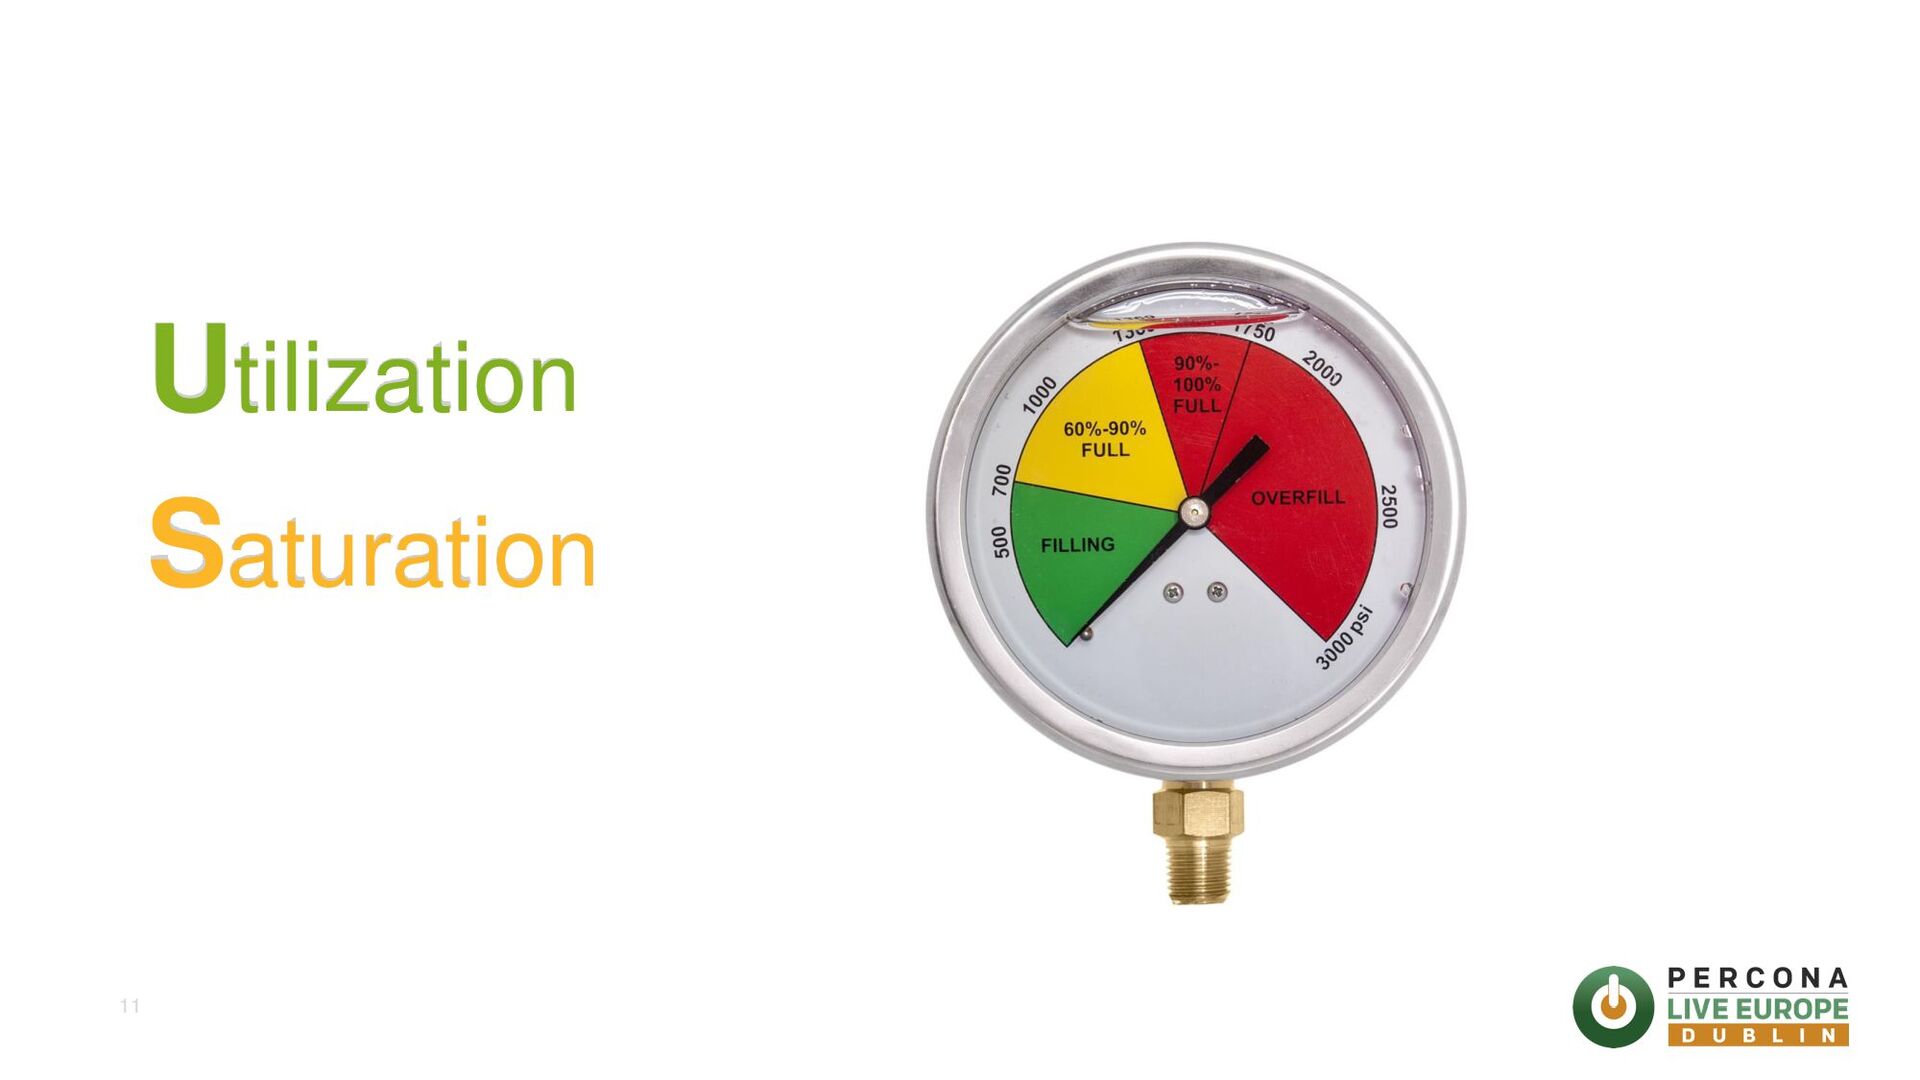
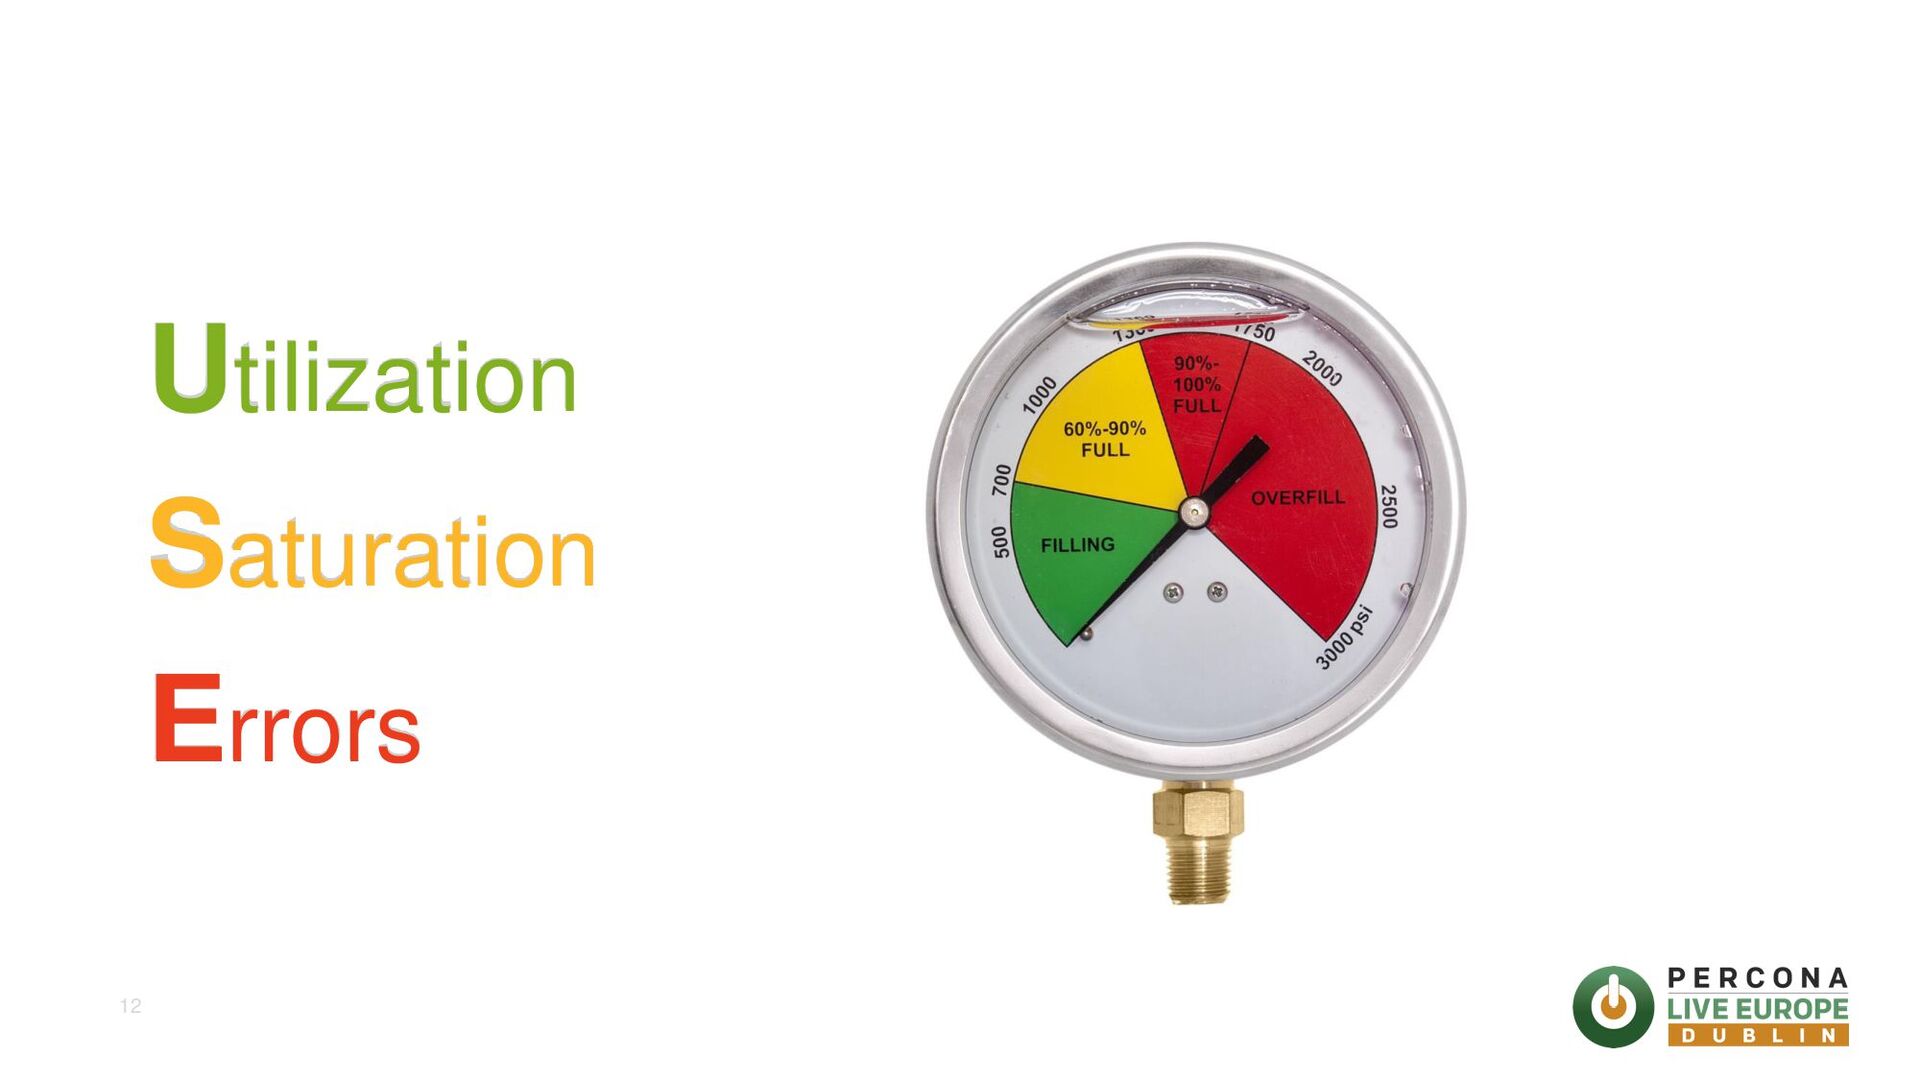
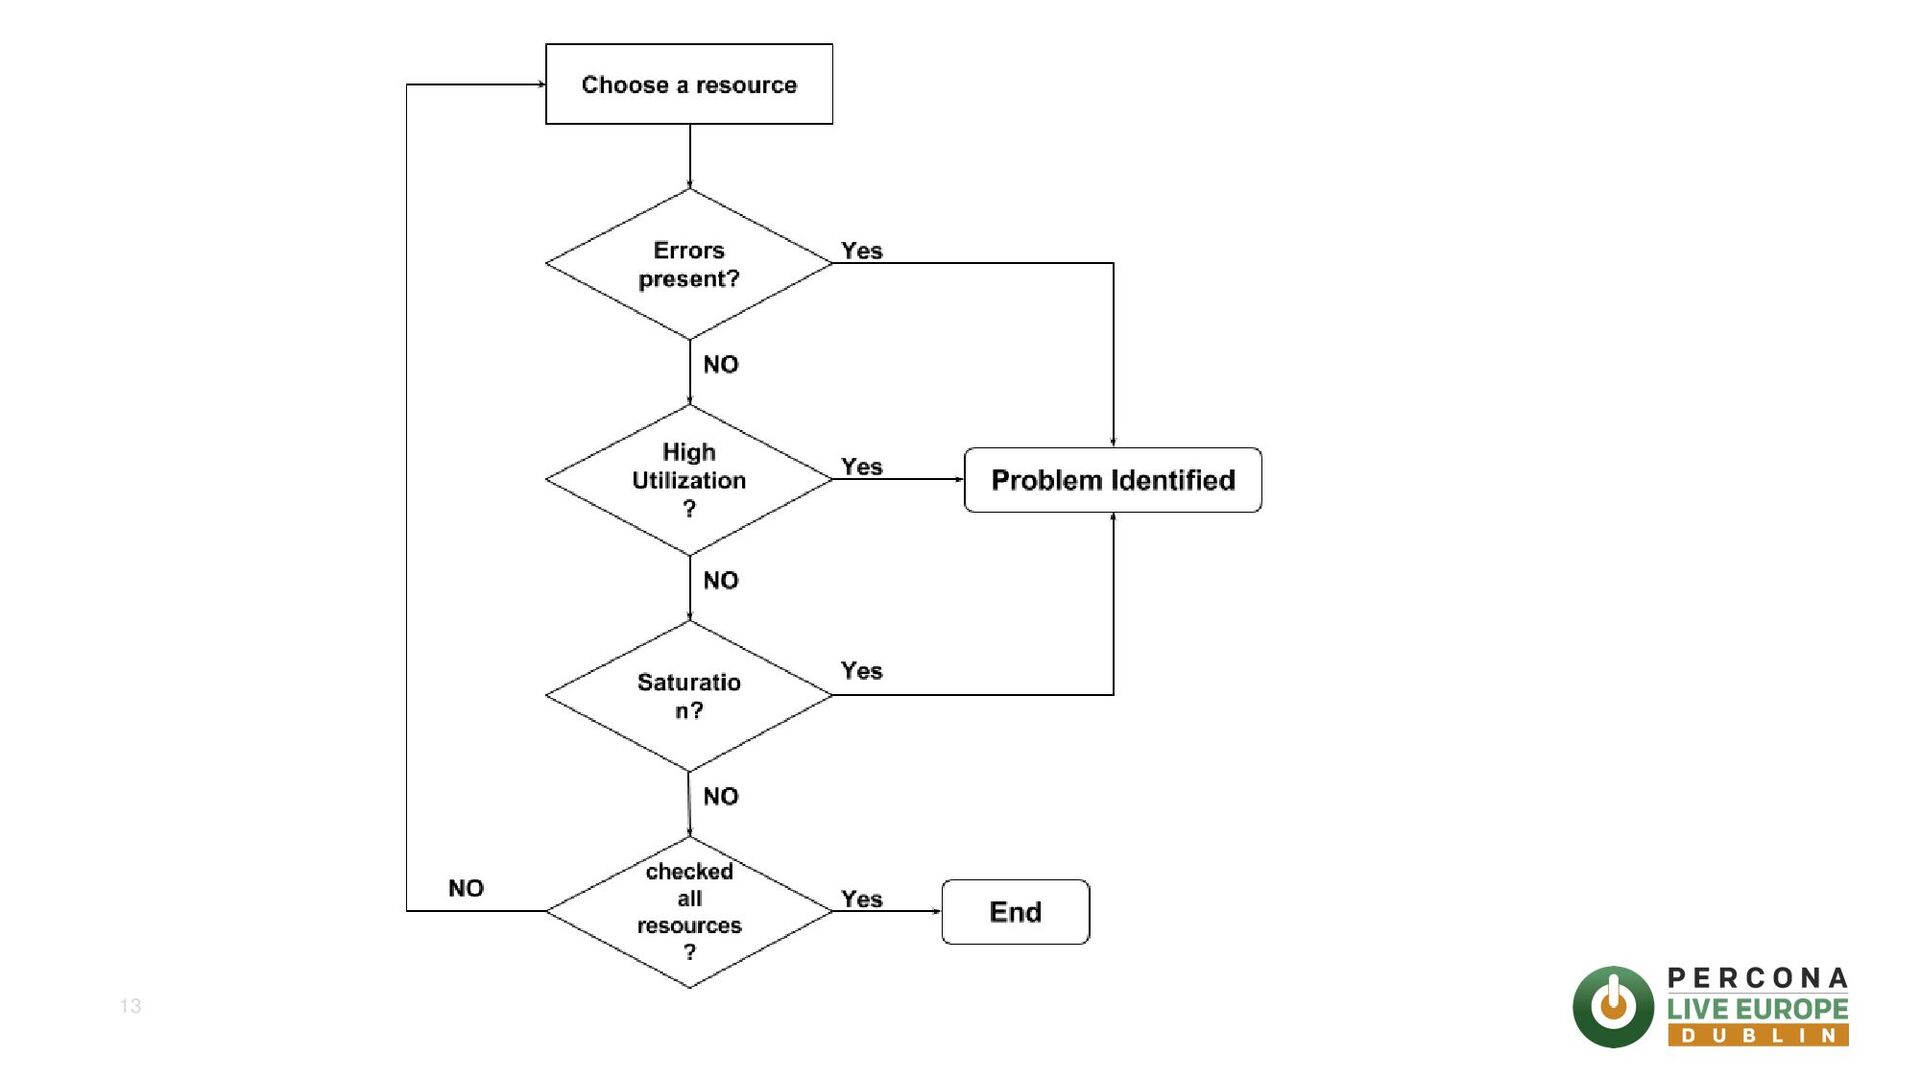
This presentation shows the approach we use to diagnostic performance issues on the customer. We explain the USE method and how you can relate it with pt-stalk
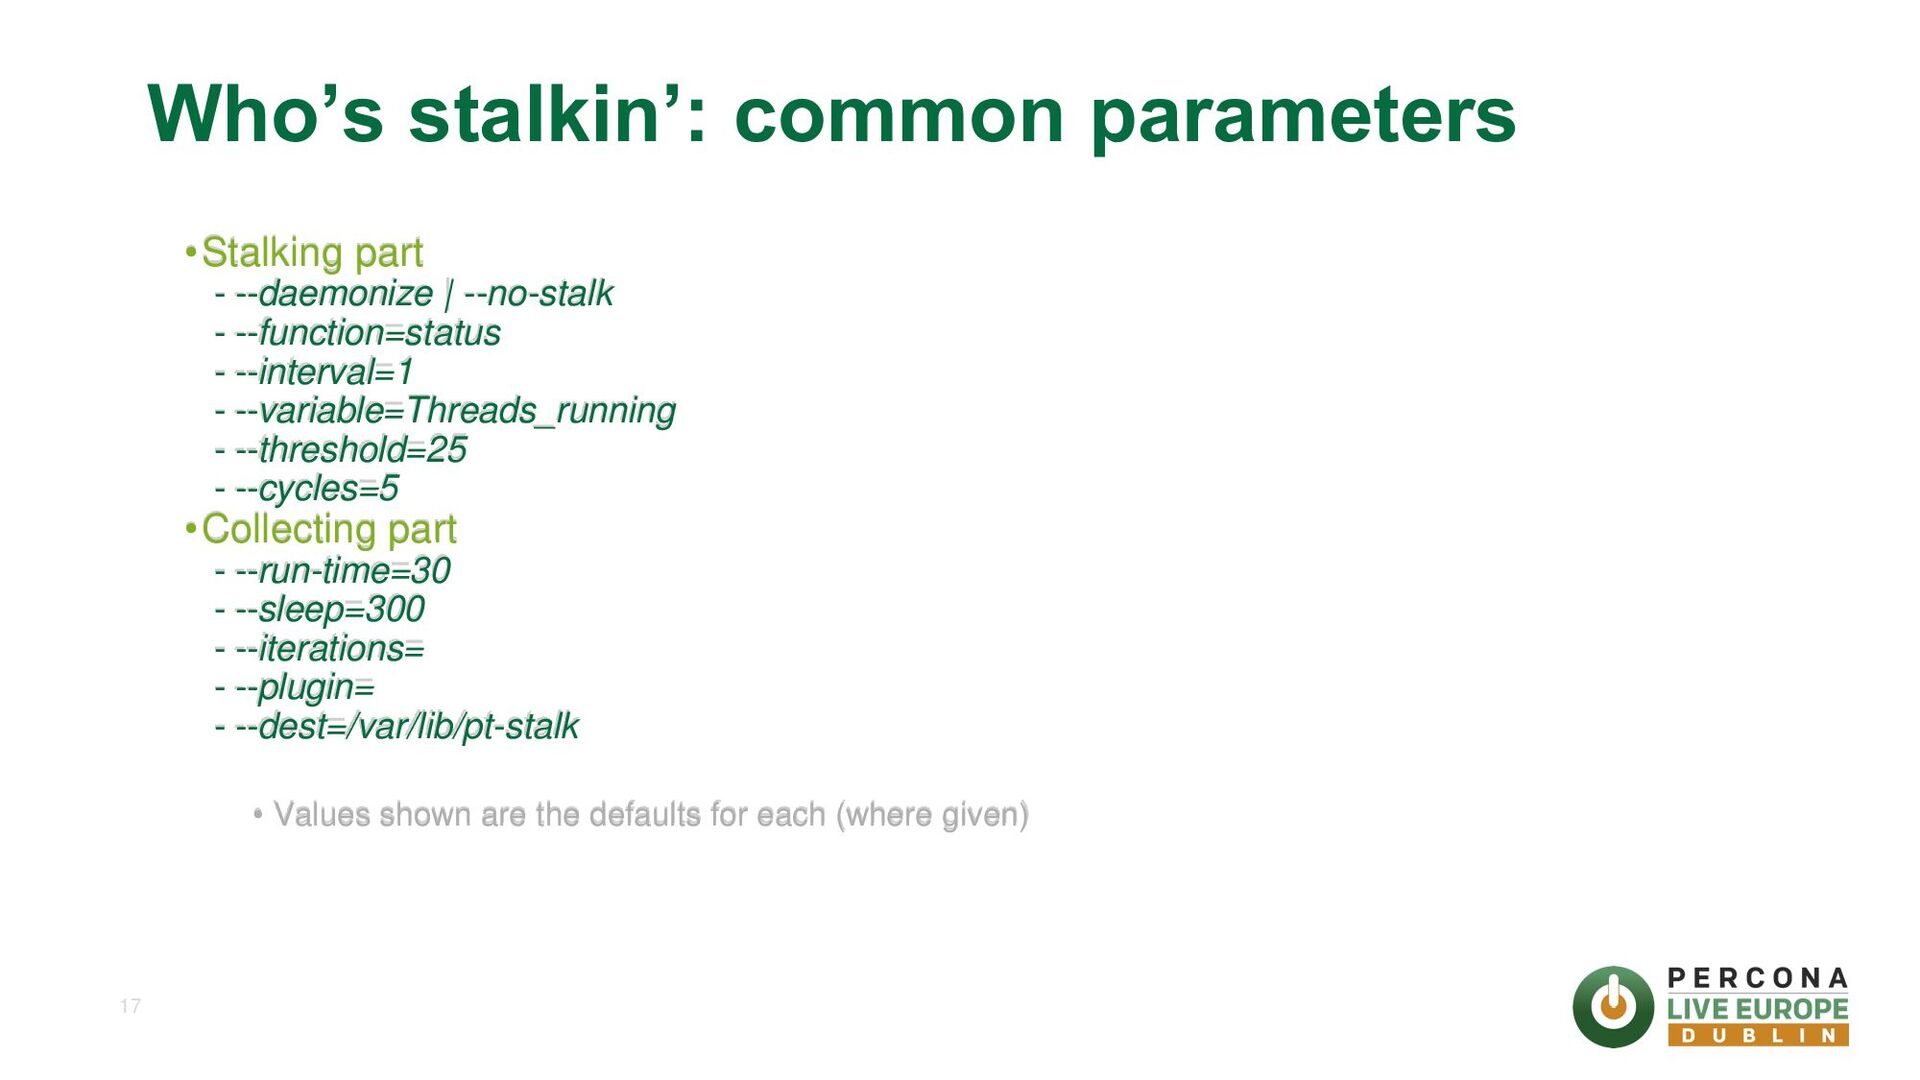
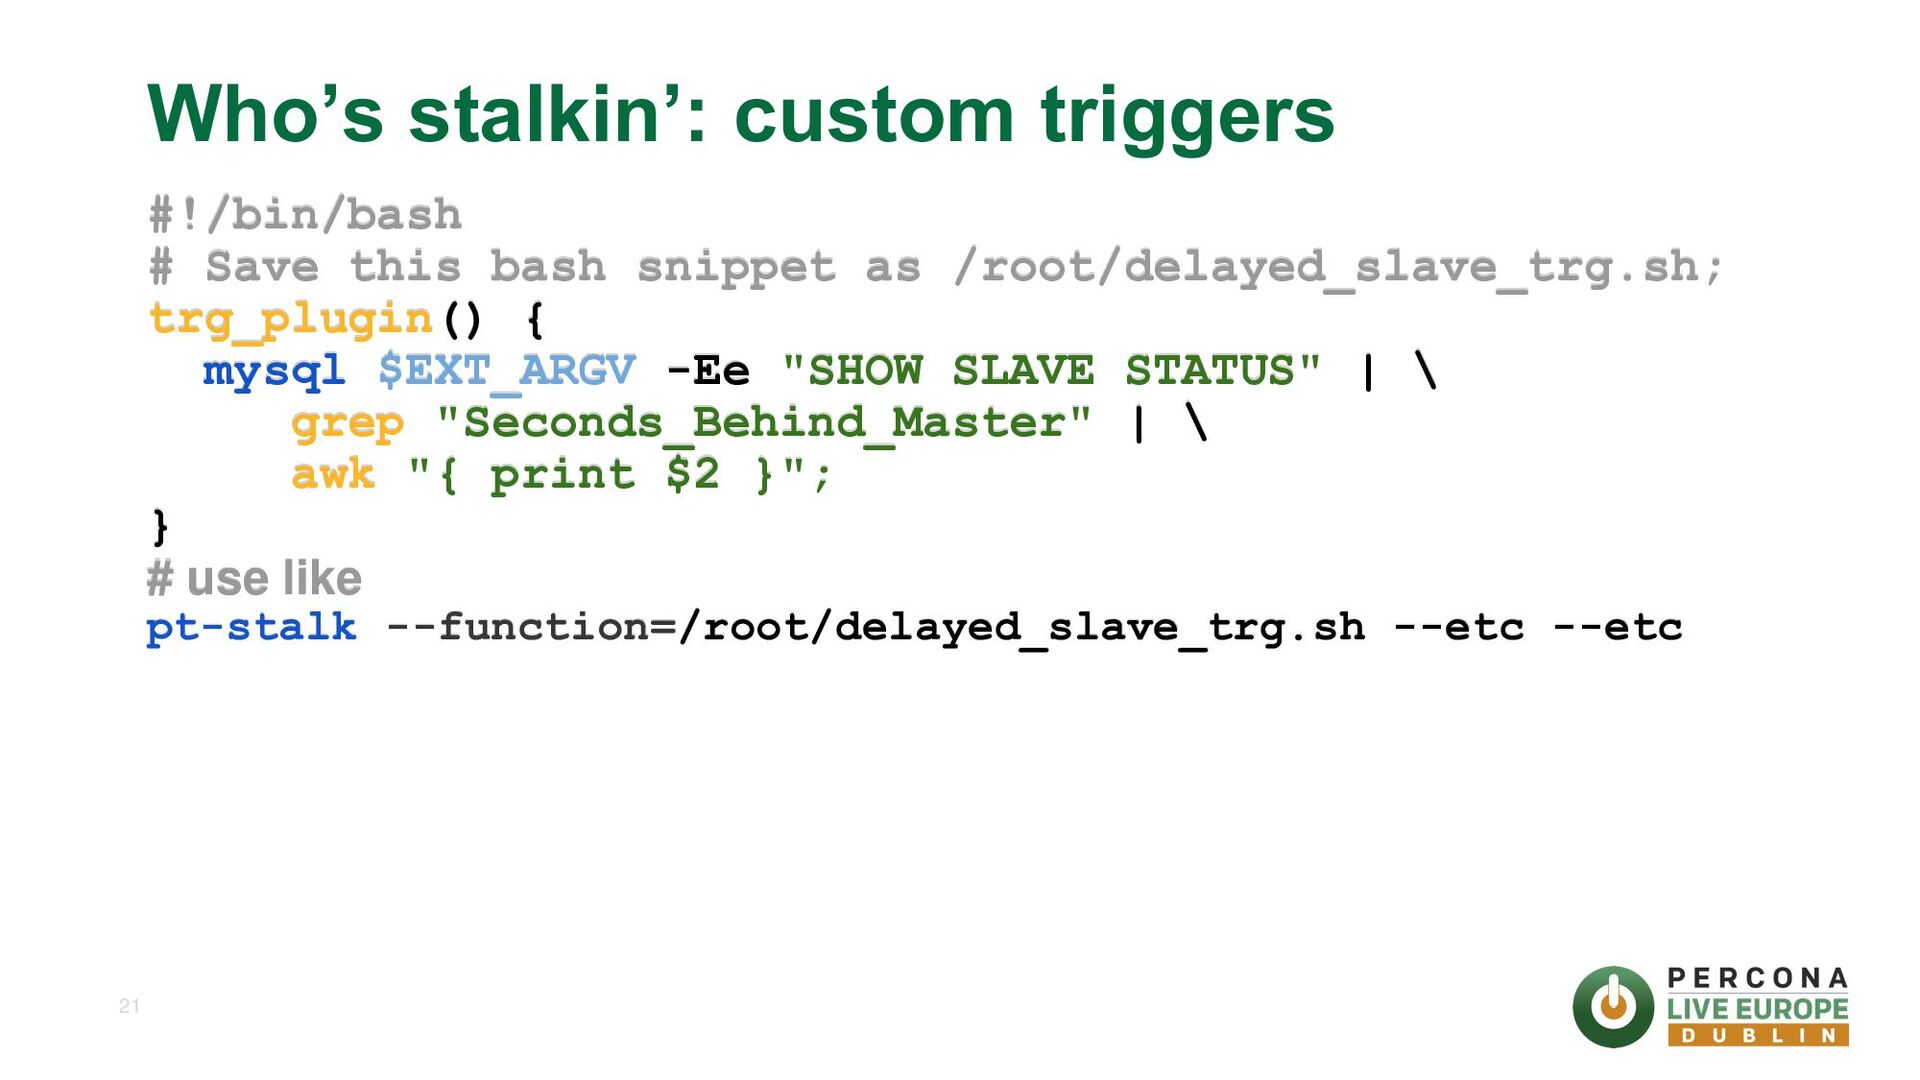
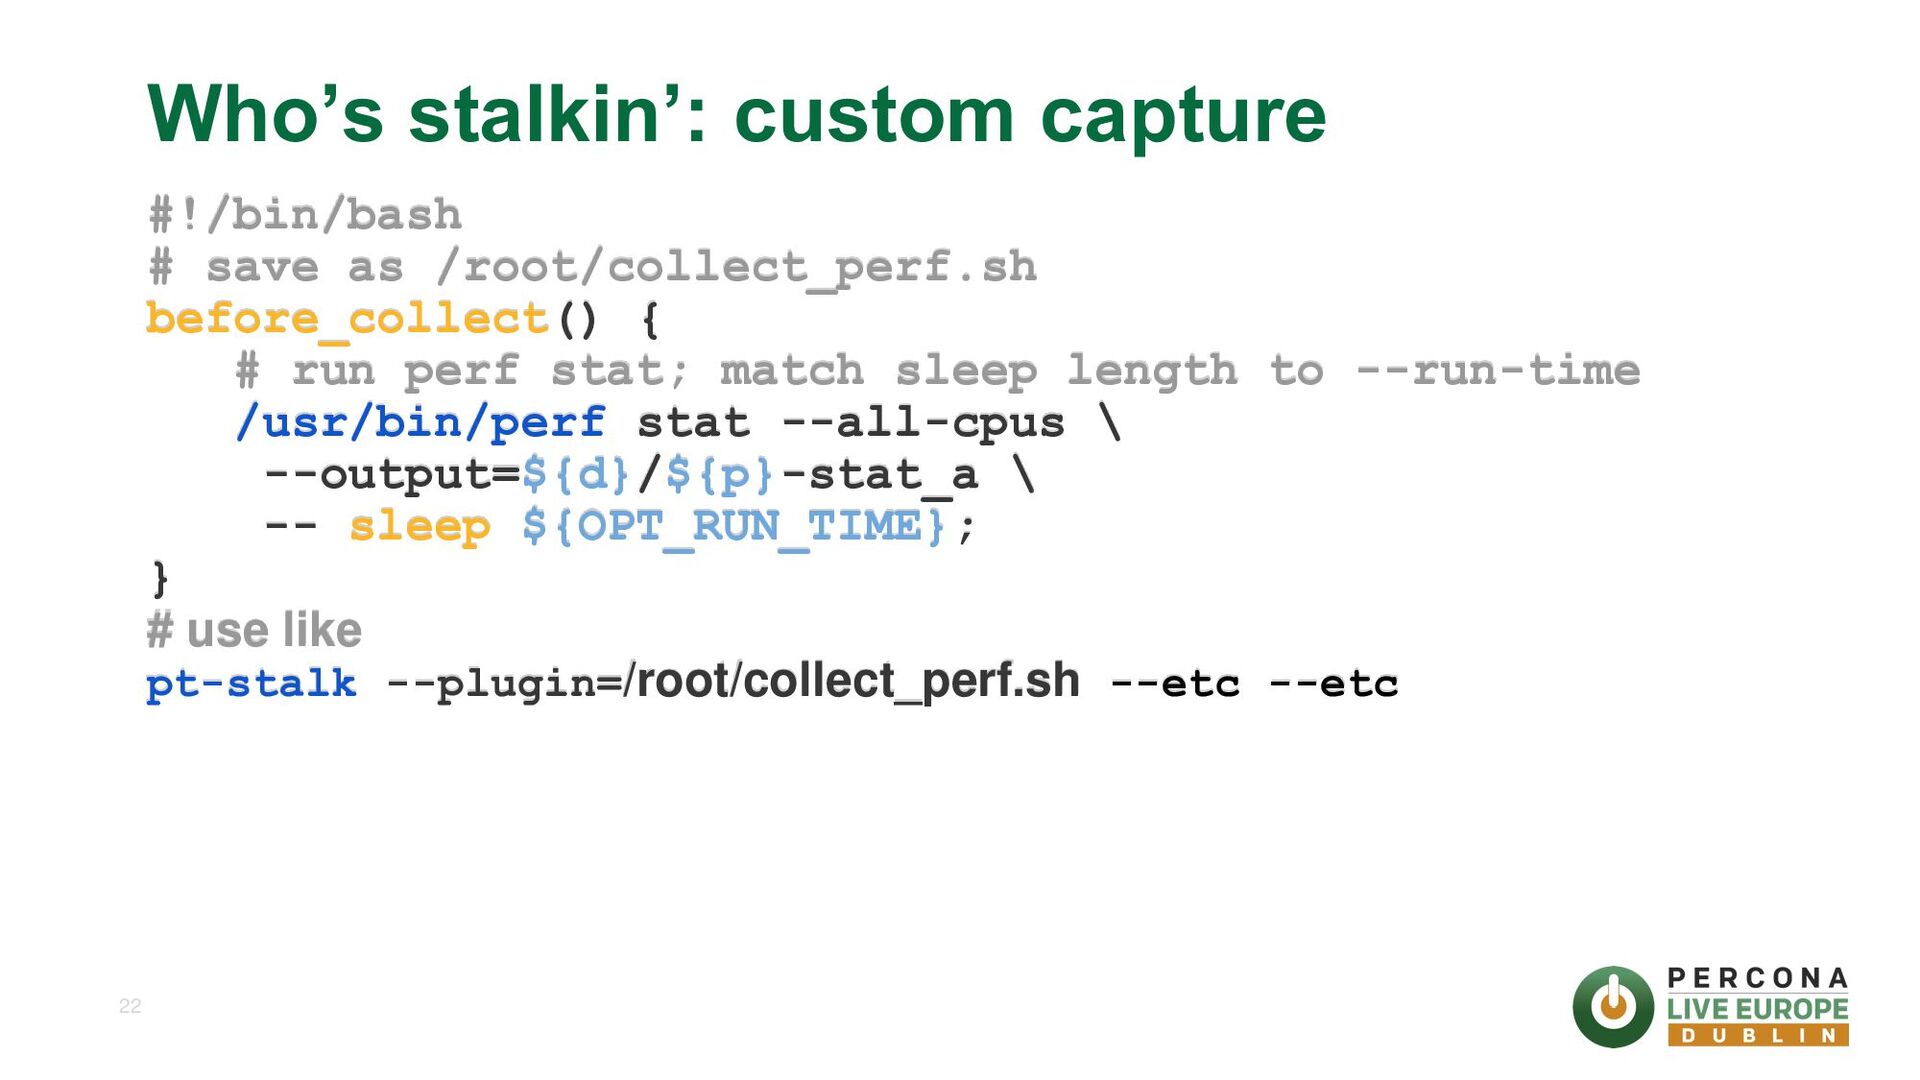
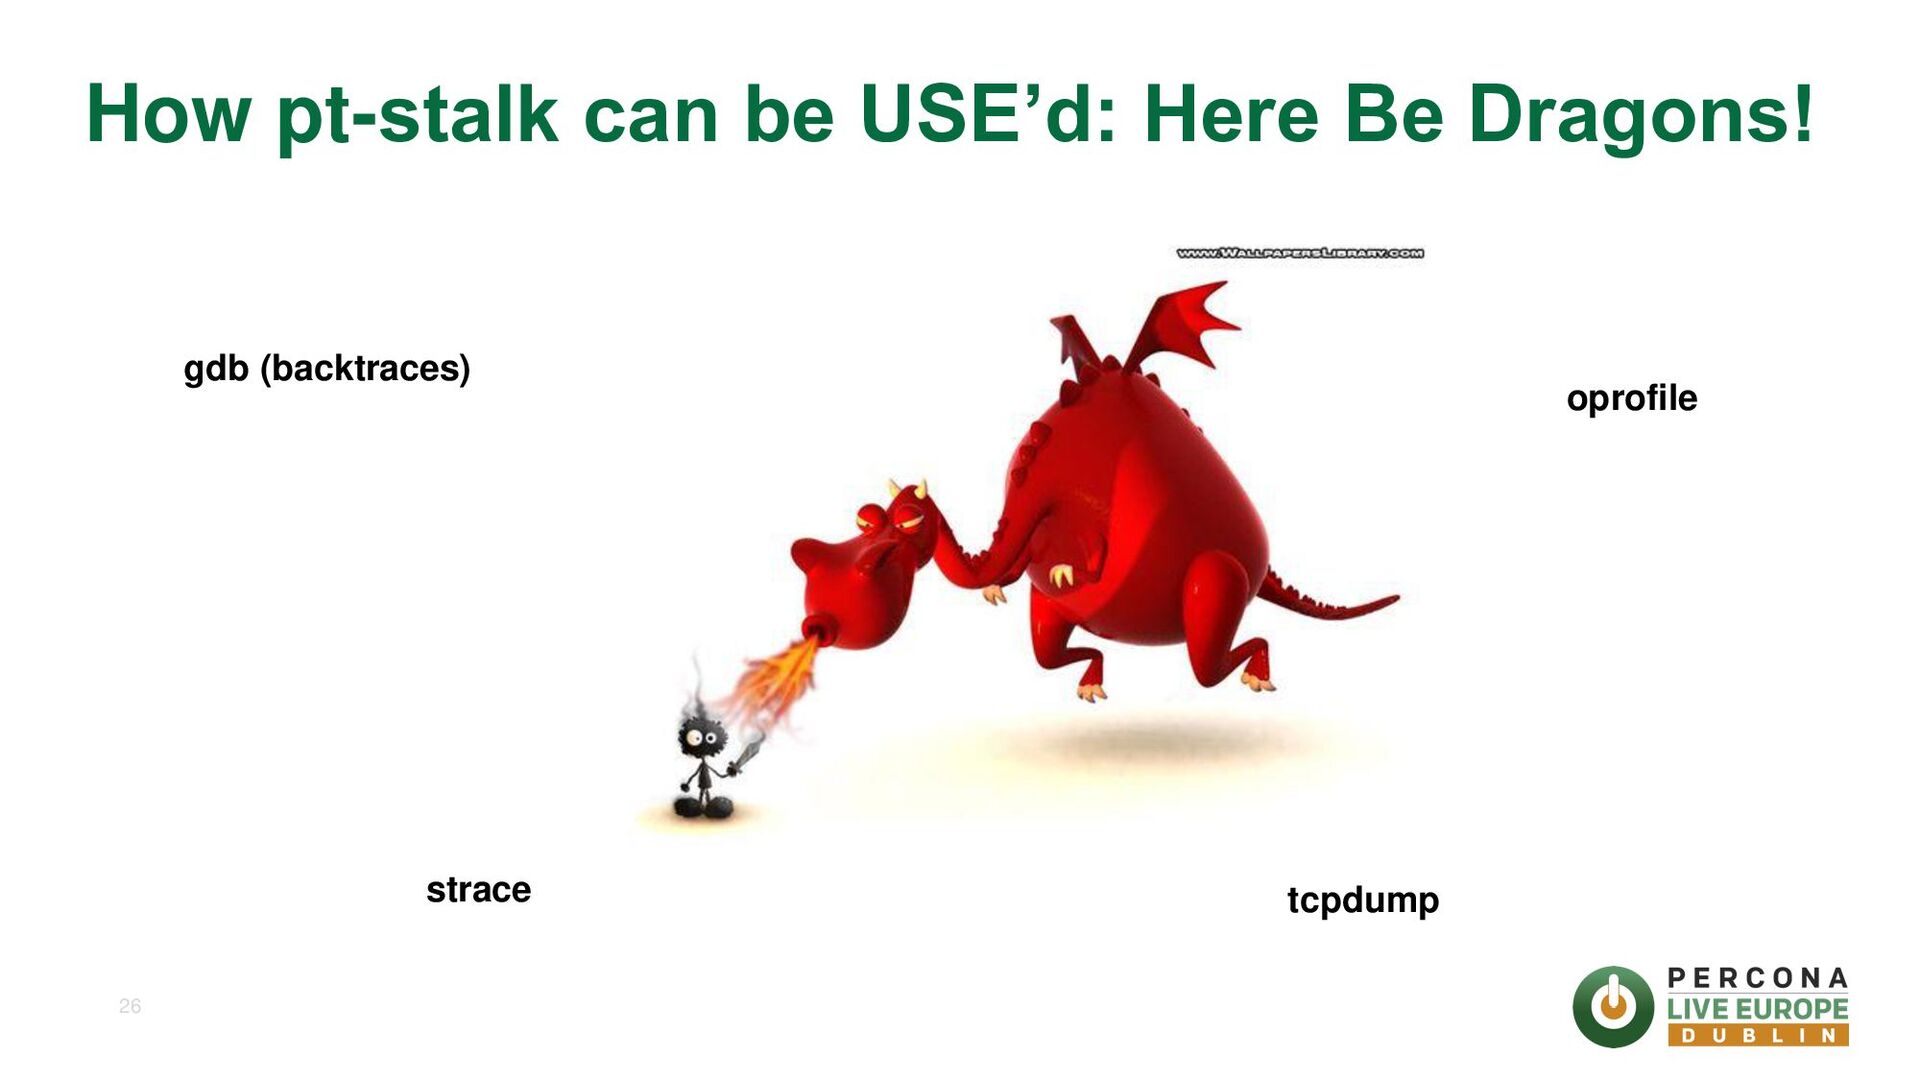
(thanks Daniel & Baron) •# The name 'stalk' is because 'watch' is already taken, and 'stalk' is fun. •Now part of pt-toolkit •Monitors variable or a script’s single-valued output •Triggers capture when set threshold is reached - files from /proc: diskstats, interrupts, meminfo, slabinfo, procstat, procvmstat. - vmstat, iostat, top, netstat, pmap, mpstat, sysctl, df, hostname, mysqladmin ext, mysqladmin debug, lsof). - SHOW ENGINE INNODB STATUS, SHOW ENGINE INNODB MUTEX, SHOW GLOBAL VARIABLES, SHOW FULL PROCESSLIST and SHOW OPEN TABLES. •Production safe! •Custom triggers and custom captures •Companion tools (pt-sift, pt-mext, pt-diskstats, pt-summary); Bash dissection
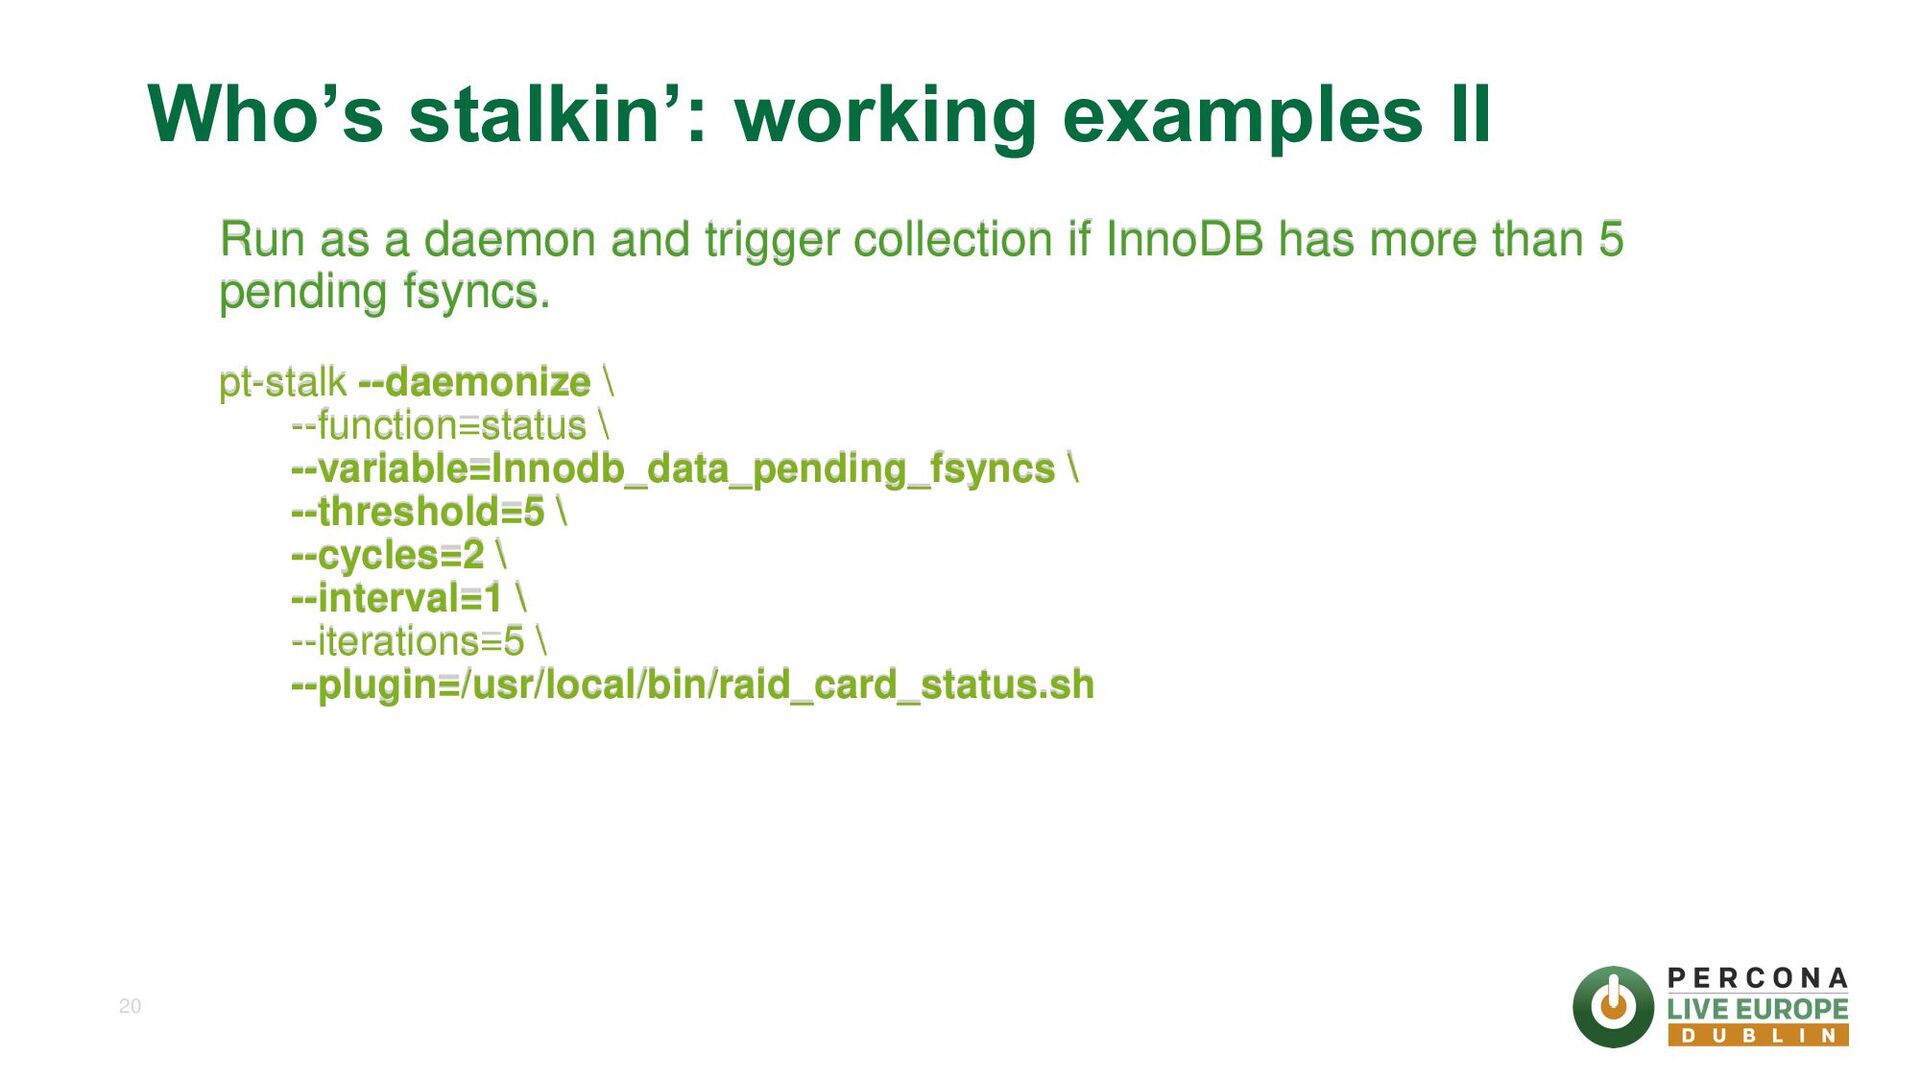
before_collect() { # run perf stat; match sleep length to --run-time /usr/bin/perf stat --all-cpus \ --output=${d}/${p}-stat_a \ -- sleep ${OPT_RUN_TIME}; } # use like pt-stalk --plugin=/root/collect_perf.sh --etc --etc
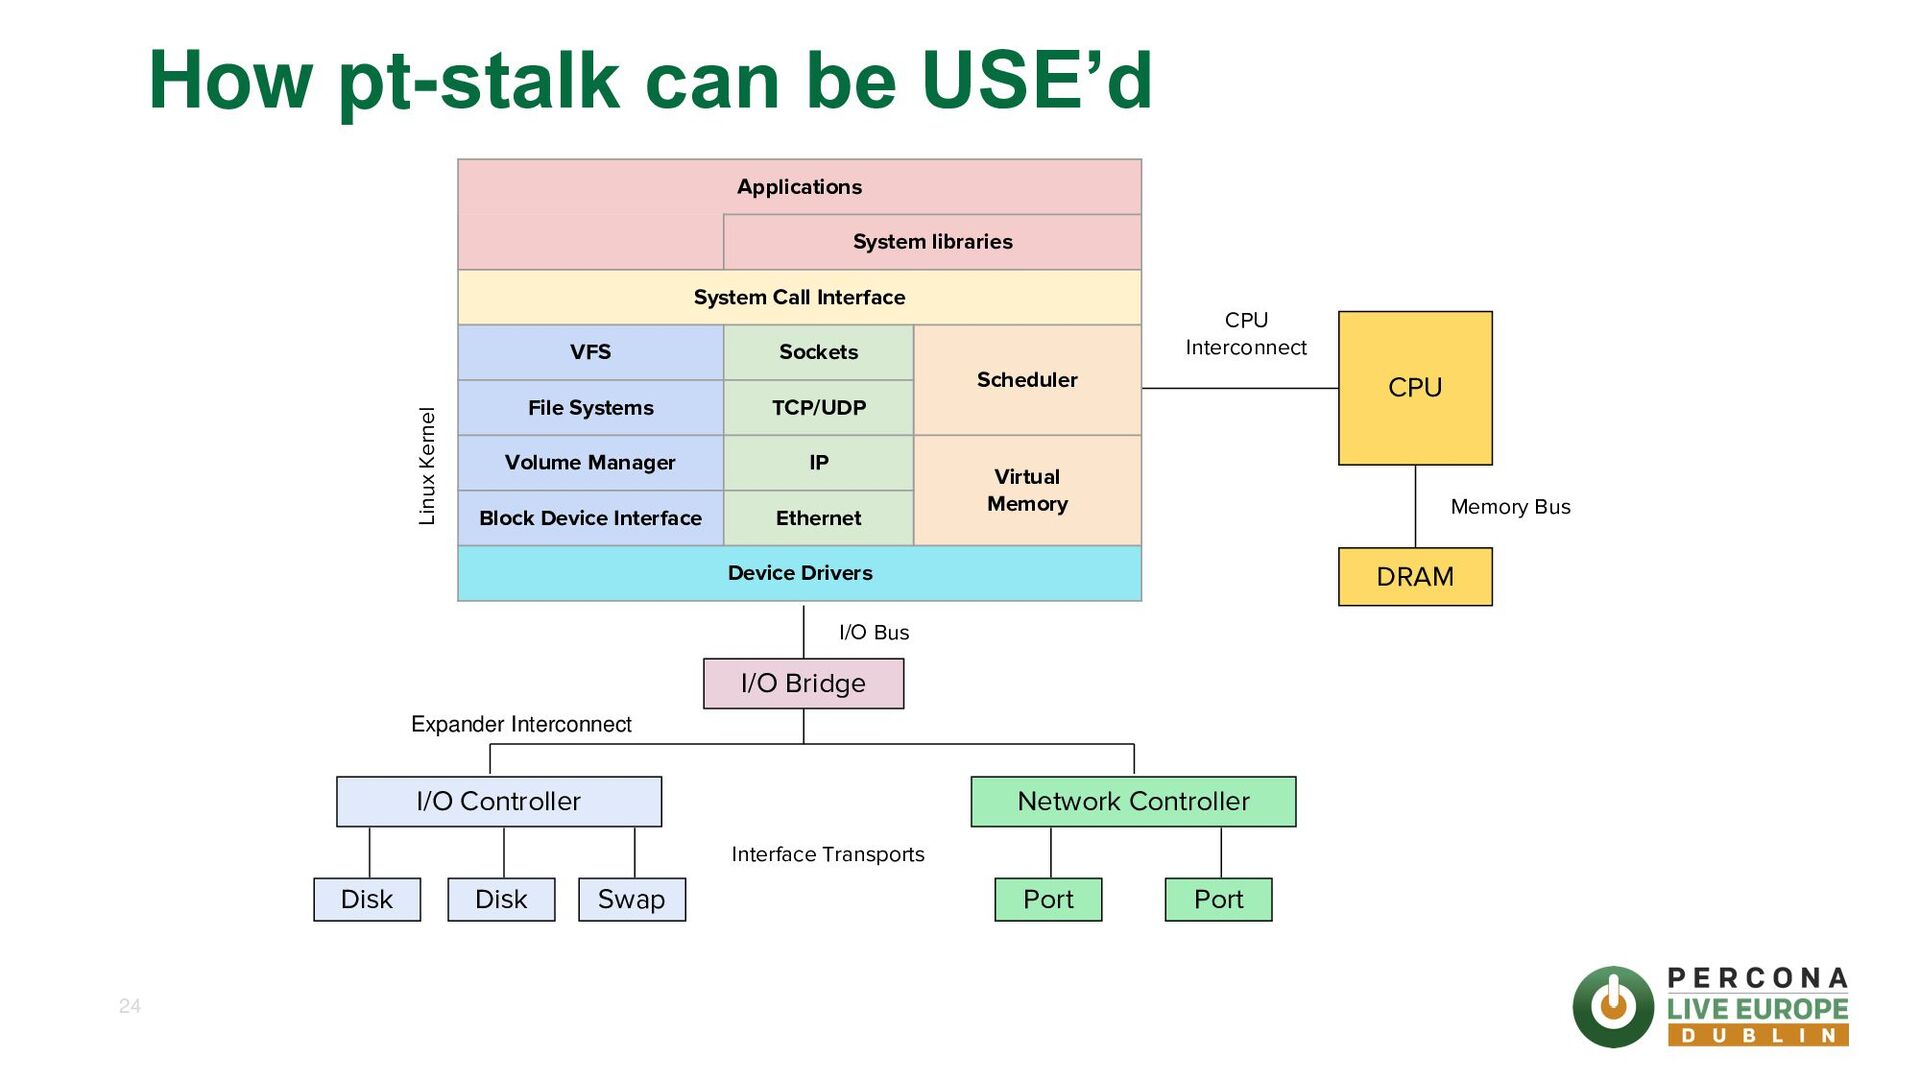
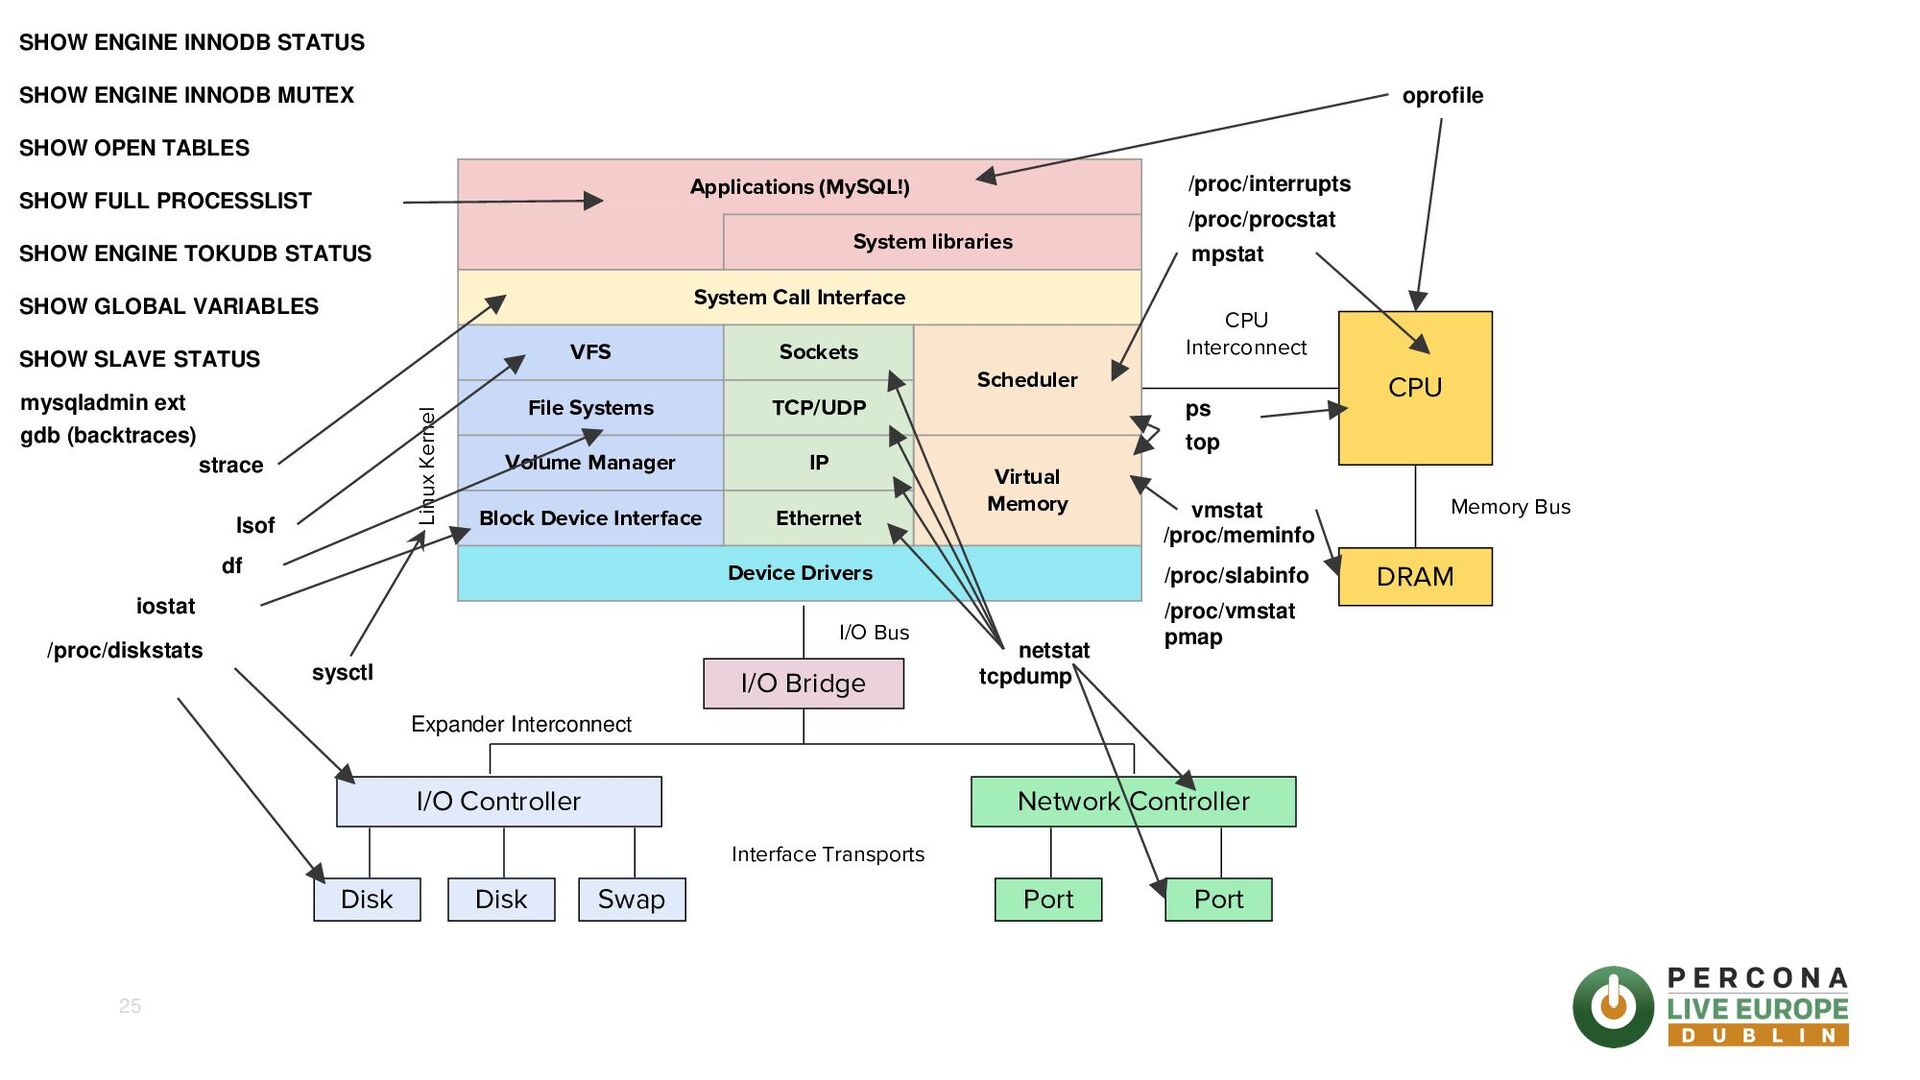
Interconnect DRAM I/O Bridge I/O Controller Network Controller I/O Bus Expander Interconnect Disk Disk Swap Port Port Applications System libraries System Call Interface VFS Sockets Scheduler File Systems TCP/UDP Volume Manager IP Virtual Memory Block Device Interface Ethernet Device Drivers Memory Bus Interface Transports
Controller Network Controller I/O Bus Expander Interconnect Disk Disk Swap Port Port Applications (MySQL!) System libraries System Call Interface VFS Sockets Scheduler File Systems TCP/UDP Volume Manager IP Virtual Memory Block Device Interface Ethernet Device Drivers Memory Bus Interface Transports ps df /proc/diskstats SHOW ENGINE INNODB STATUS /proc/interrupts iostat lsof /proc/meminfo mpstat SHOW ENGINE INNODB MUTEX mysqladmin ext SHOW OPEN TABLES pmap /proc/procstat SHOW FULL PROCESSLIST /proc/vmstat /proc/slabinfo sysctl SHOW ENGINE TOKUDB STATUS top SHOW GLOBAL VARIABLES vmstat SHOW SLAVE STATUS netstat strace tcpdump gdb (backtraces) oprofile
![Questions ? Marcos Albe [email protected] Marcelo Altmann @altmannmarcelo [email protected]](https://files.speakerdeck.com/presentations/c2229b4569e249fdaabbbd6dcd8c96b4/slide_29.jpg)