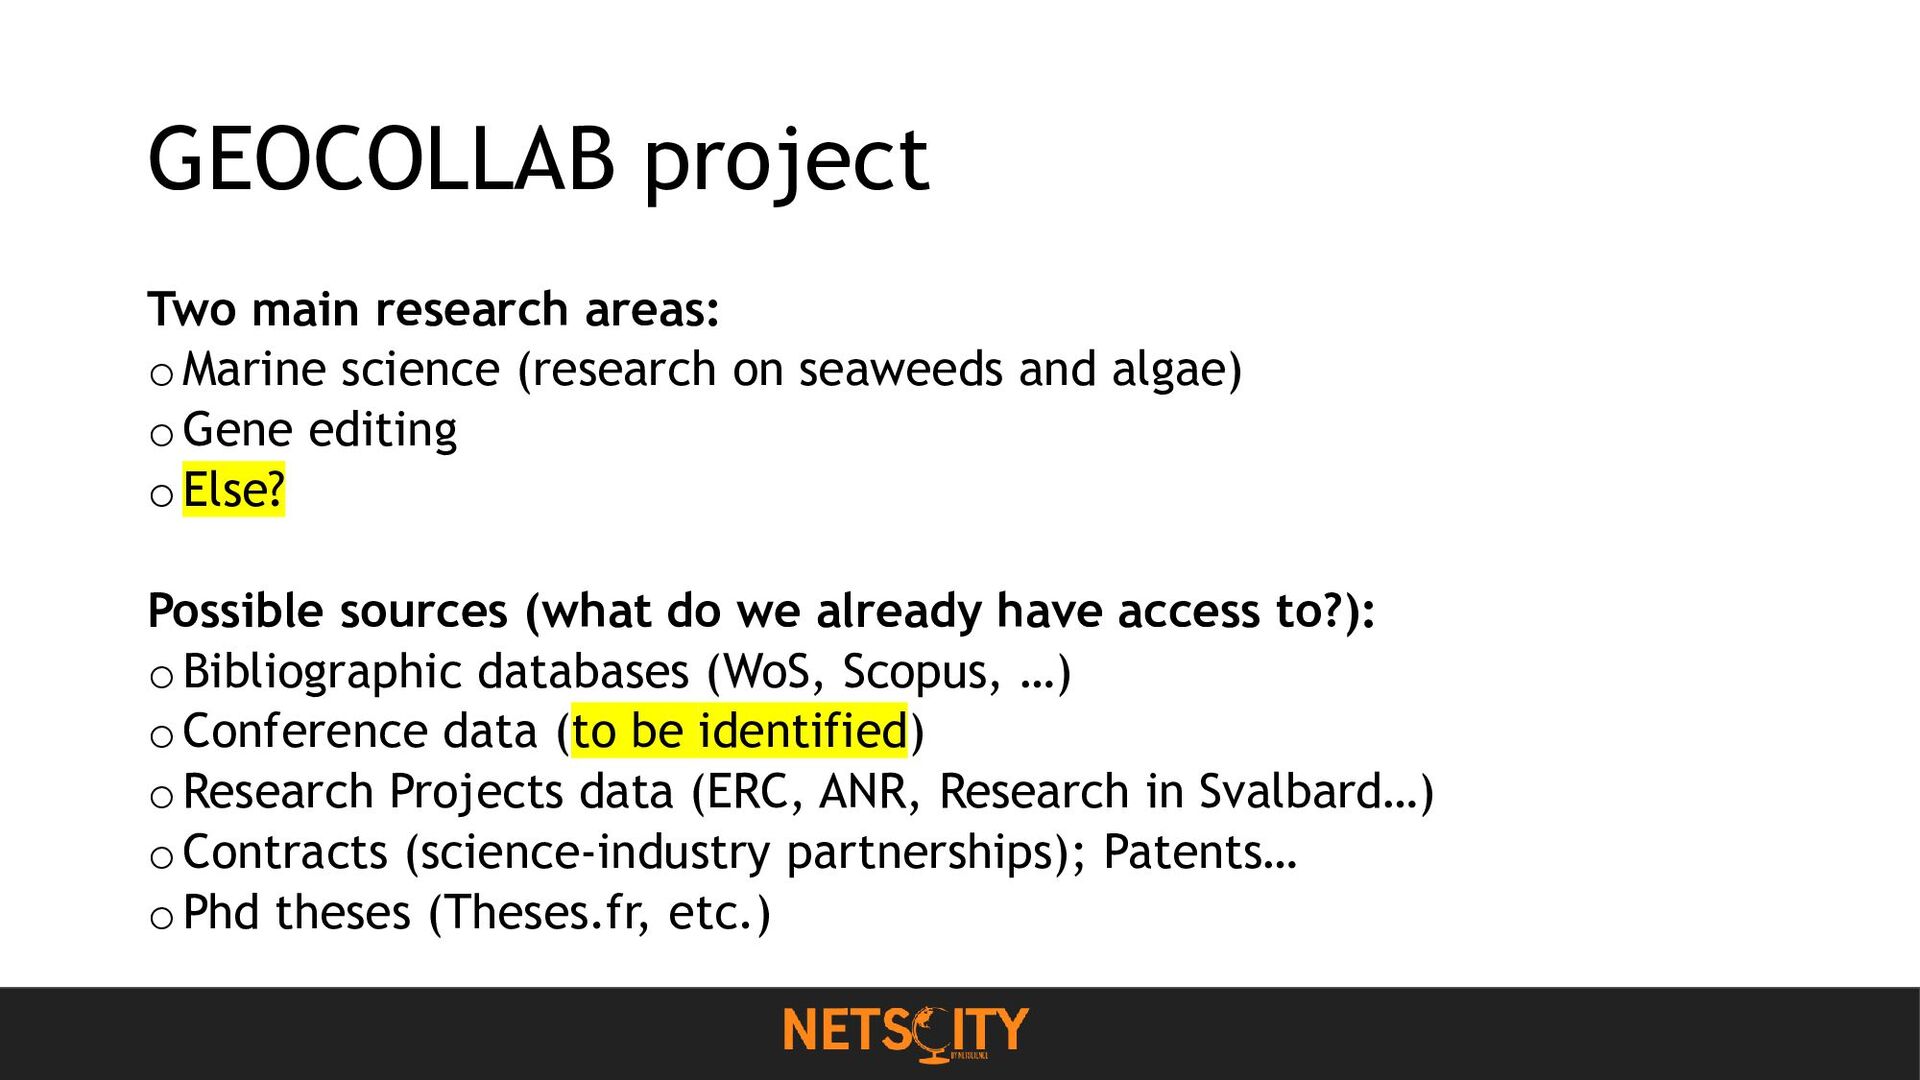
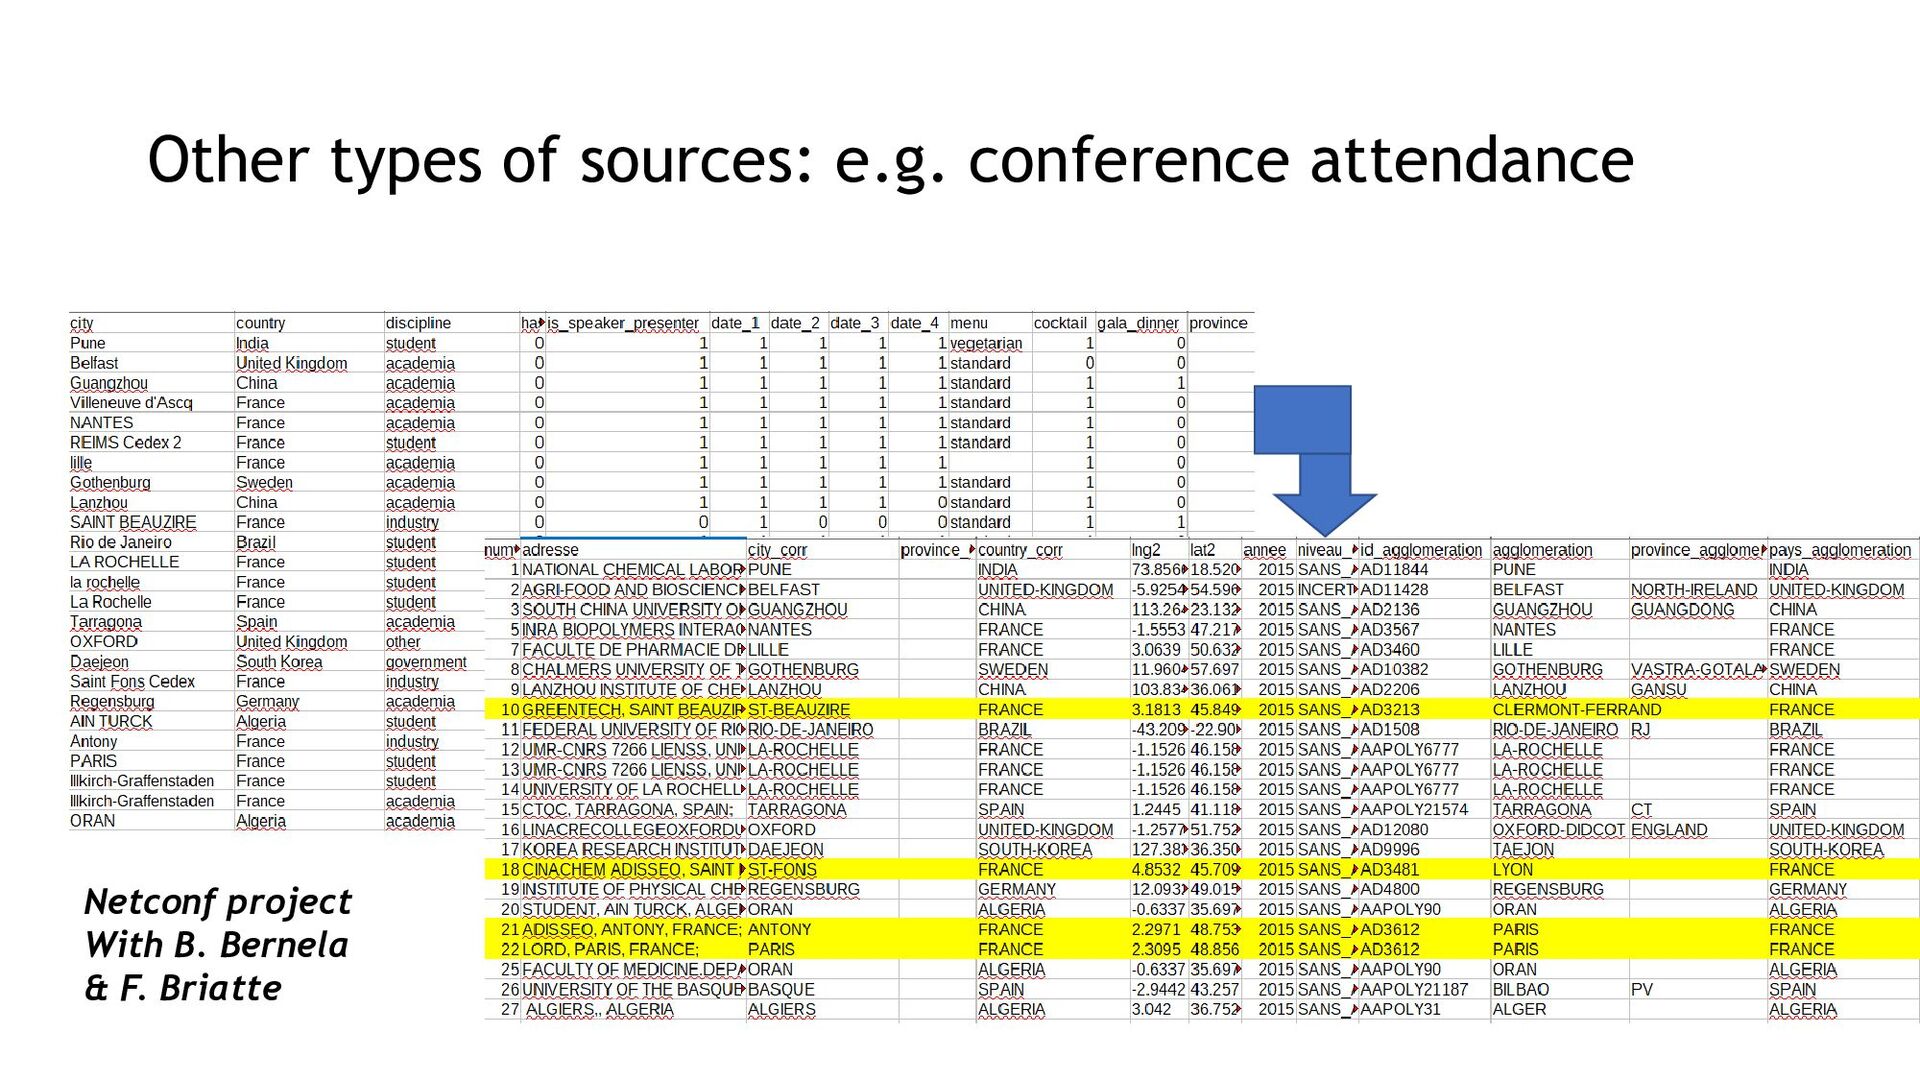
seaweeds and algae) o Gene editing o Else? Possible sources (what do we already have access to?): o Bibliographic databases (WoS, Scopus, …) o Conference data (to be identified) oResearch Projects data (ERC, ANR, Research in Svalbard…) o Contracts (science-industry partnerships); Patents… o Phd theses (Theses.fr, etc.)
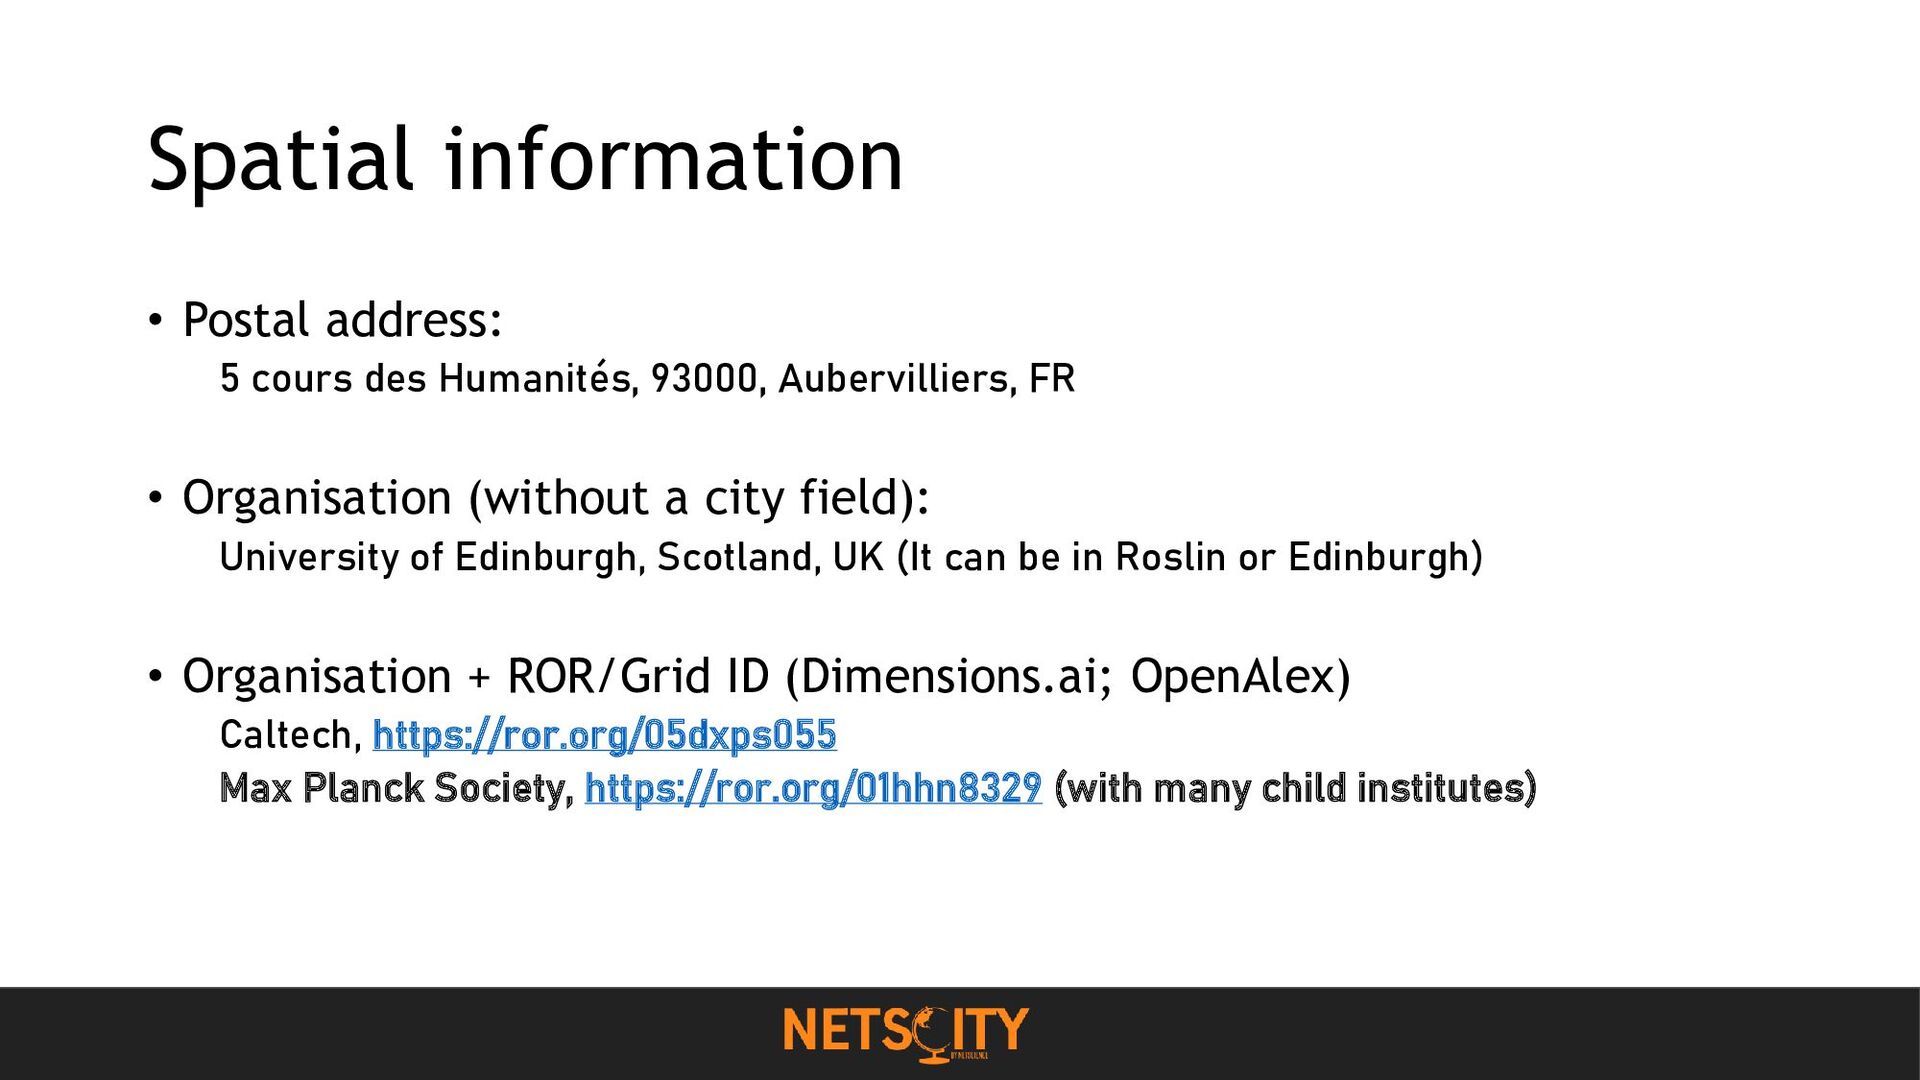
Aubervilliers, FR • Organisation (without a city field): University of Edinburgh, Scotland, UK (It can be in Roslin or Edinburgh) • Organisation + ROR/Grid ID (Dimensions.ai; OpenAlex) Caltech, https://ror.org/05dxps055 Max Planck Society, https://ror.org/01hhn8329 (with many child institutes)
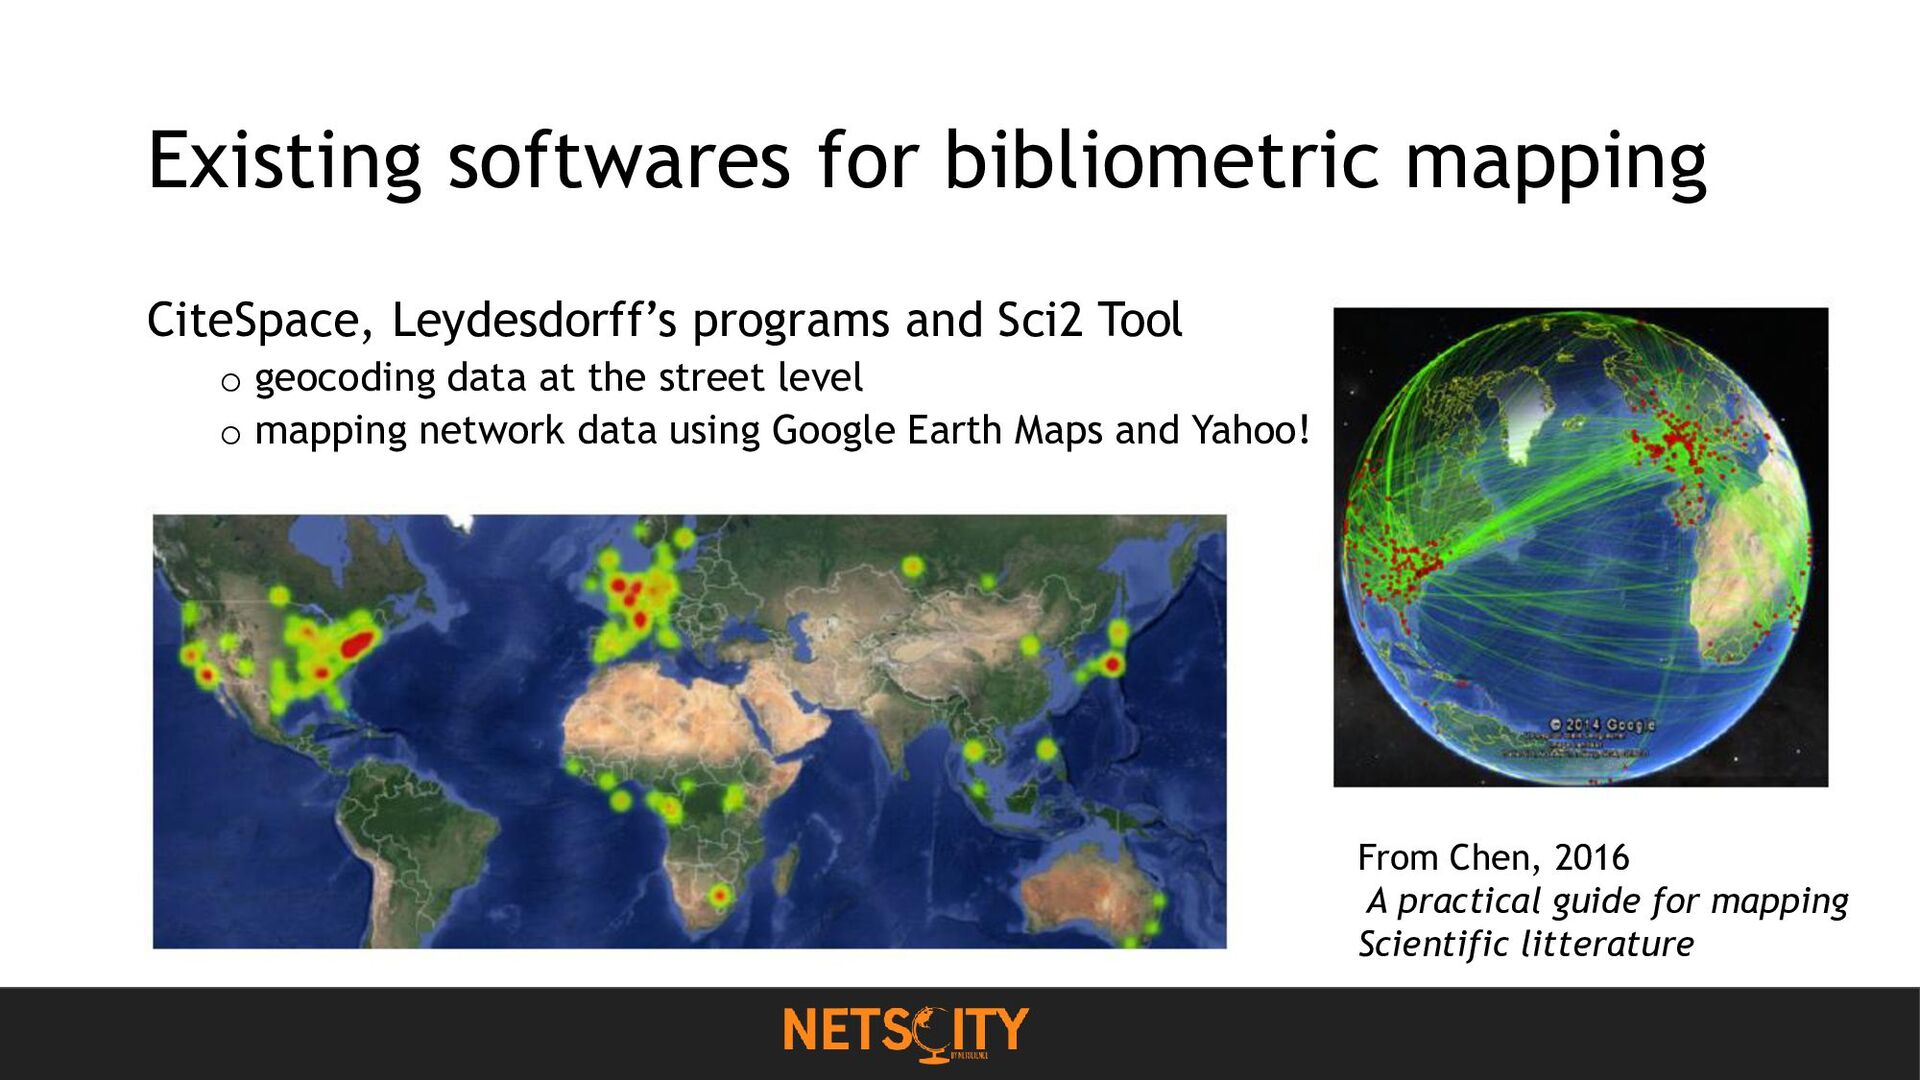
Tool o geocoding data at the street level o mapping network data using Google Earth Maps and Yahoo! Maps using KML files From Chen, 2016 A practical guide for mapping Scientific litterature
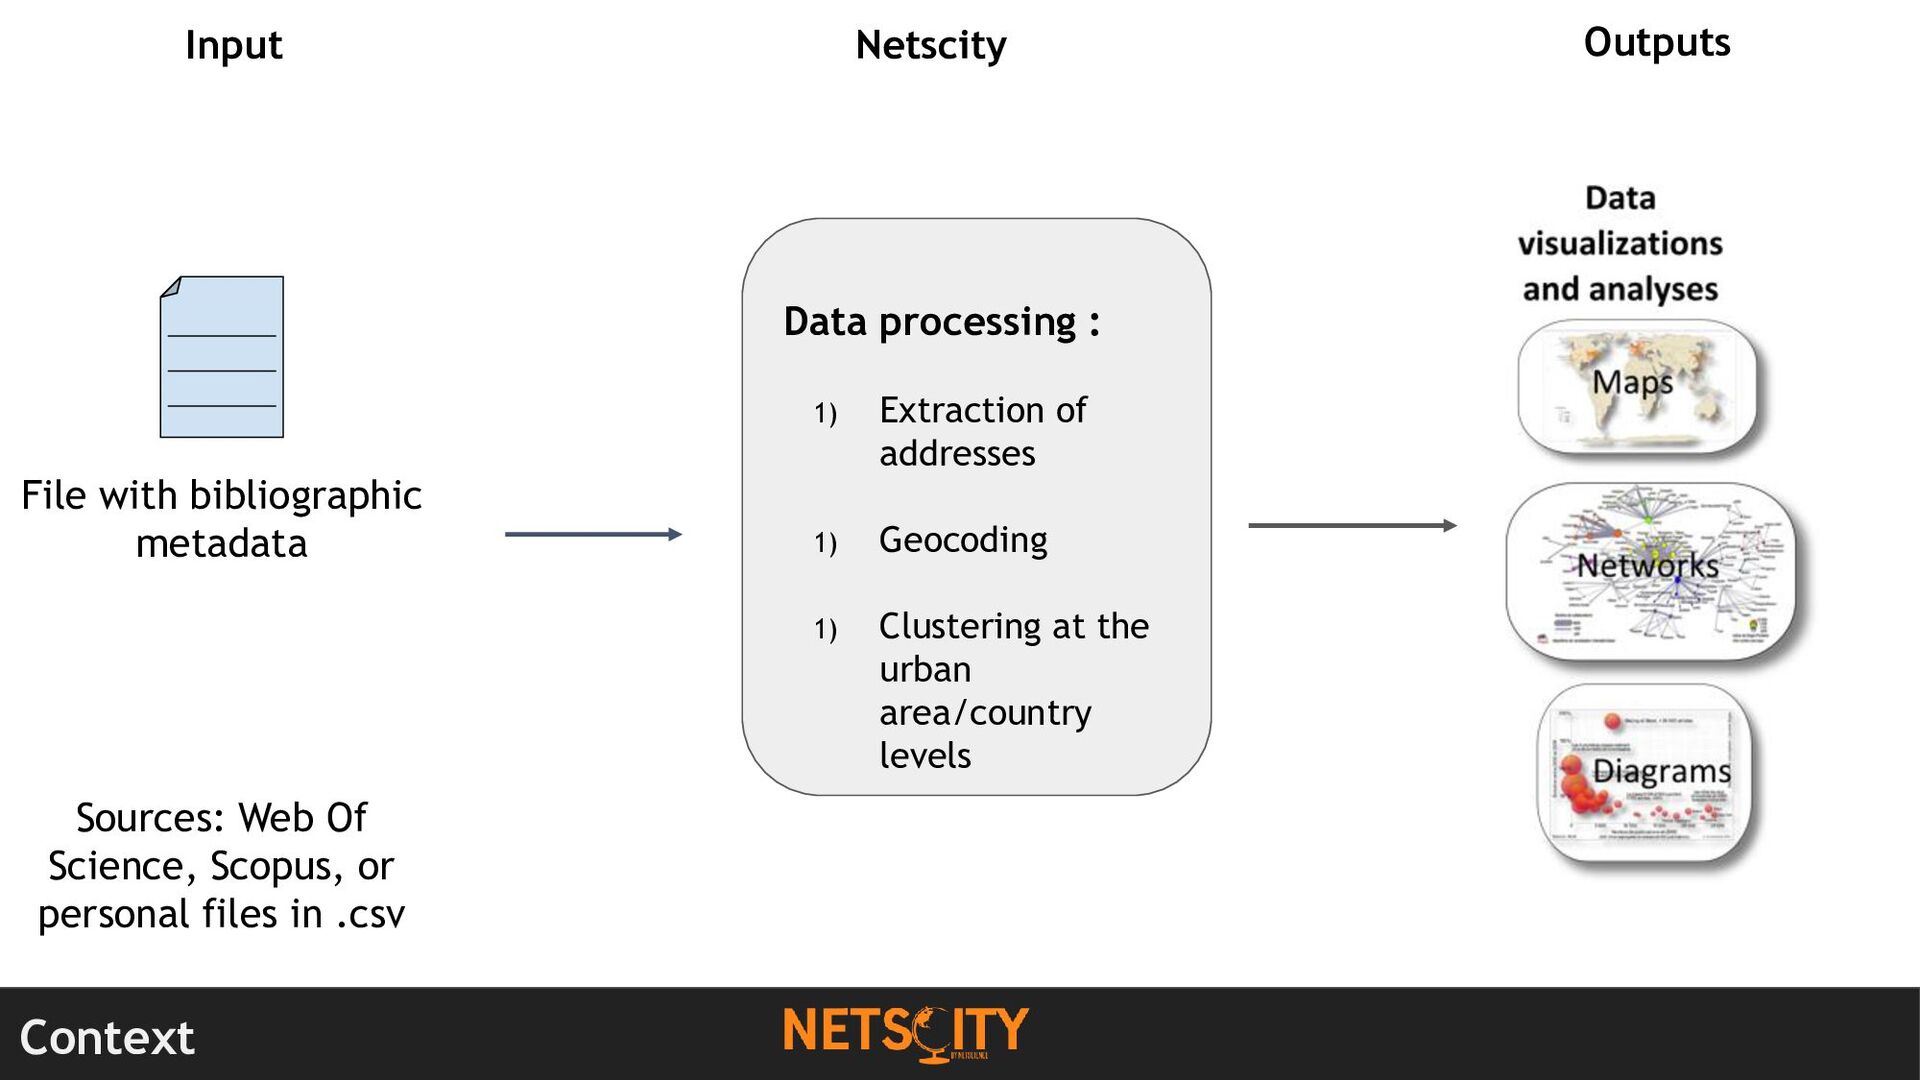
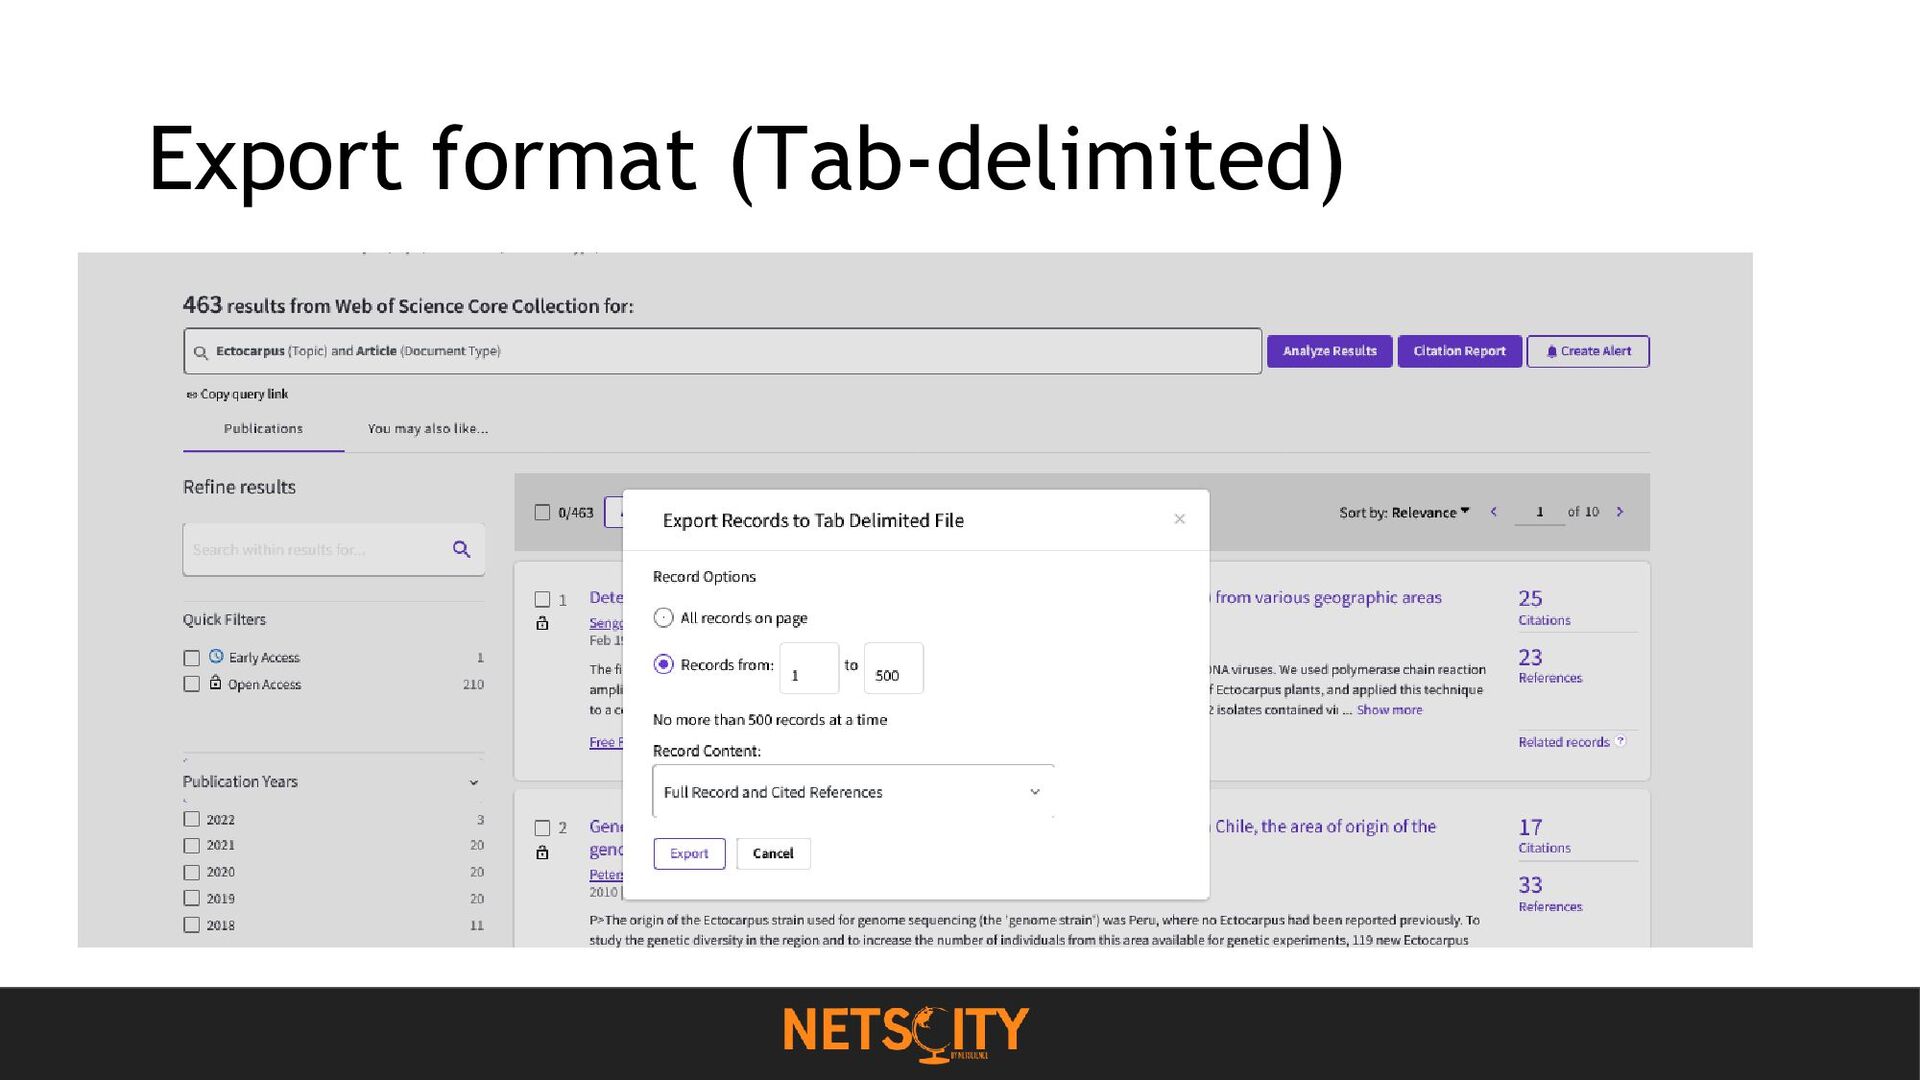
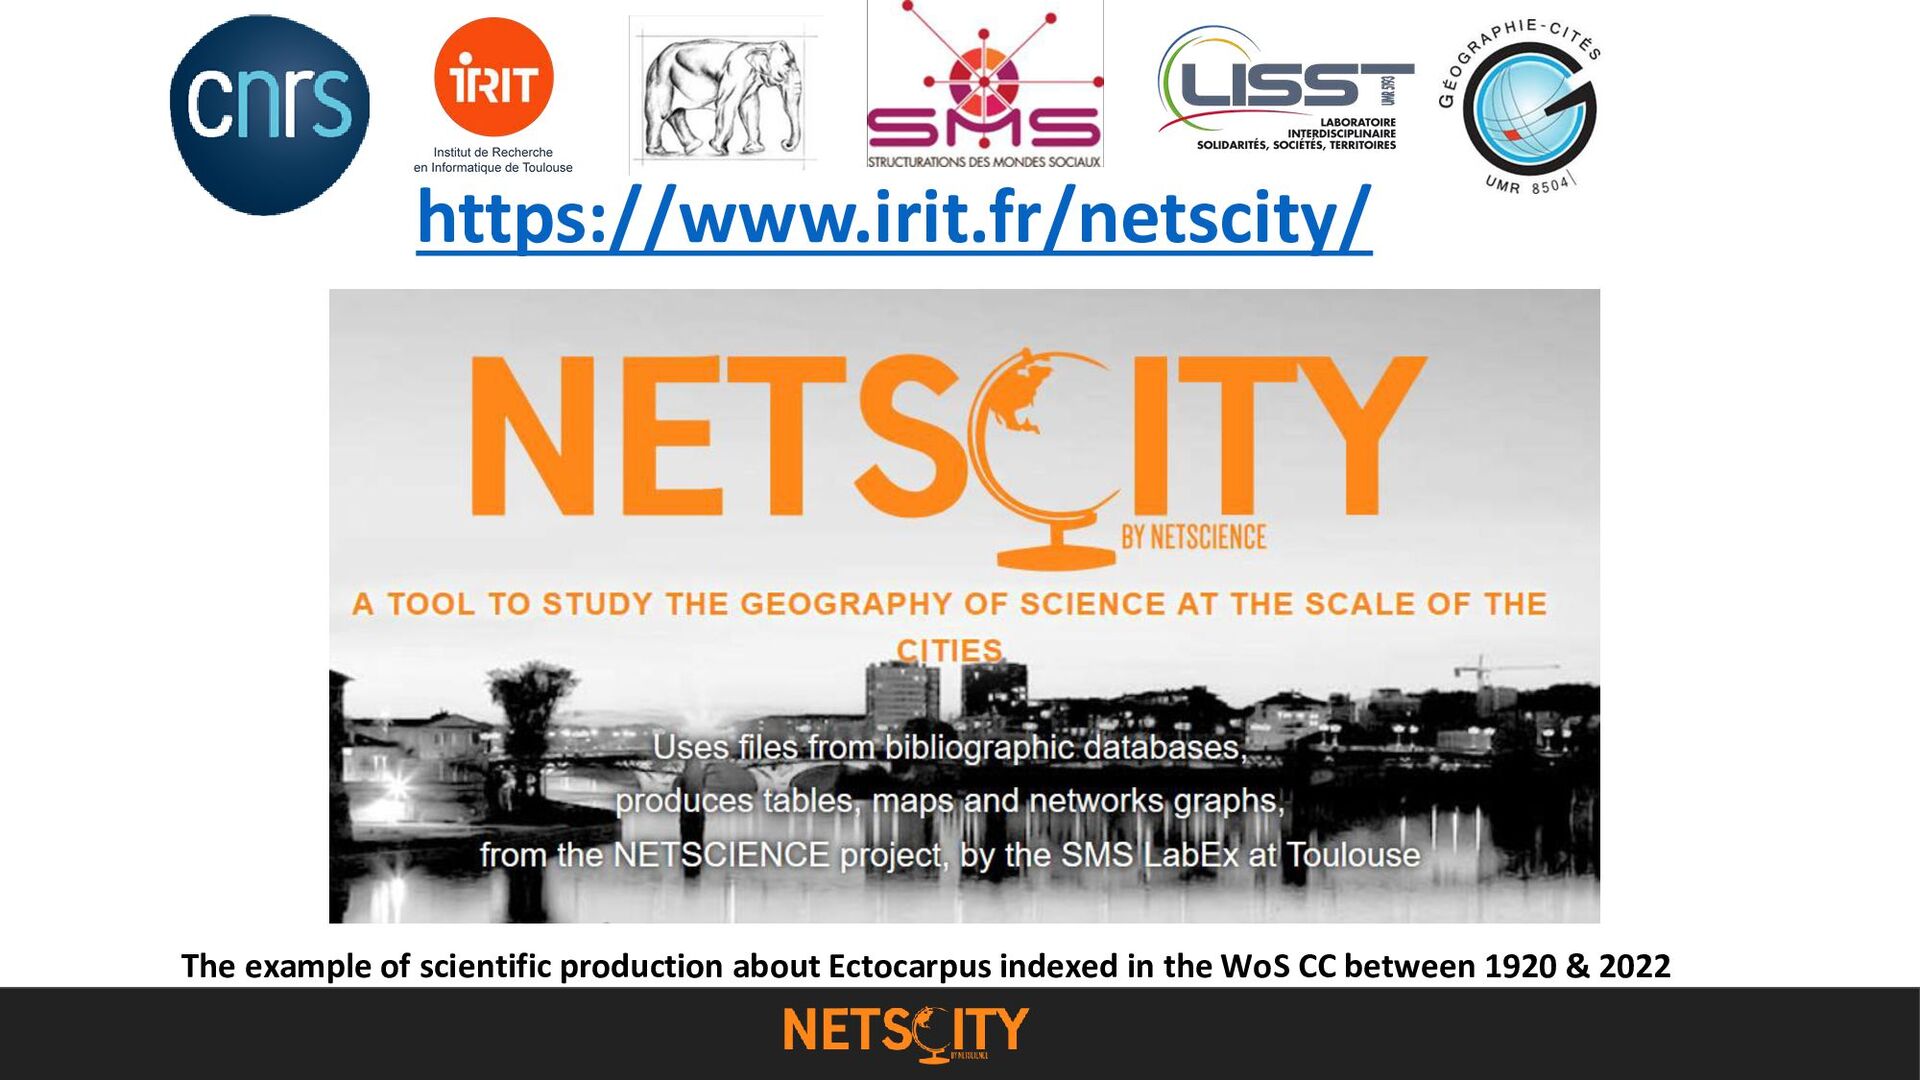
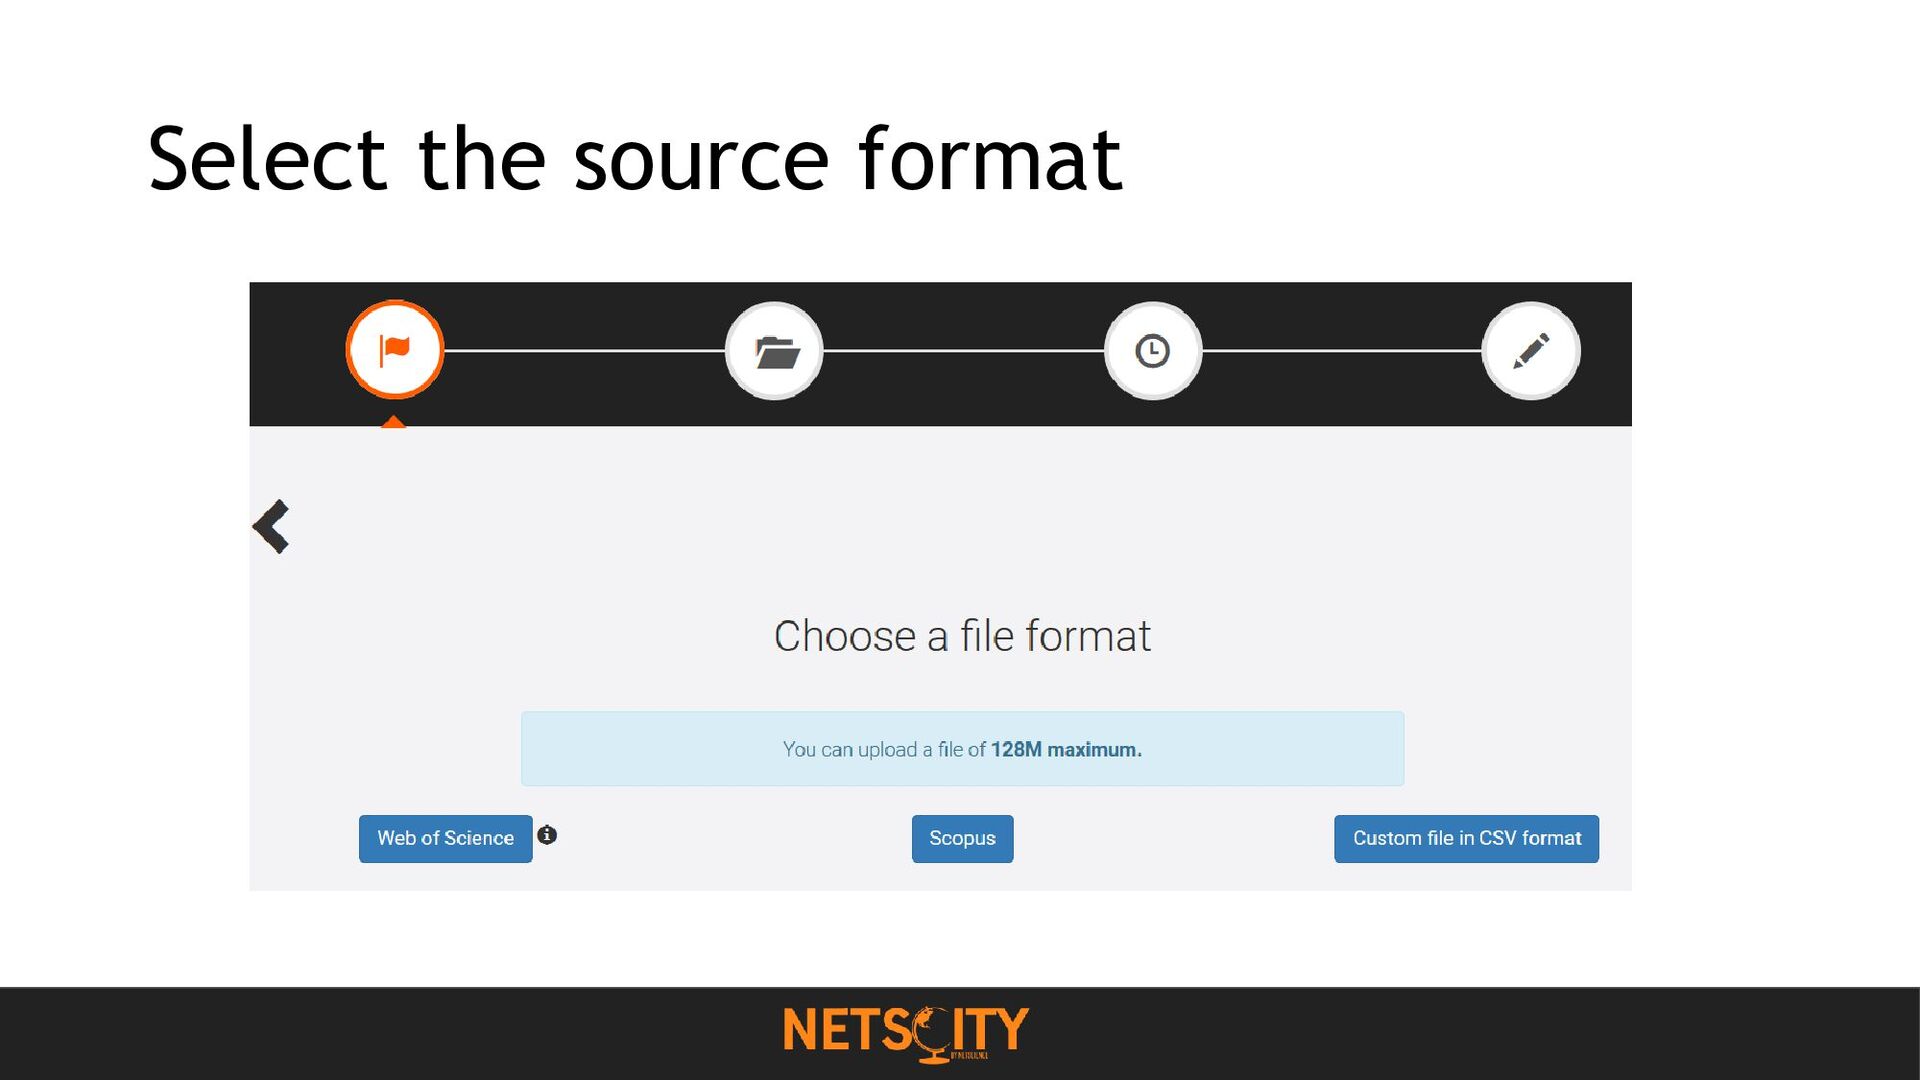
Clustering at the urban area/country levels File with bibliographic metadata Sources: Web Of Science, Scopus, or personal files in .csv Input Netscity Outputs • Cartes • Tables • Fichier d’export Context
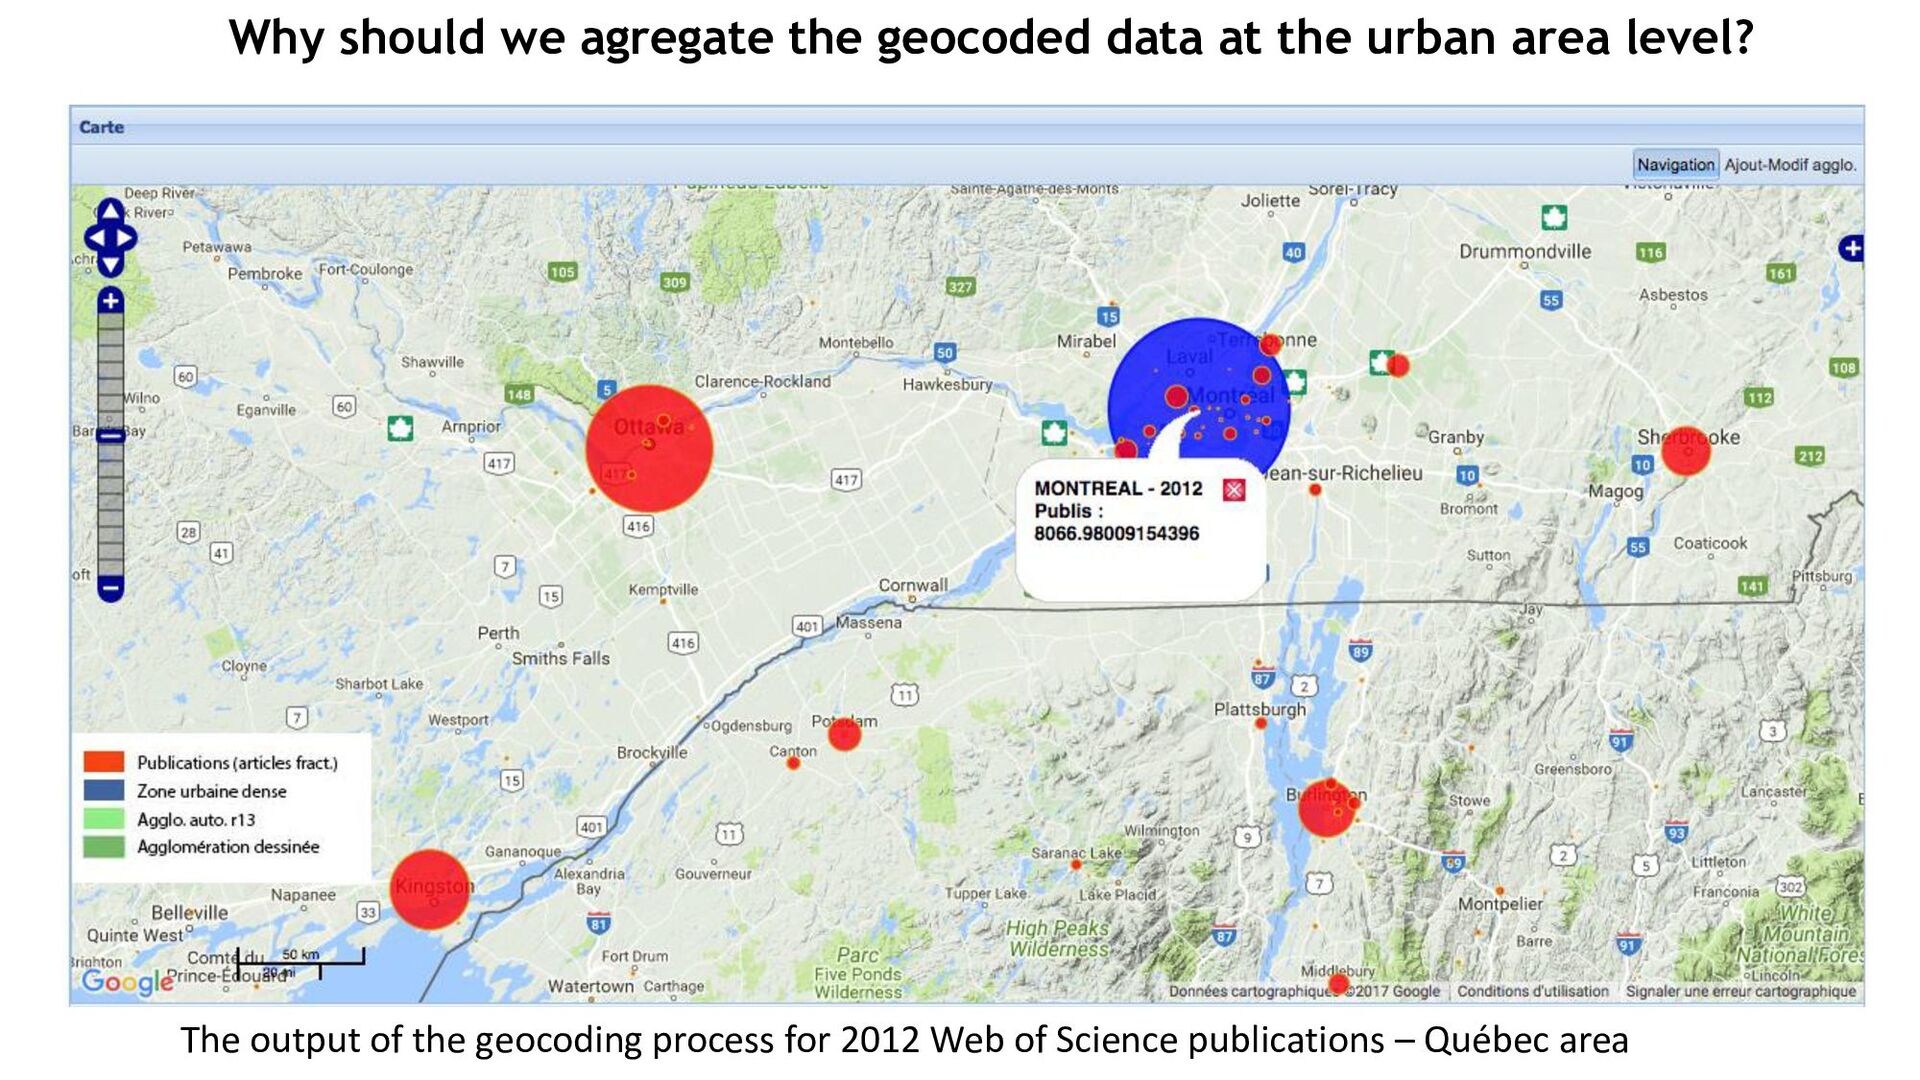
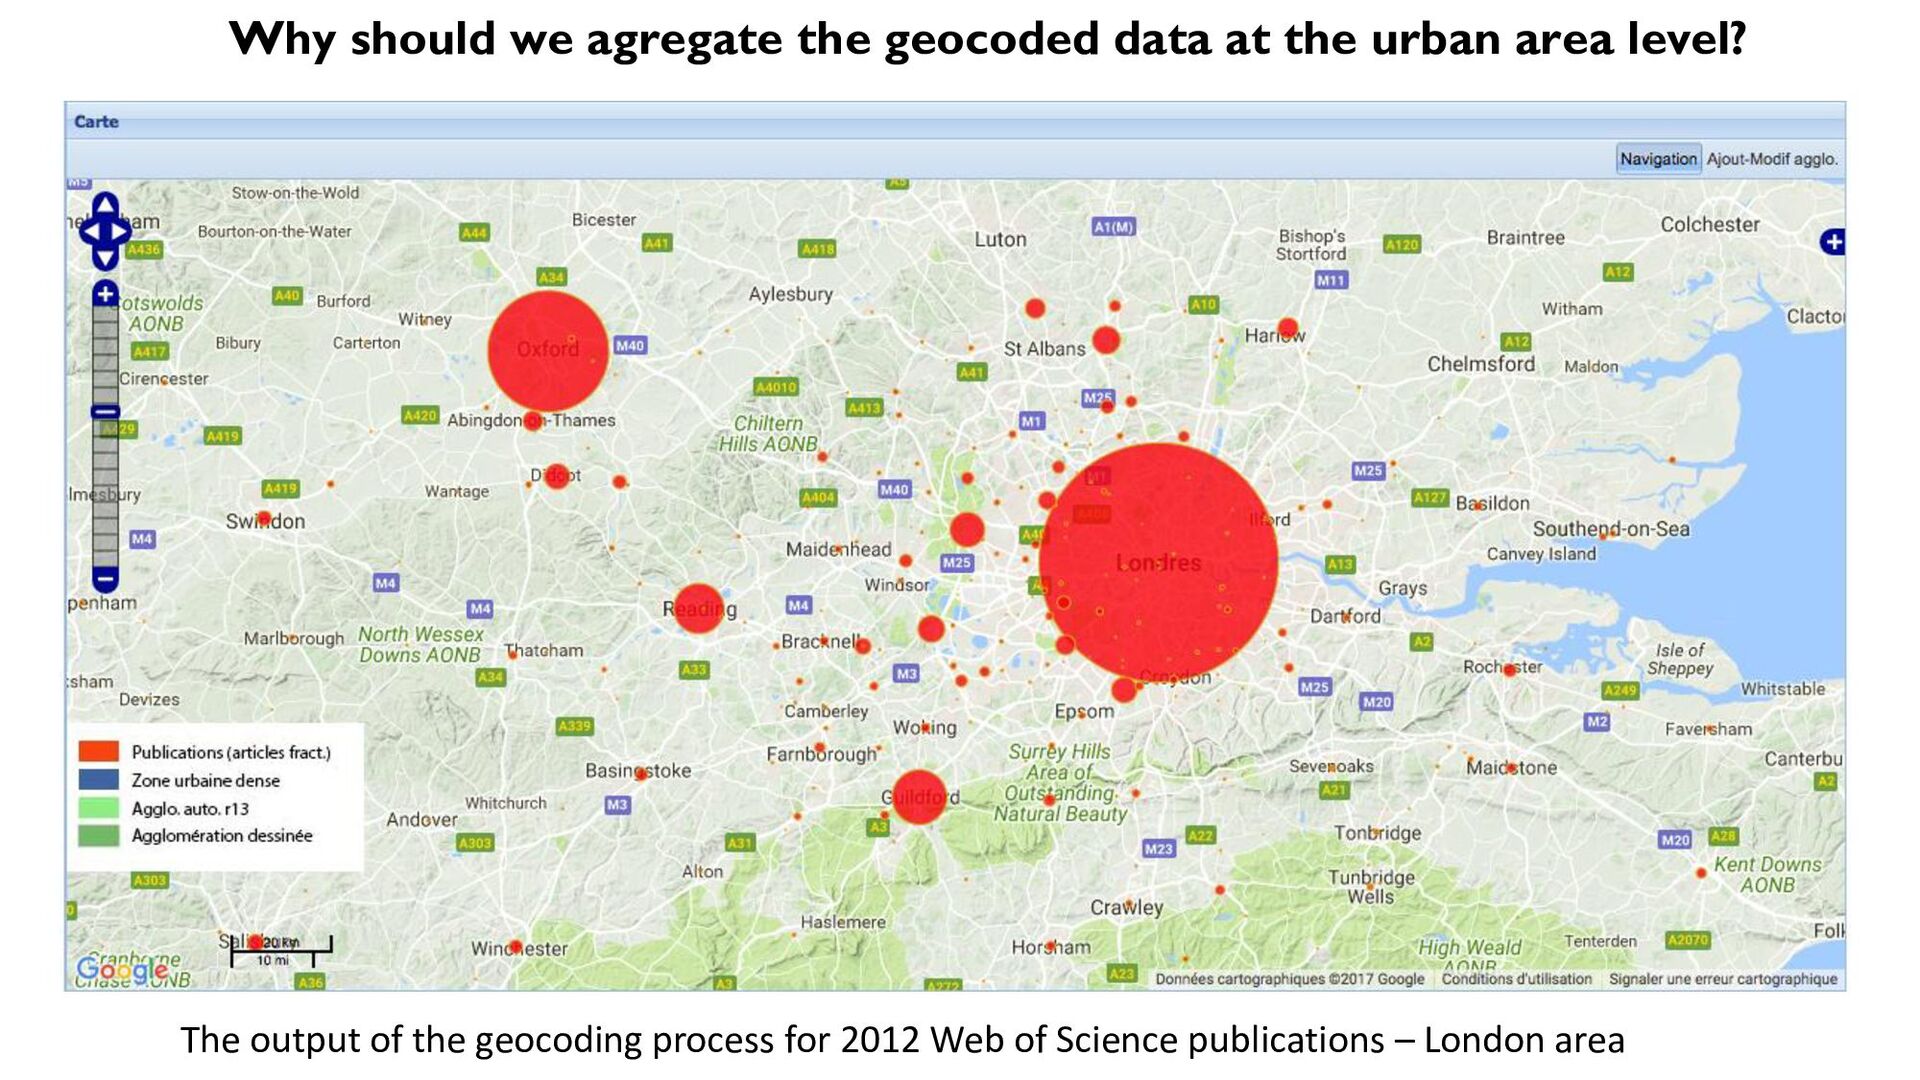
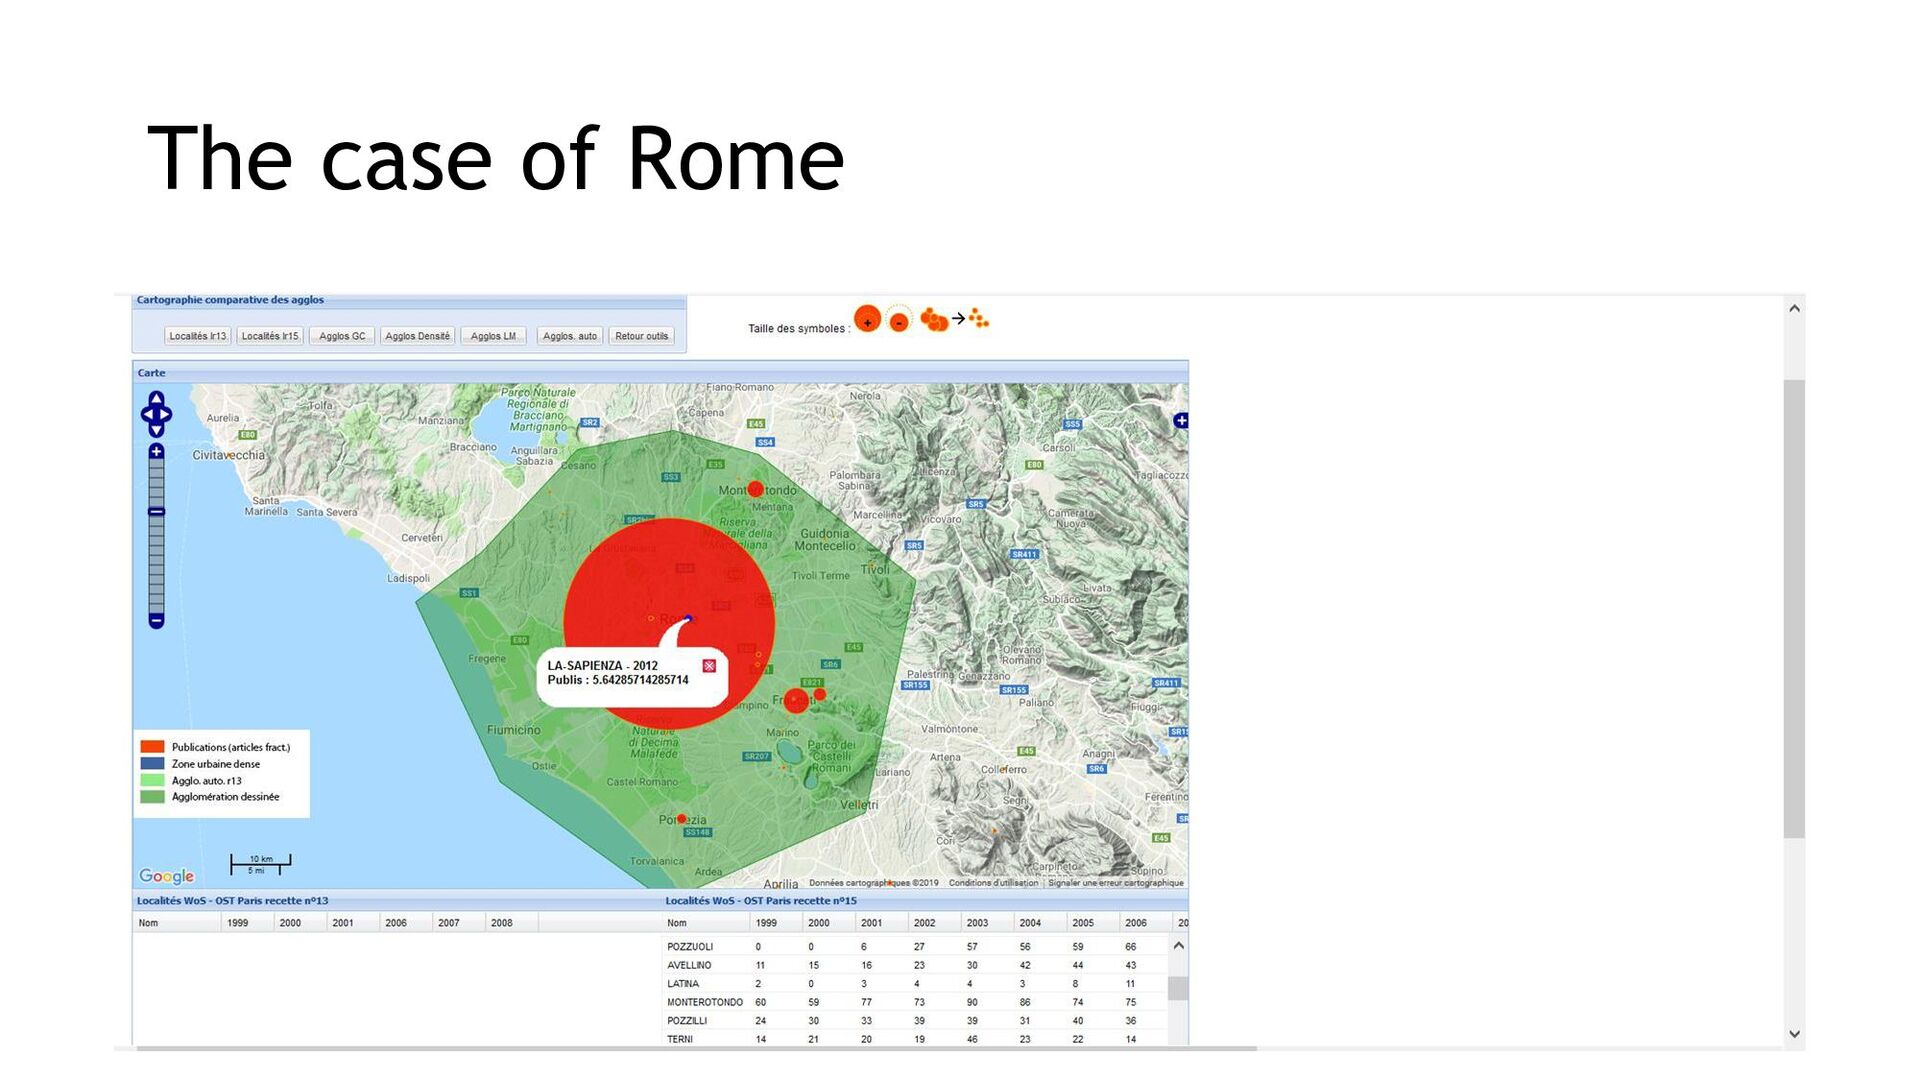
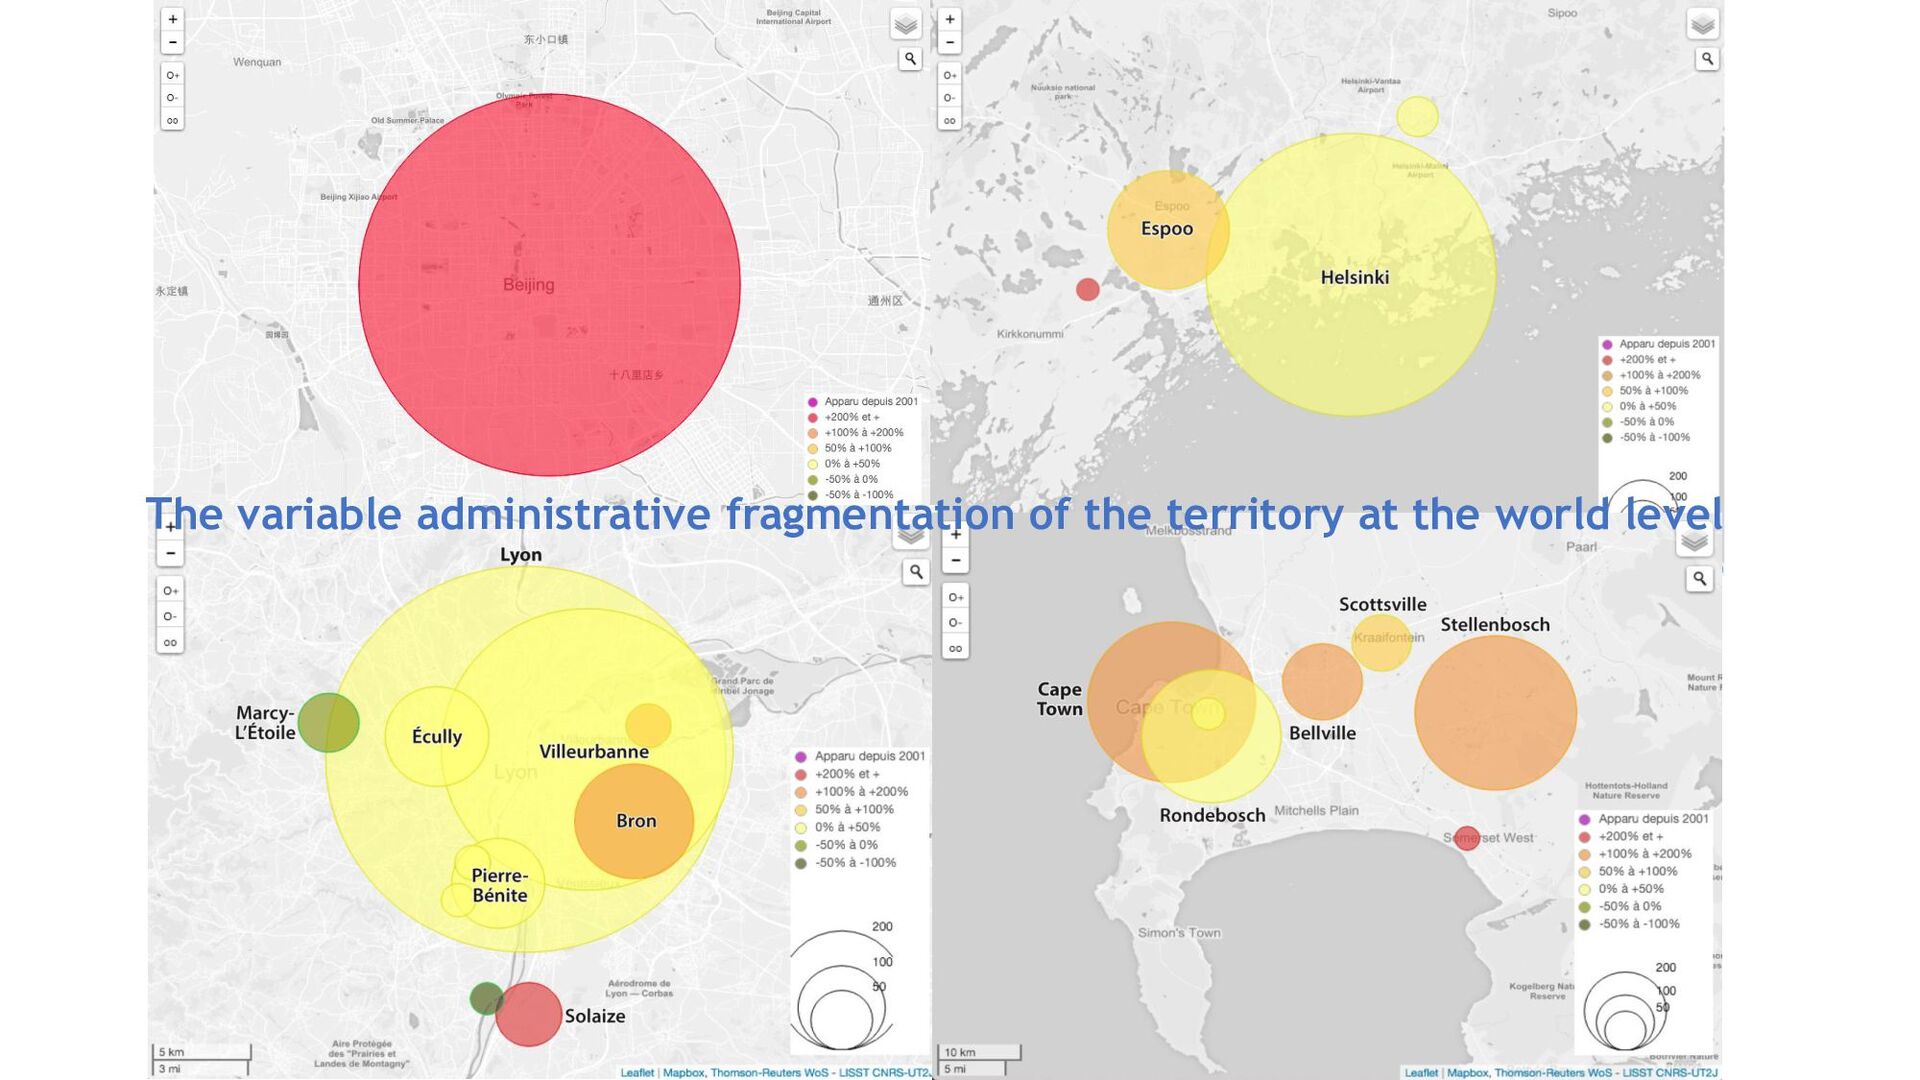
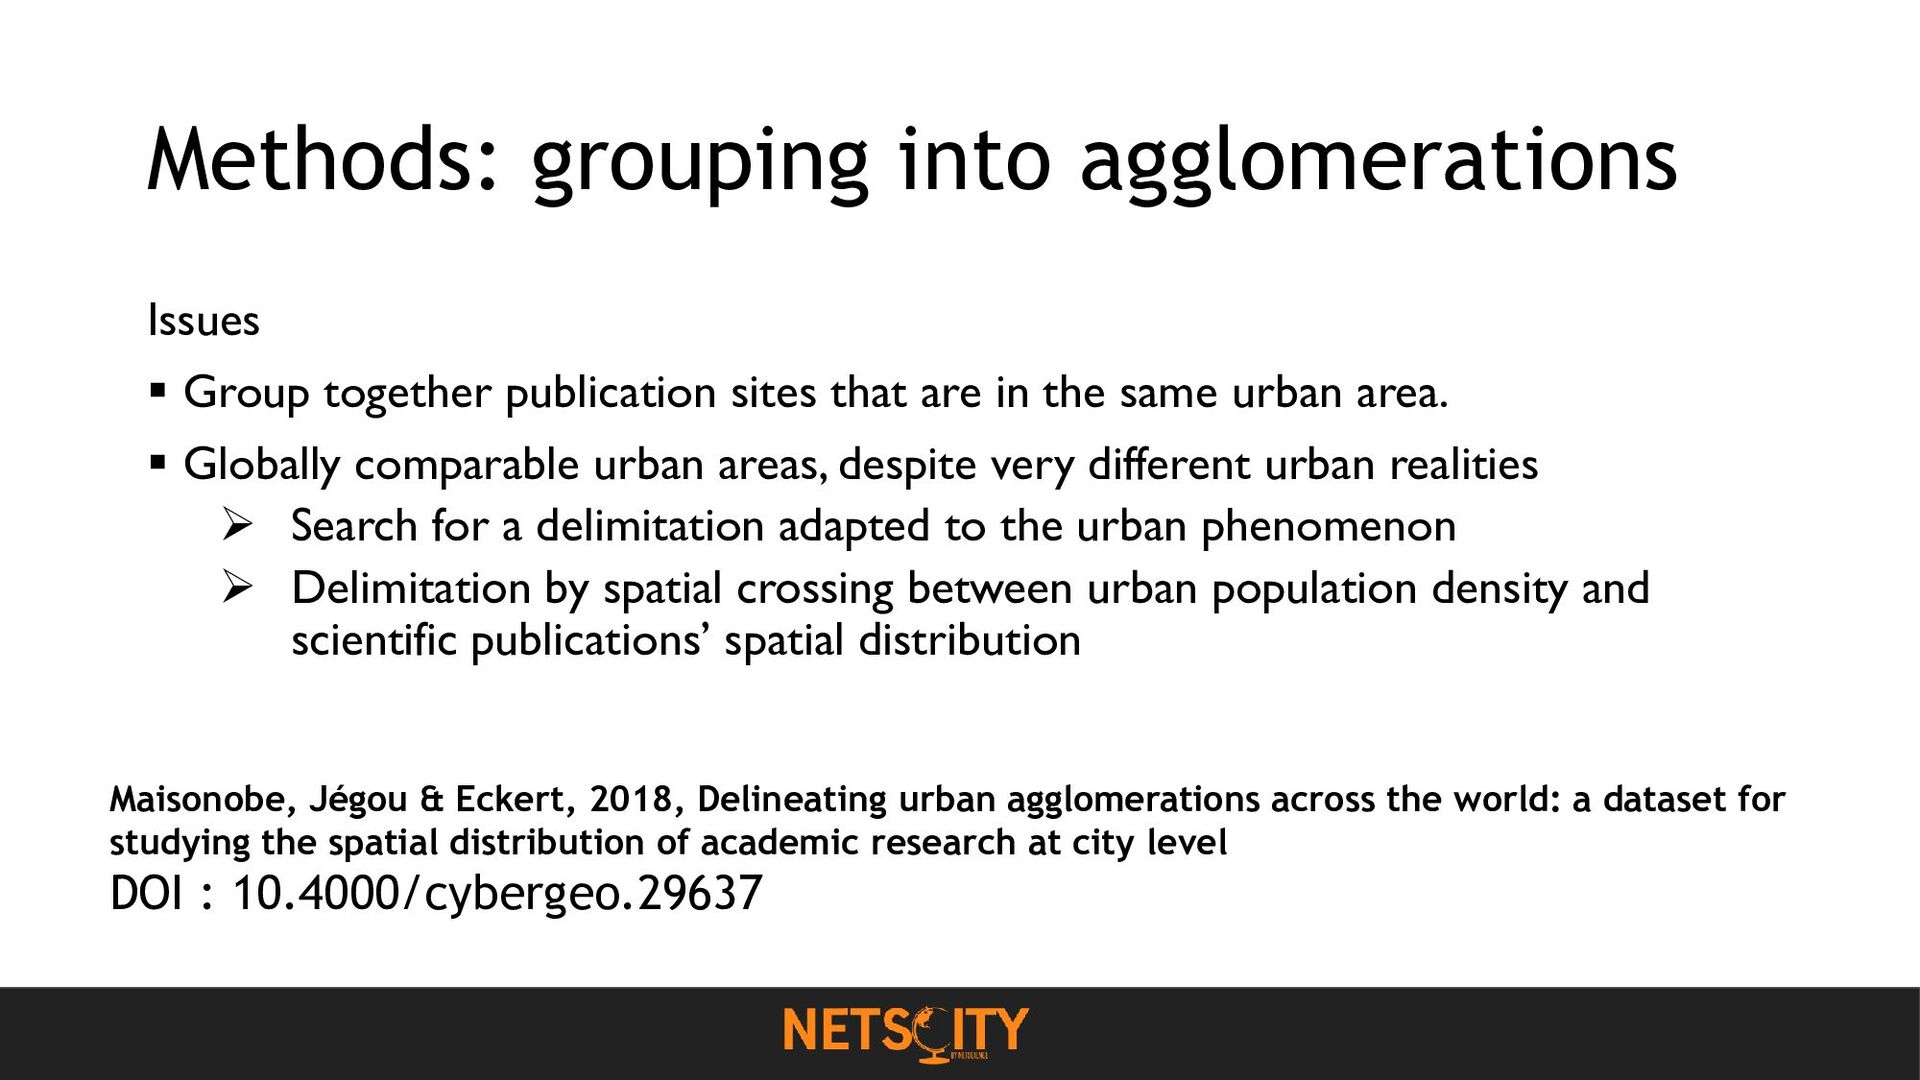
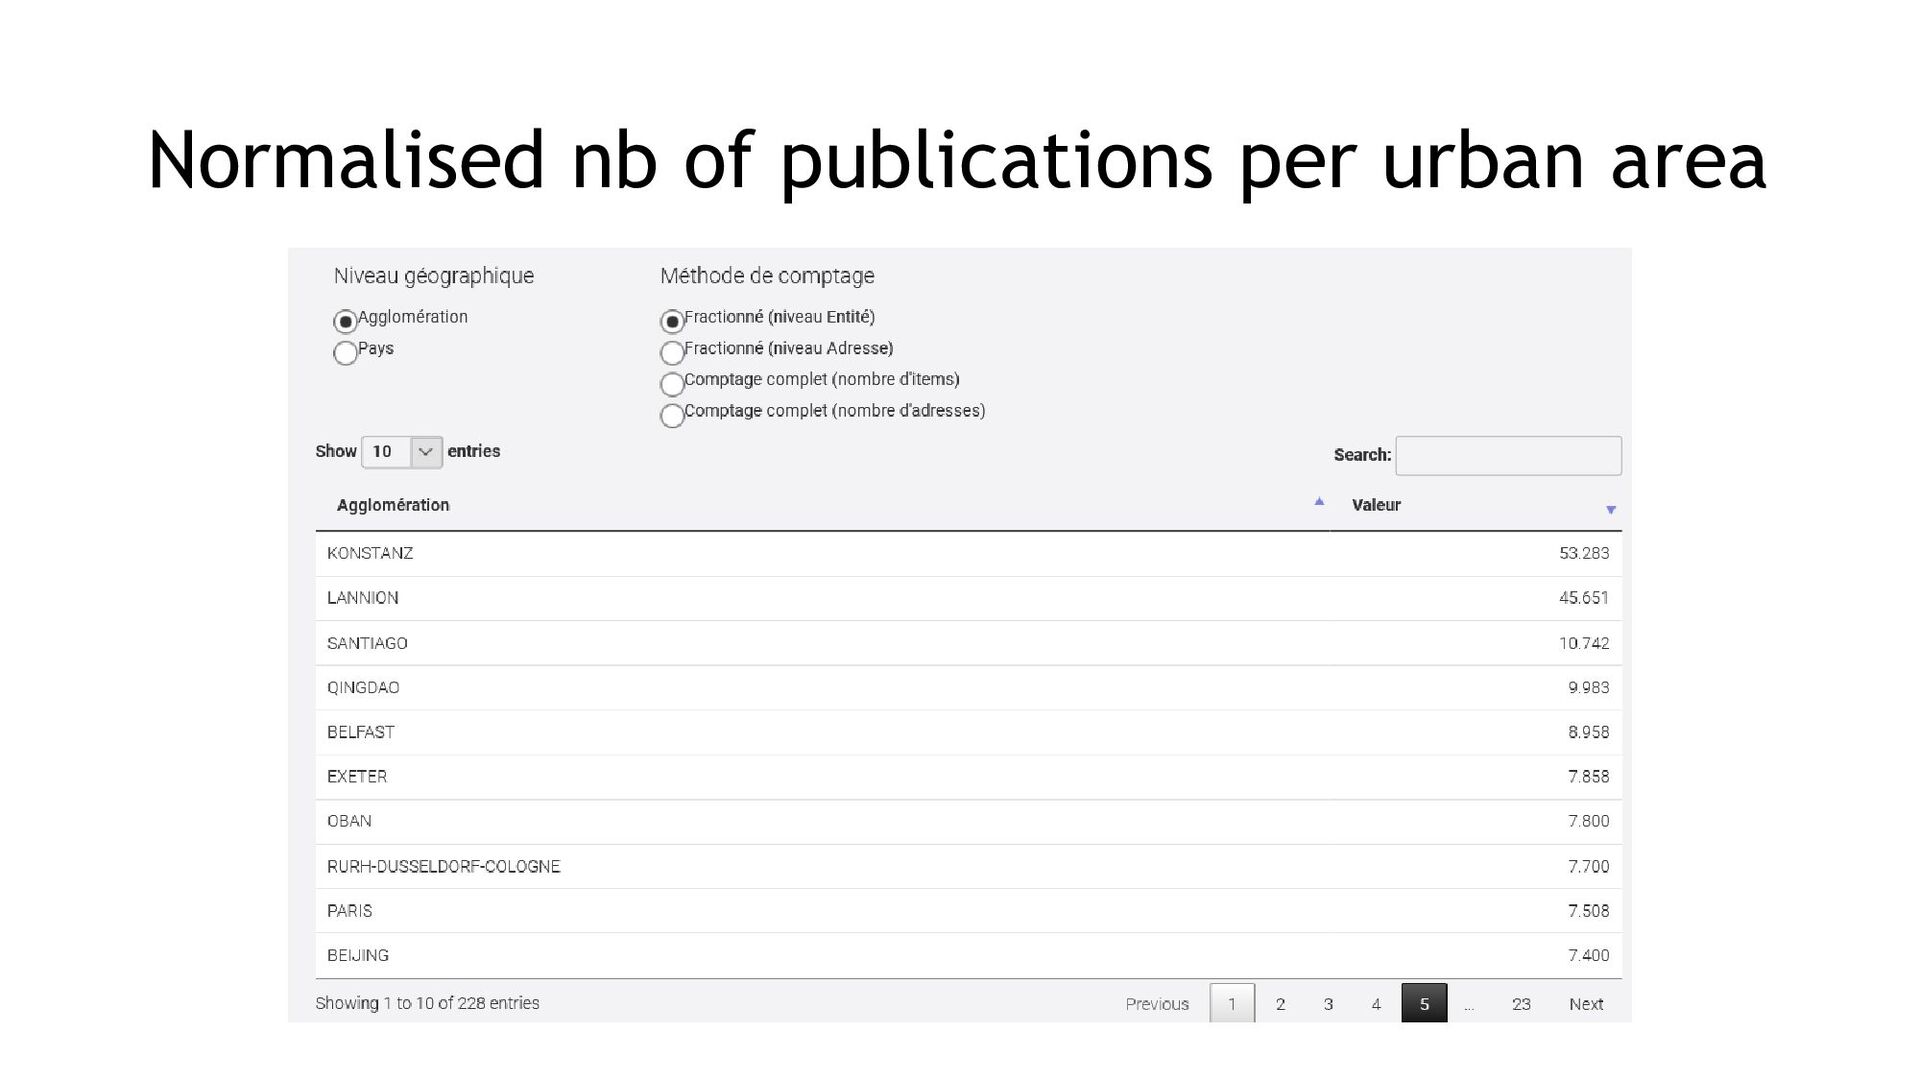
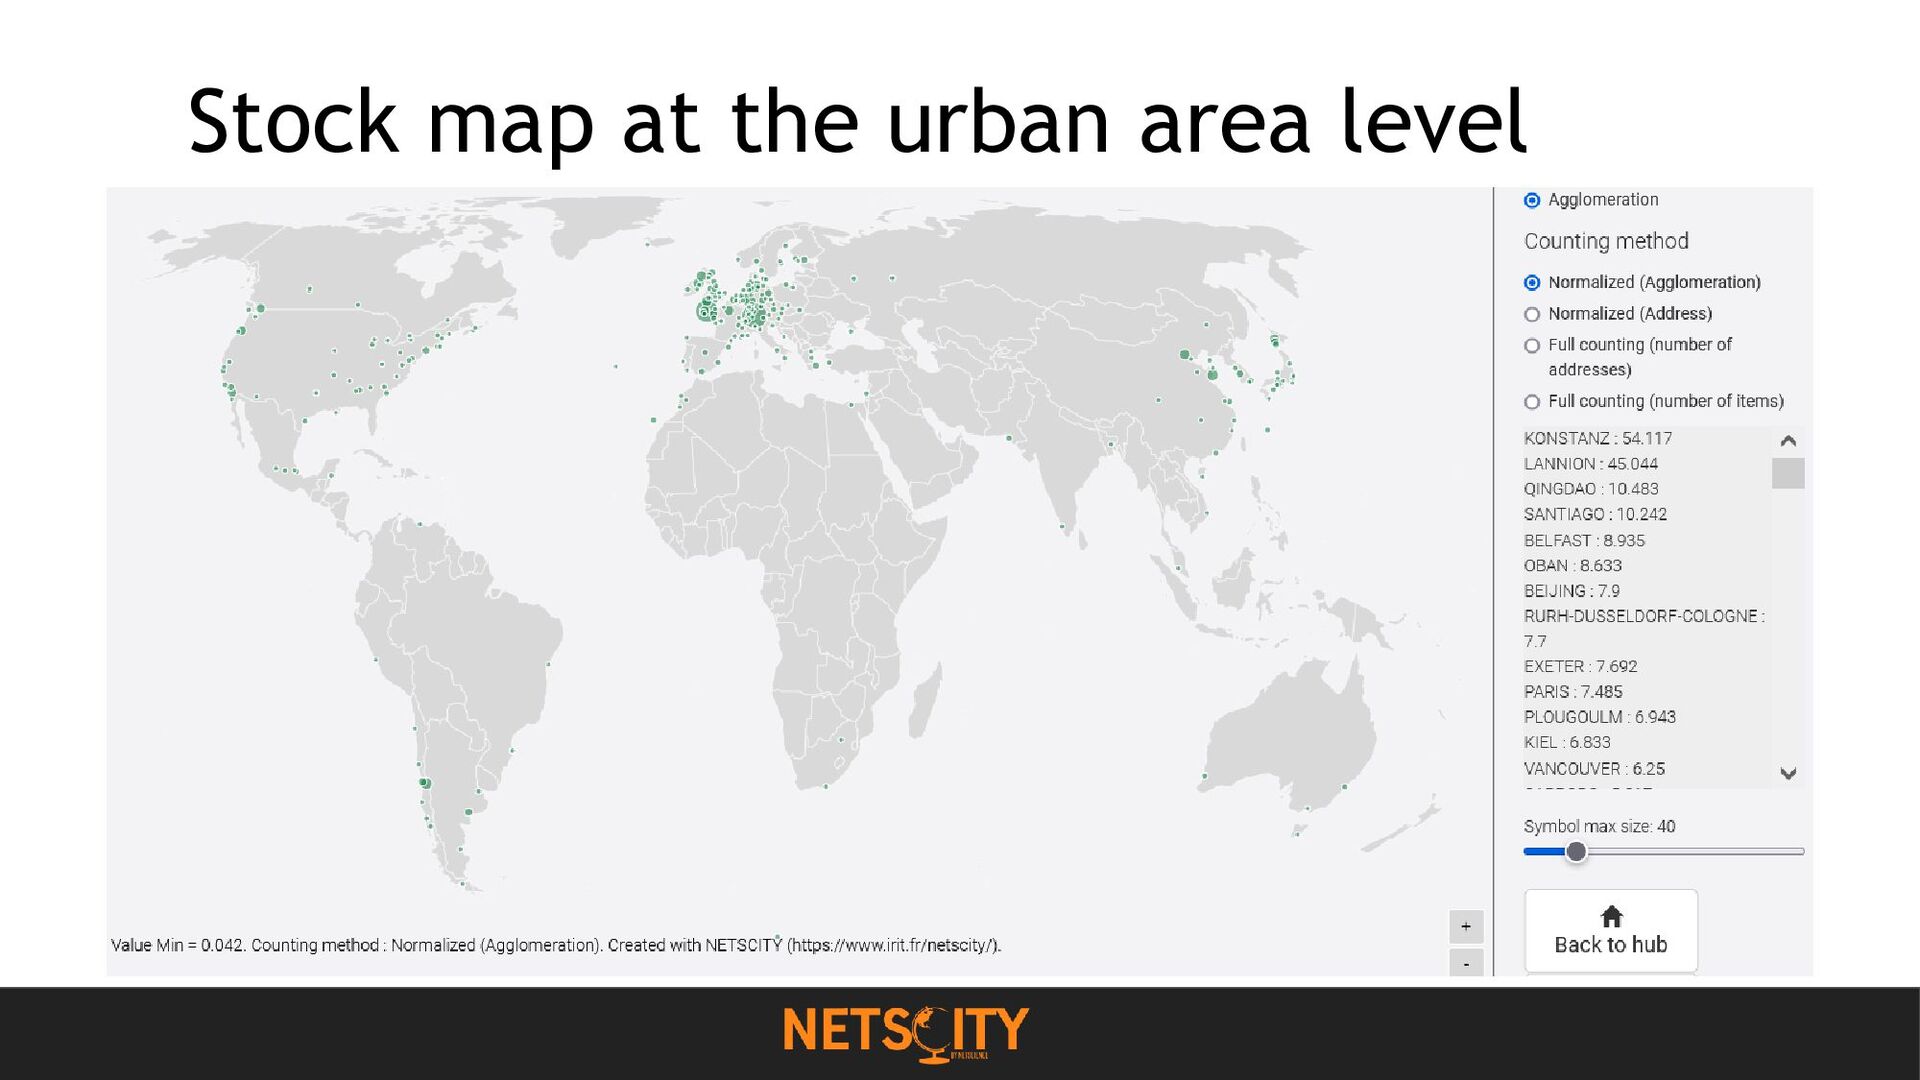
that are in the same urban area. ▪ Globally comparable urban areas, despite very different urban realities ➢ Search for a delimitation adapted to the urban phenomenon ➢ Delimitation by spatial crossing between urban population density and scientific publications’ spatial distribution Maisonobe, Jégou & Eckert, 2018, Delineating urban agglomerations across the world: a dataset for studying the spatial distribution of academic research at city level DOI : 10.4000/cybergeo.29637
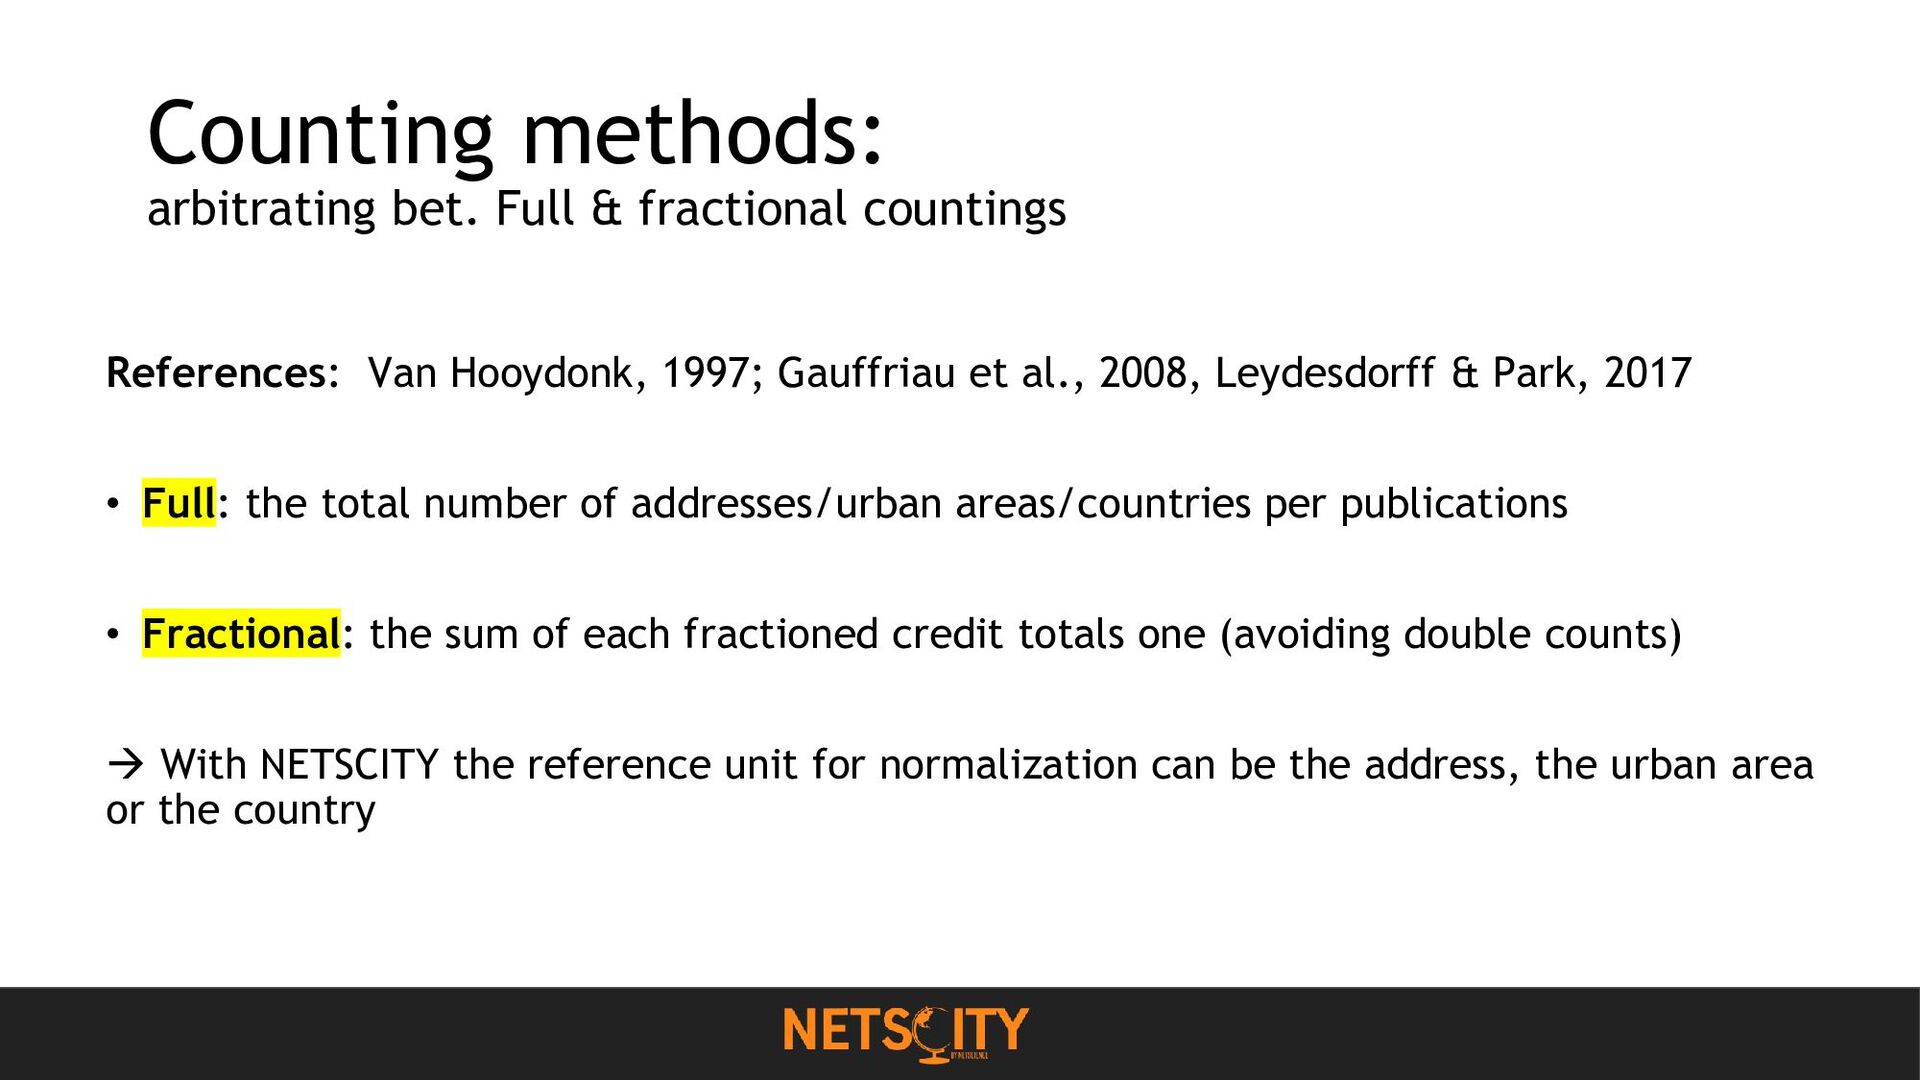
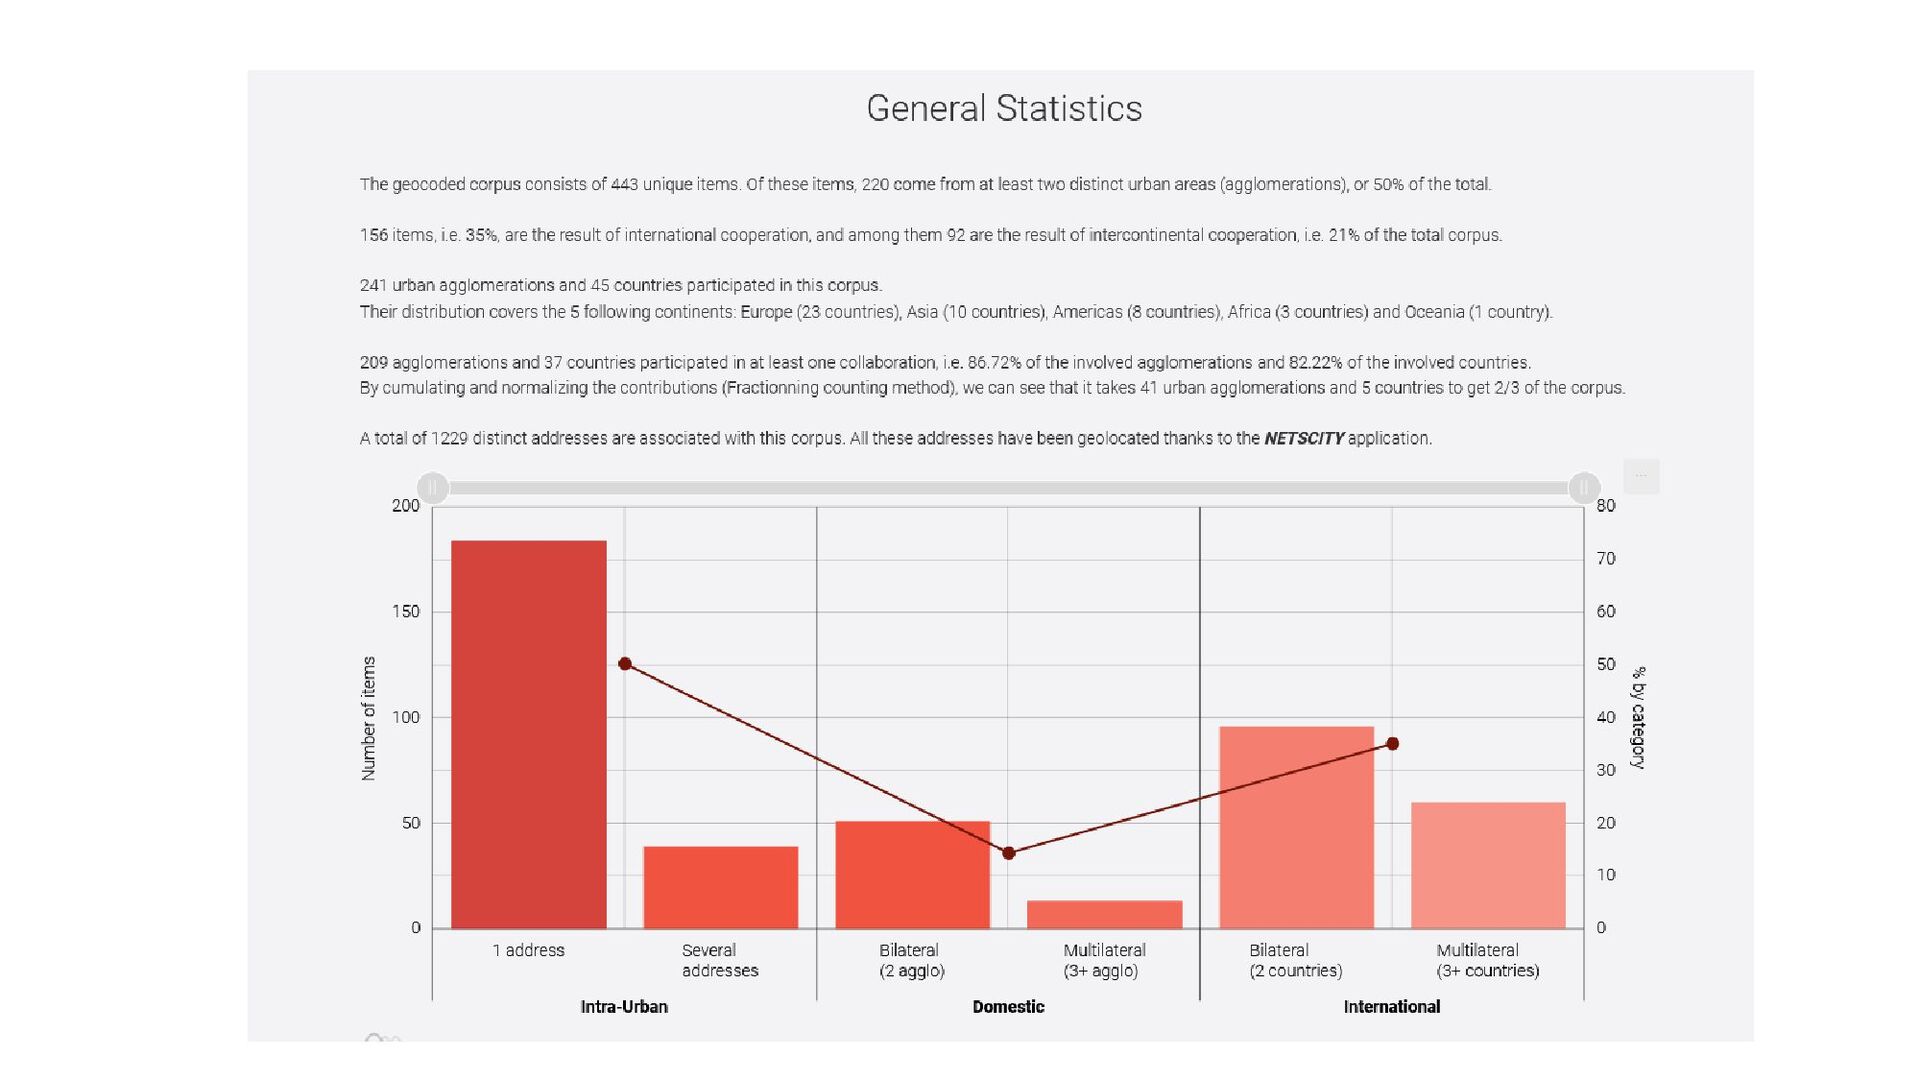
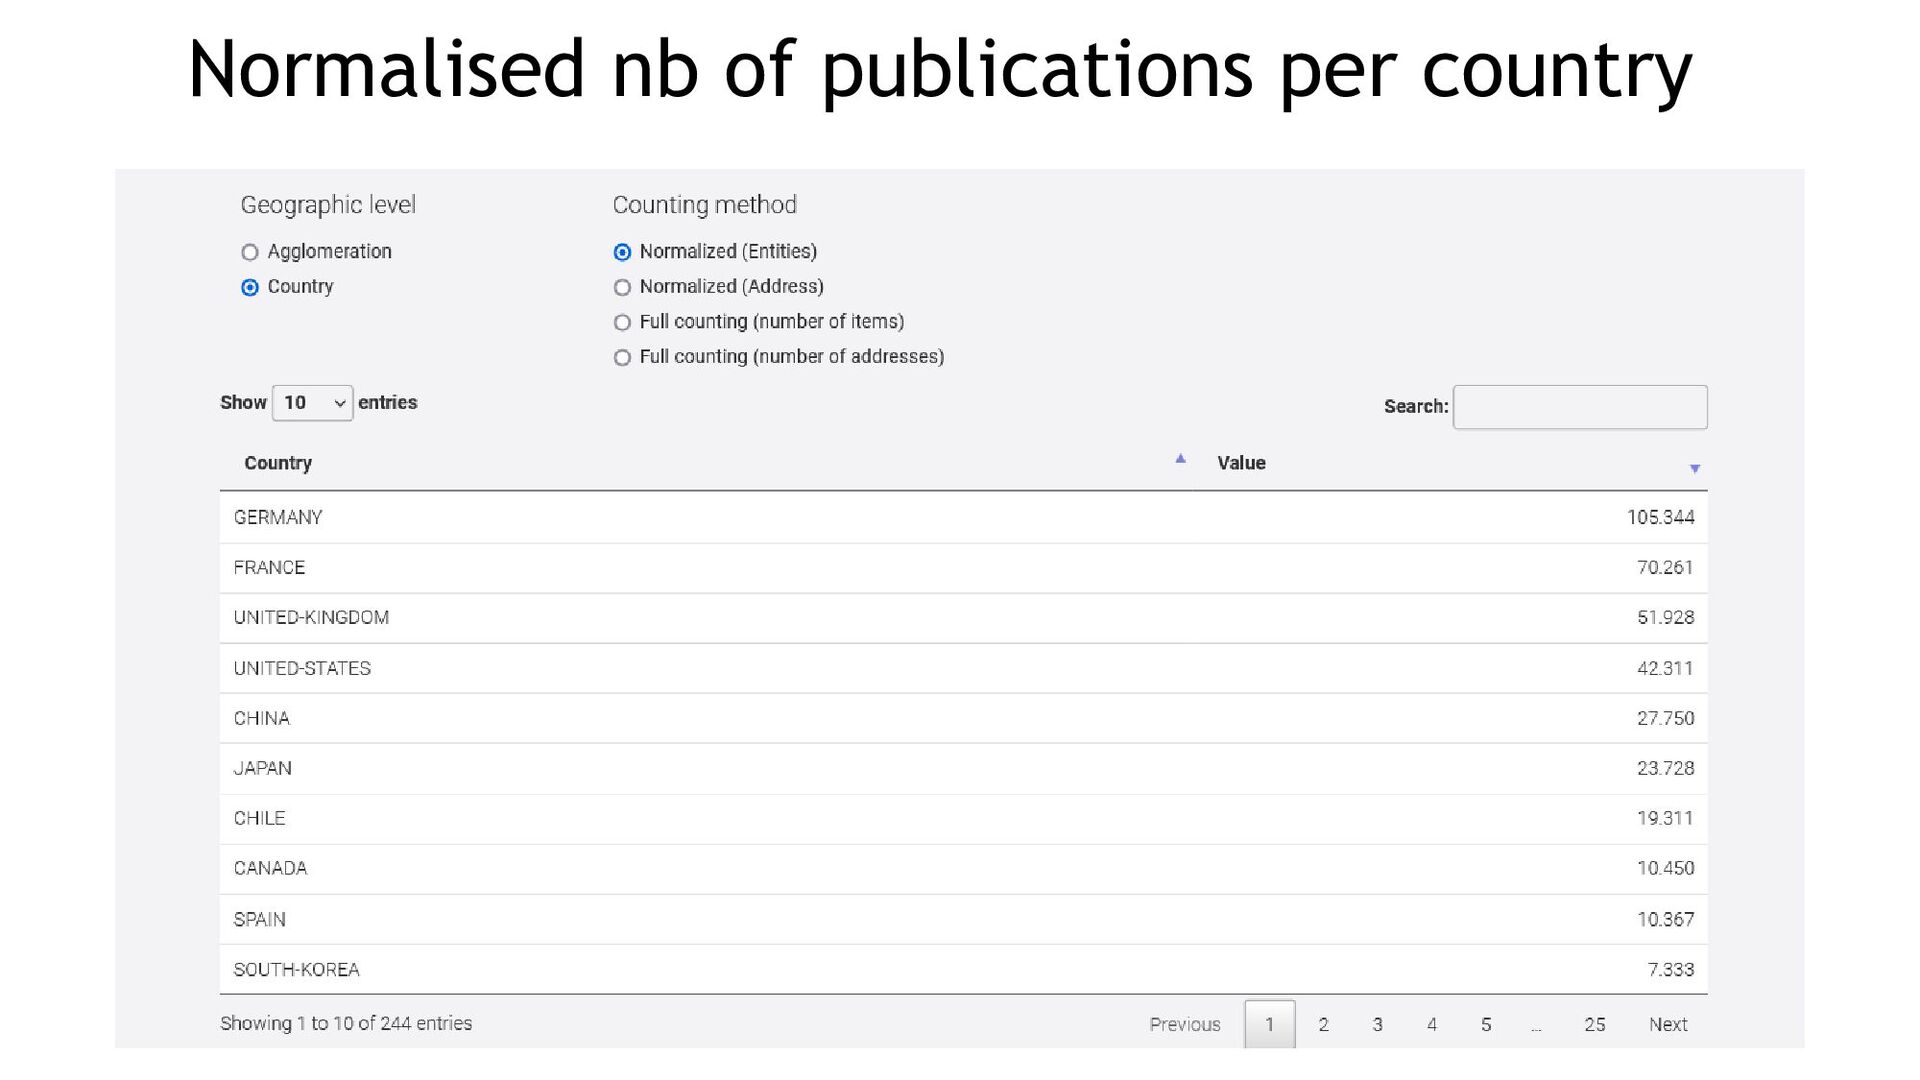
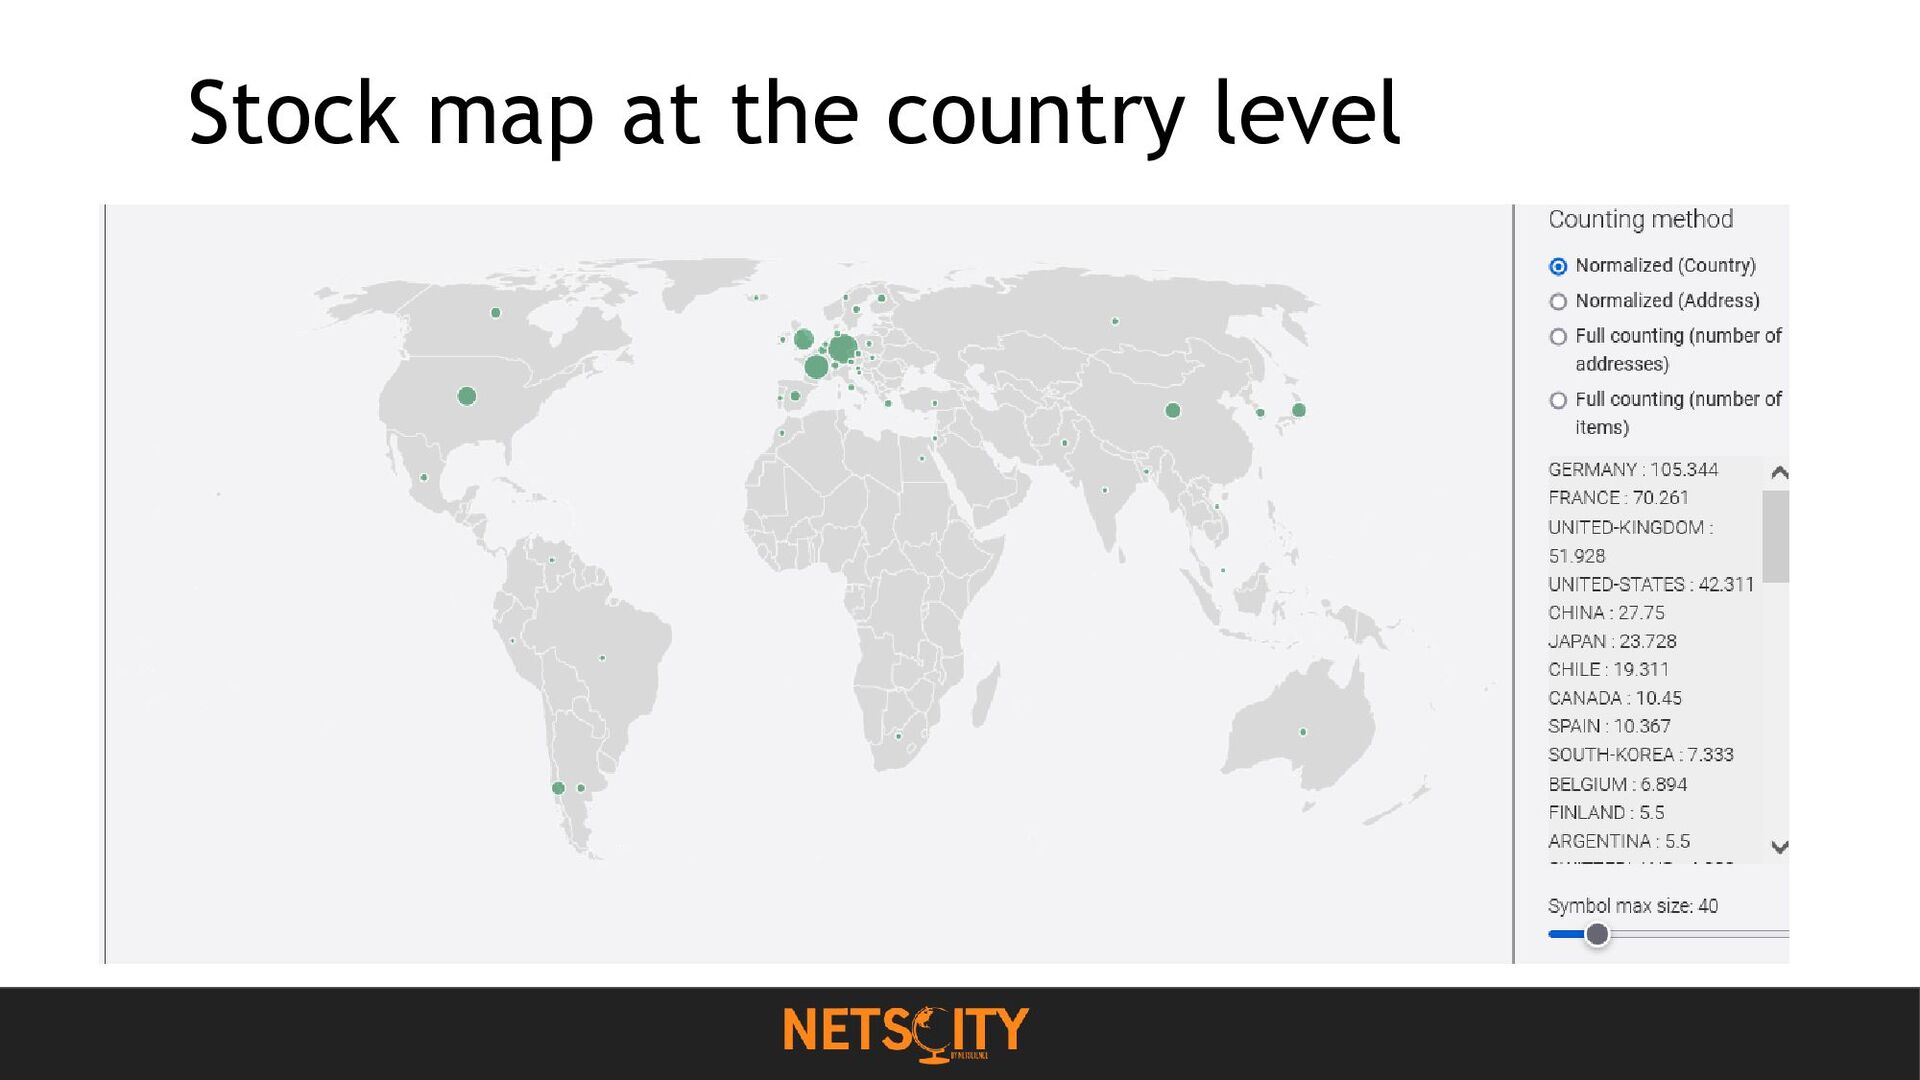
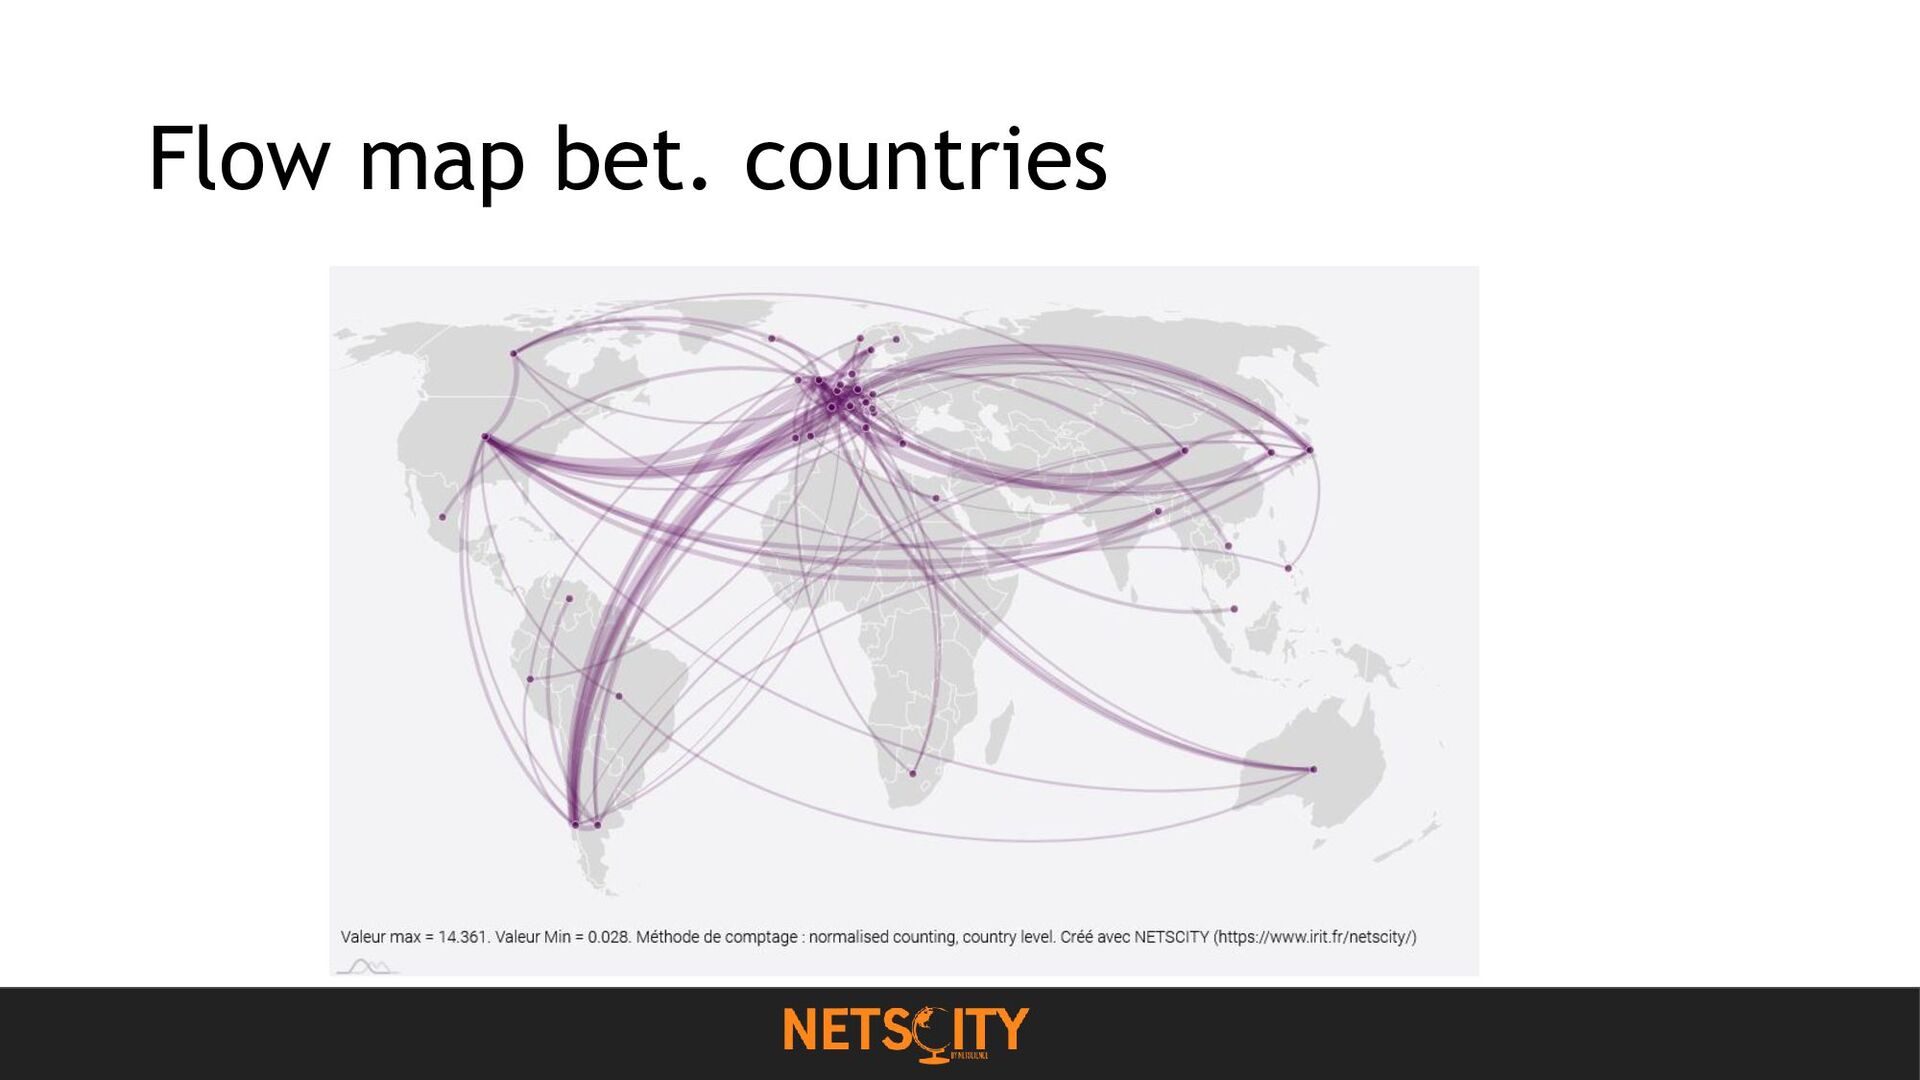
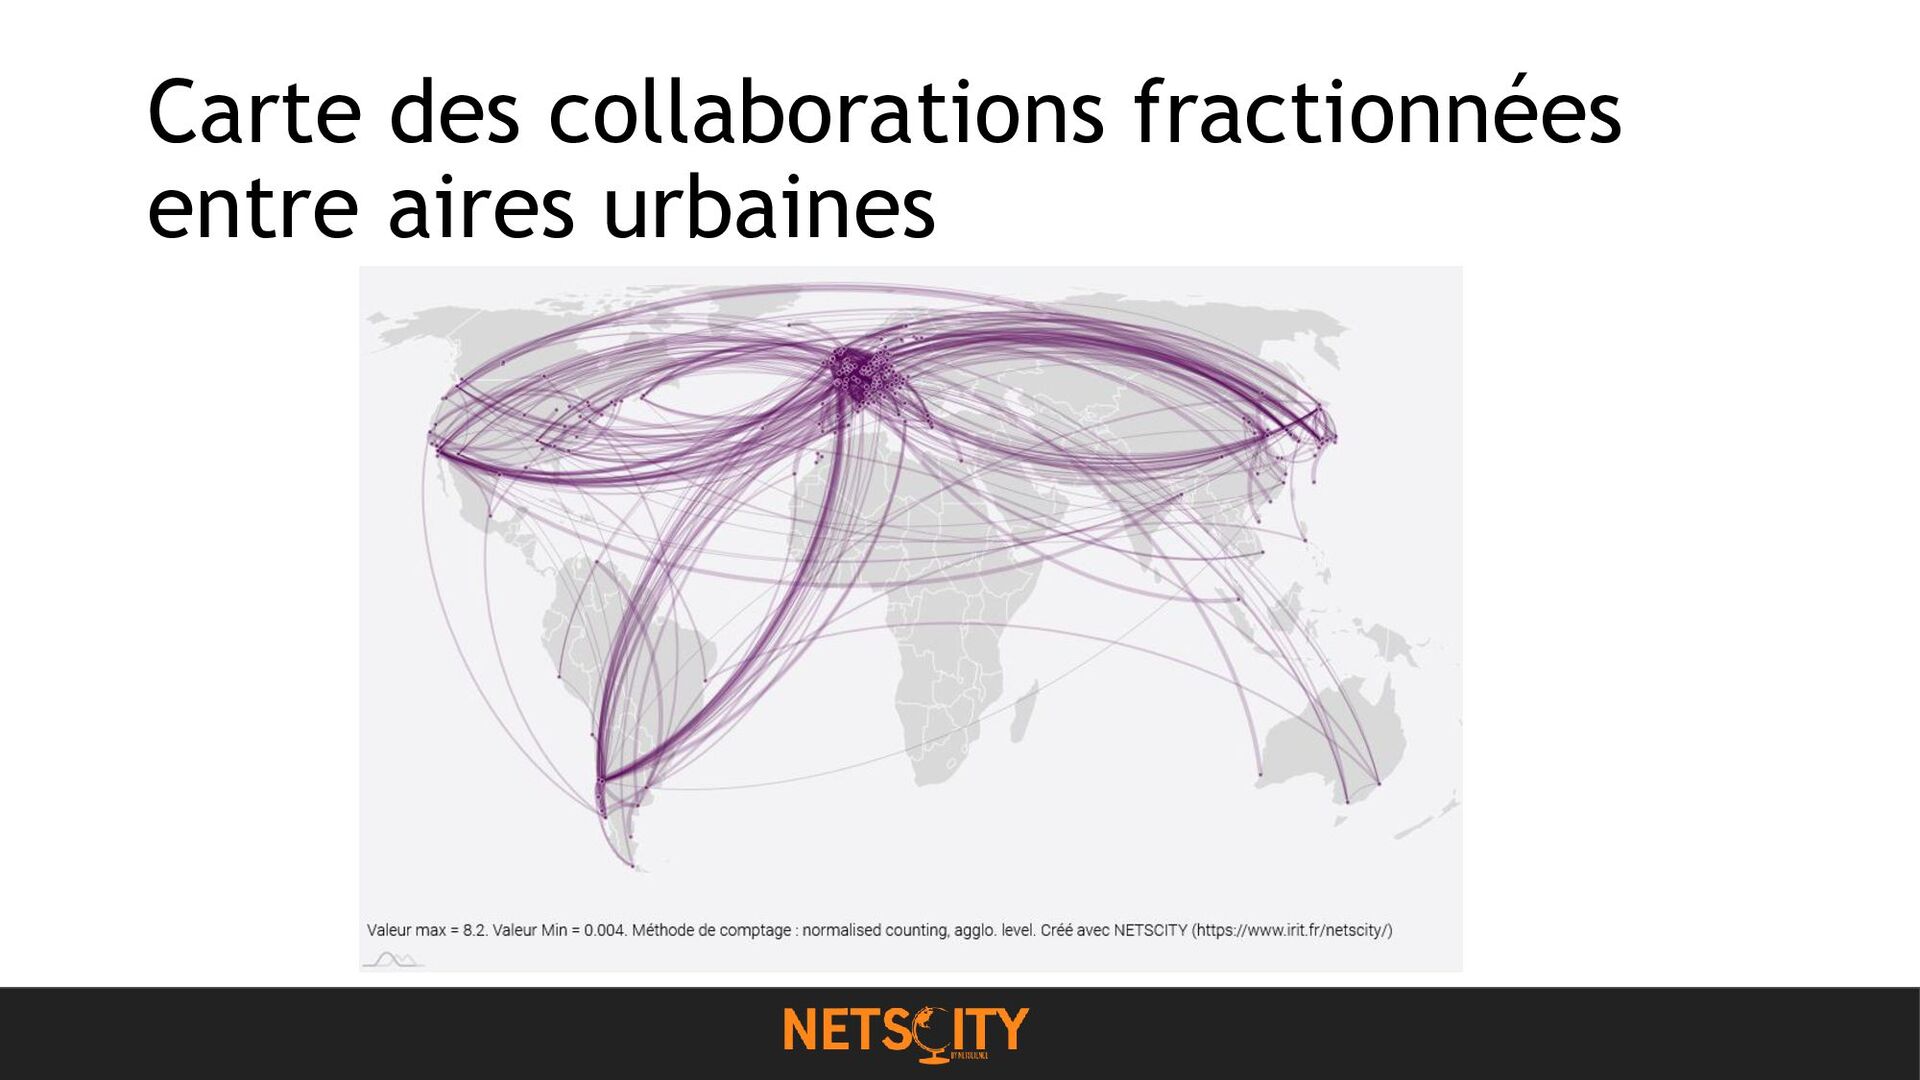
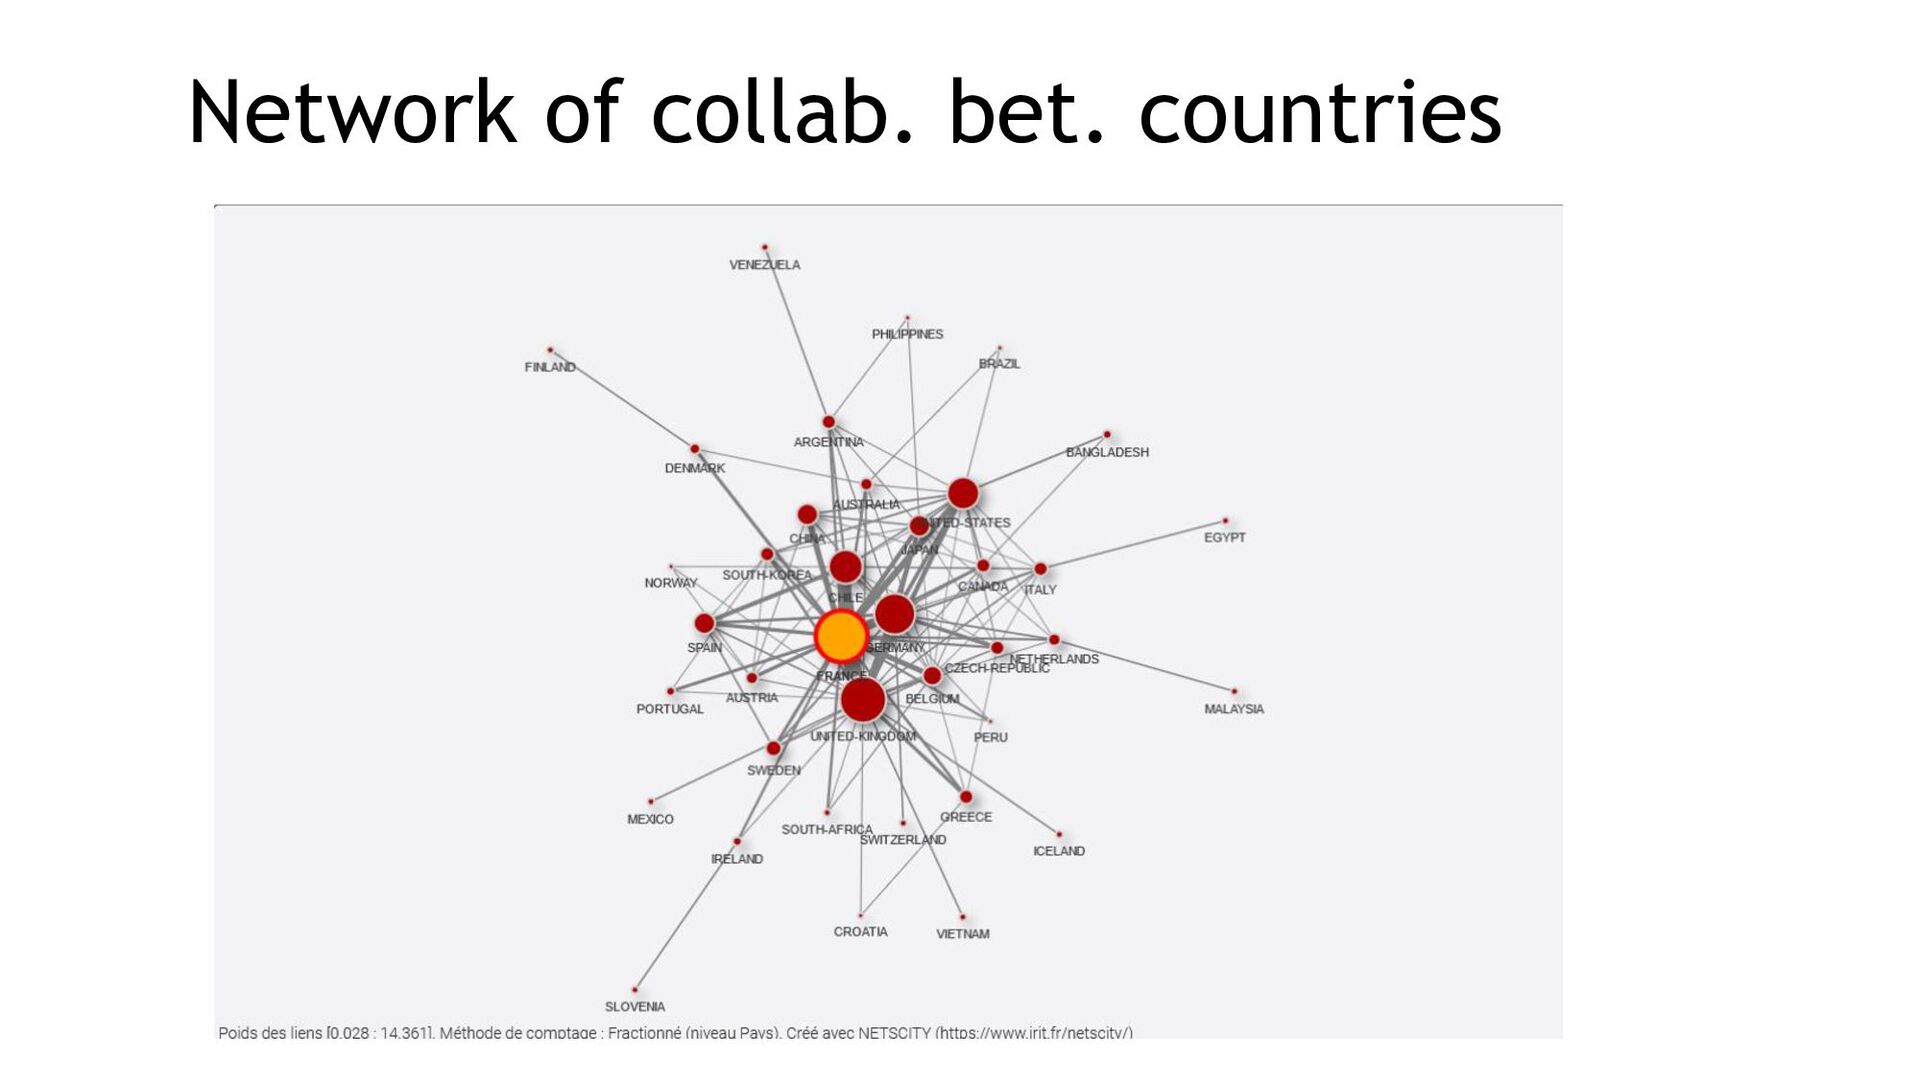
Hooydonk, 1997; Gauffriau et al., 2008, Leydesdorff & Park, 2017 • Full: the total number of addresses/urban areas/countries per publications • Fractional: the sum of each fractioned credit totals one (avoiding double counts) → With NETSCITY the reference unit for normalization can be the address, the urban area or the country
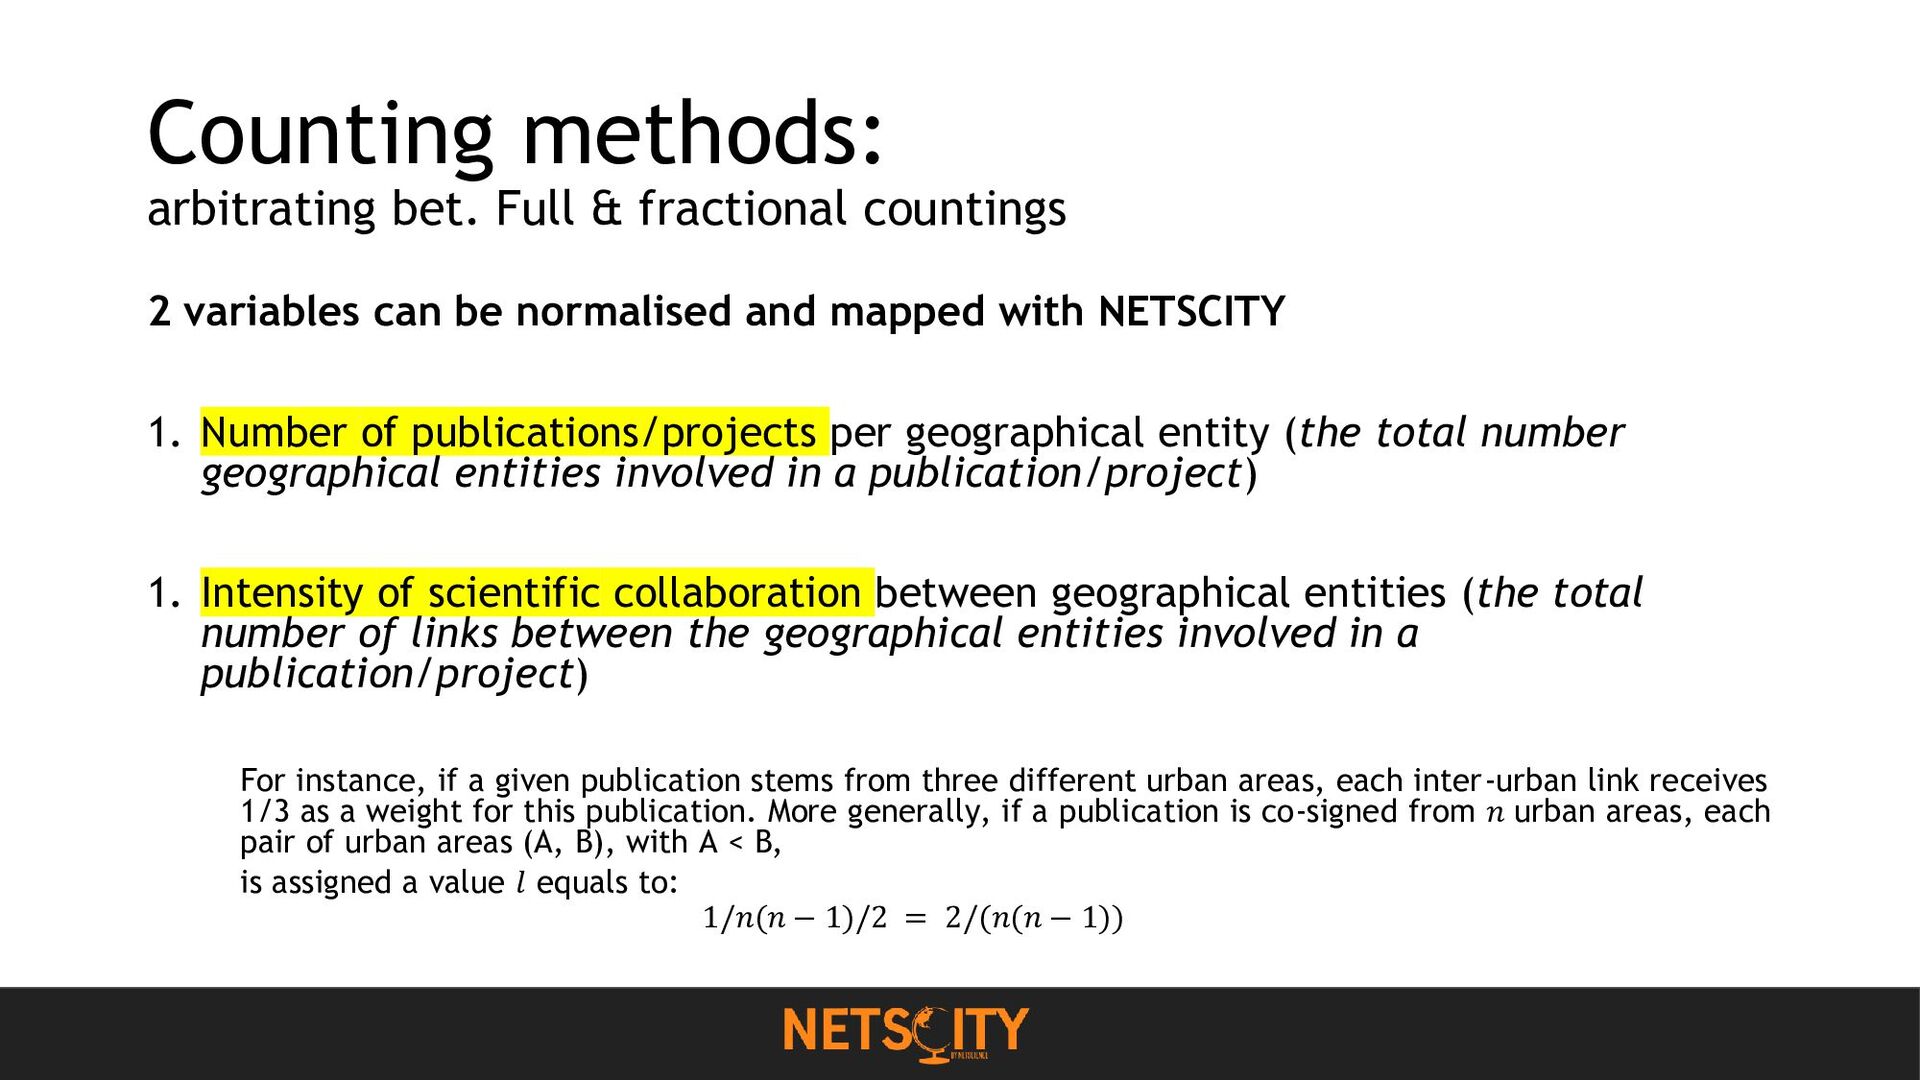
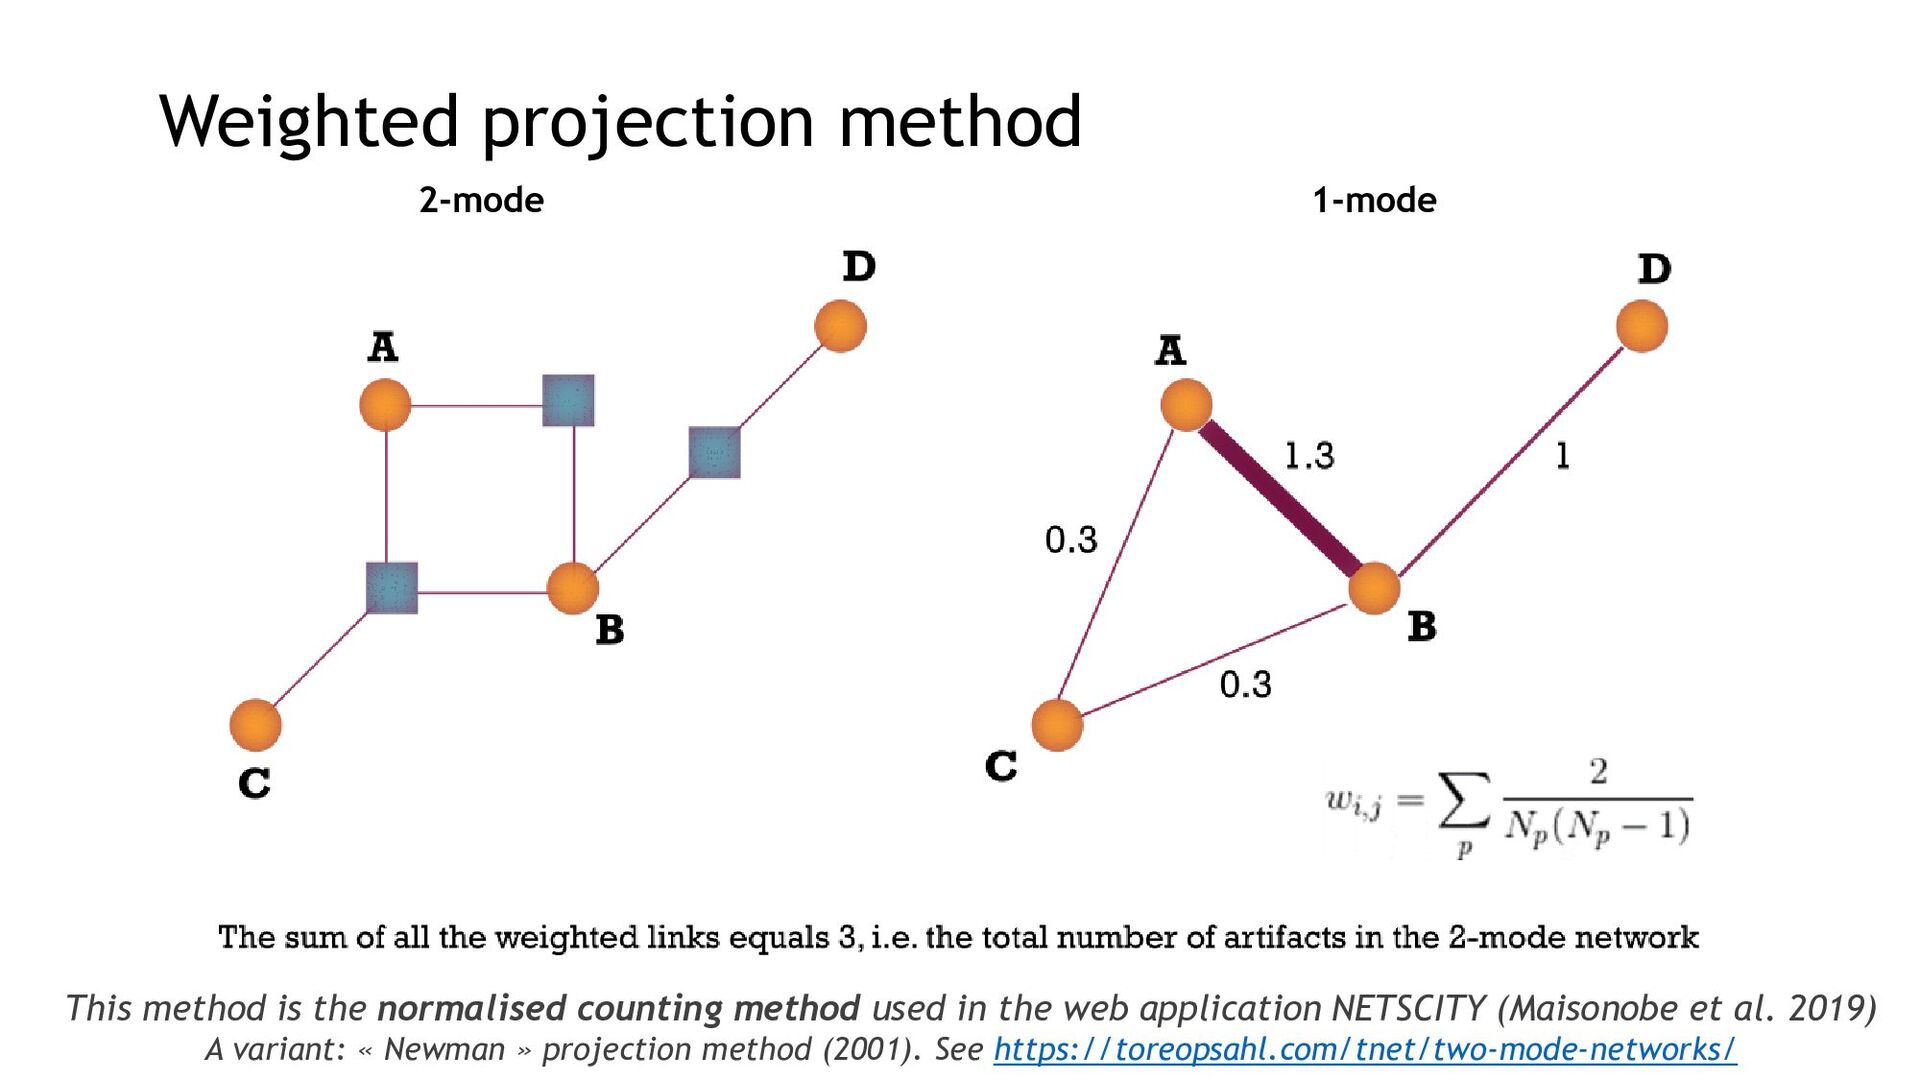
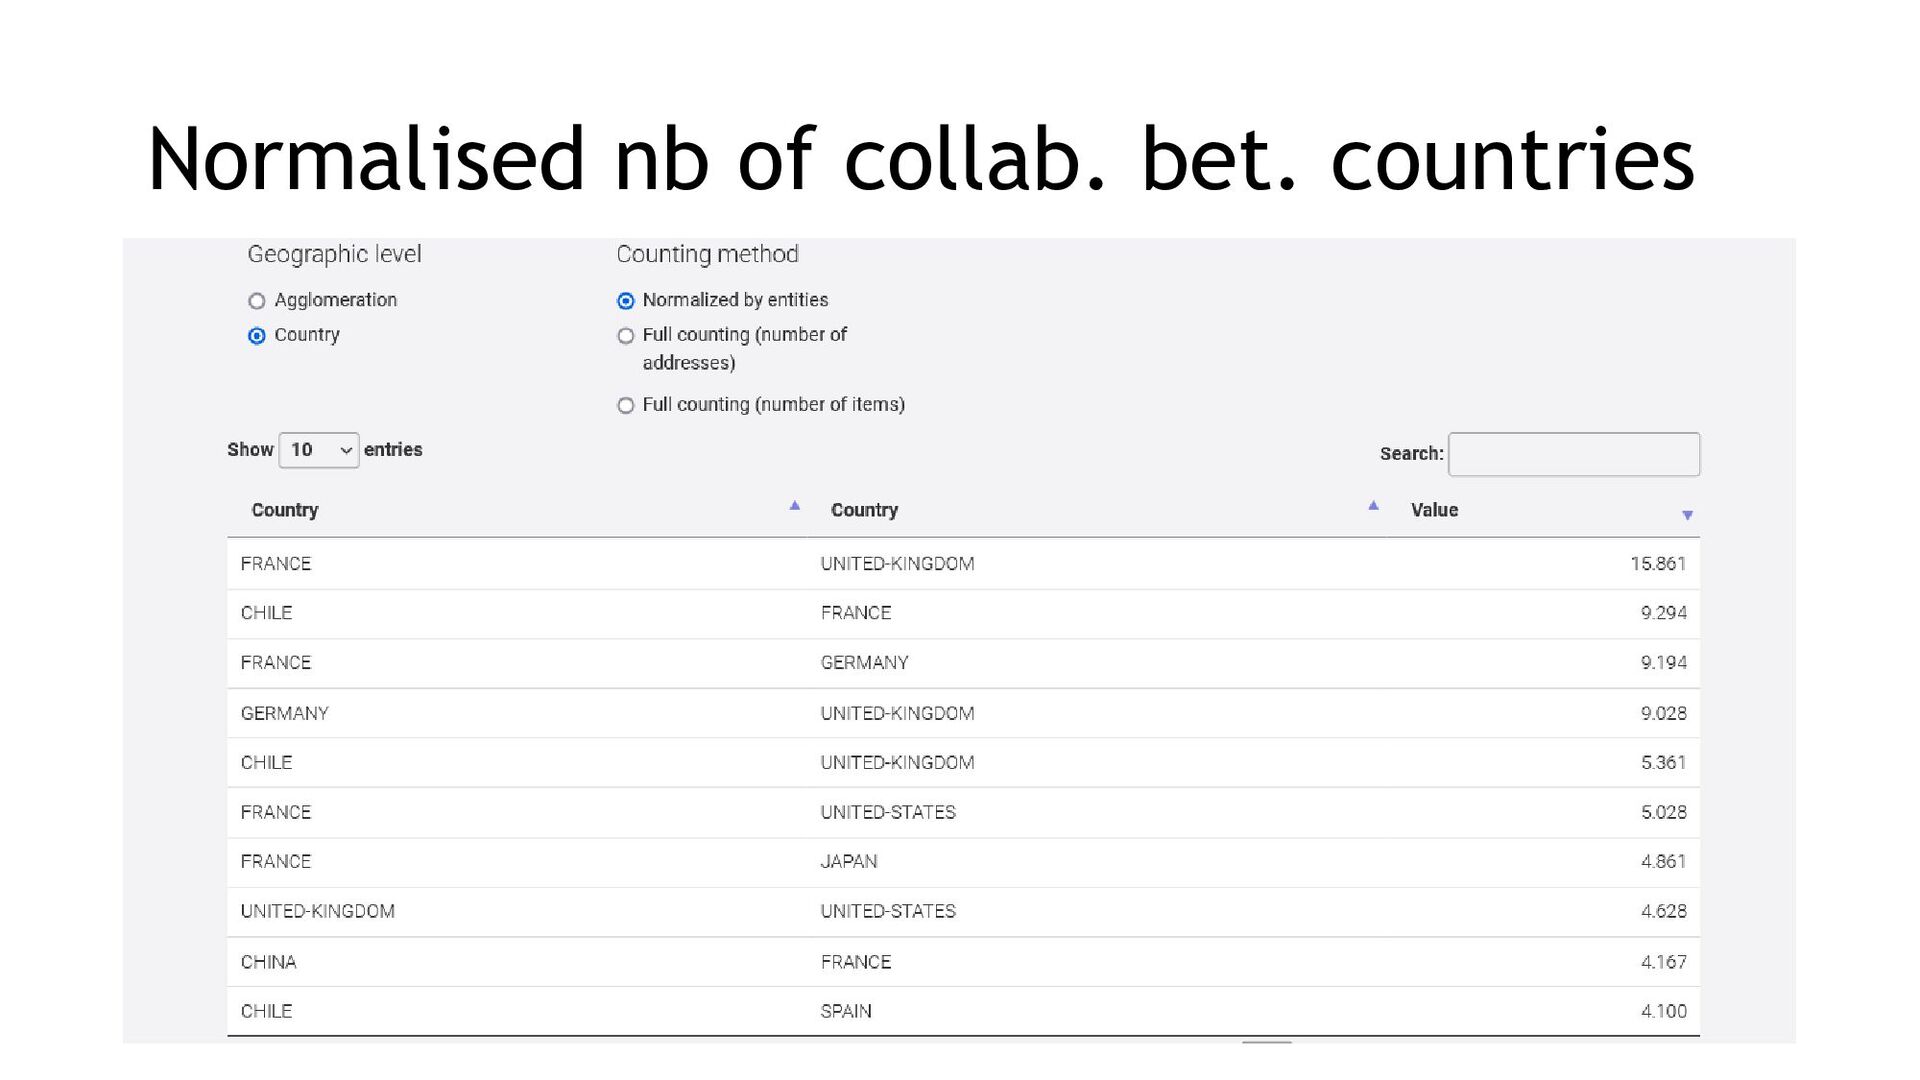
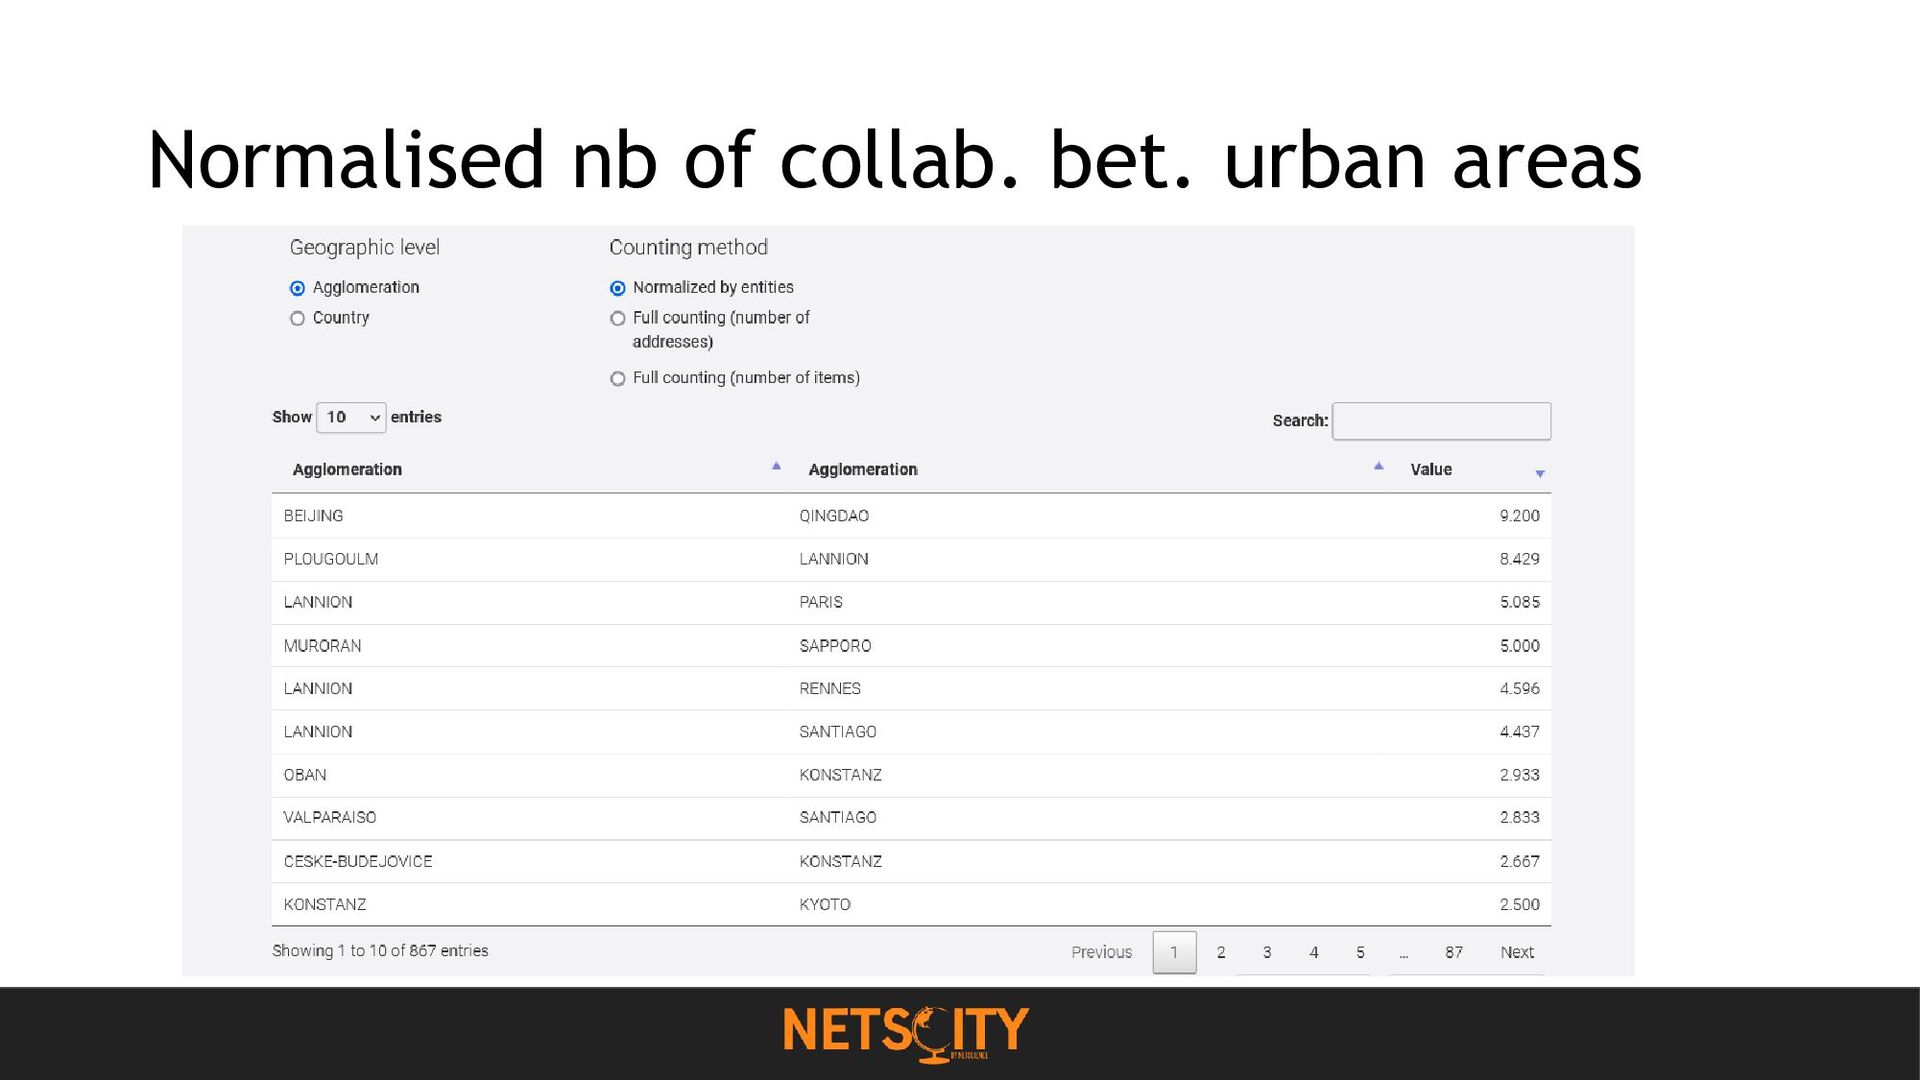
can be normalised and mapped with NETSCITY 1. Number of publications/projects per geographical entity (the total number geographical entities involved in a publication/project) 1. Intensity of scientific collaboration between geographical entities (the total number of links between the geographical entities involved in a publication/project) For instance, if a given publication stems from three different urban areas, each inter-urban link receives 1/3 as a weight for this publication. More generally, if a publication is co-signed from 𝑛 urban areas, each pair of urban areas (A, B), with A < B, is assigned a value 𝑙 equals to: 1/𝑛(𝑛 − 1)/2 = 2/(𝑛(𝑛 − 1))
used in the web application NETSCITY (Maisonobe et al. 2019) A variant: « Newman » projection method (2001). See https://toreopsahl.com/tnet/two-mode-networks/ 2-mode 1-mode
alga OR kelp* OR algae* OR algal* OR seagrass* OR sea plant* OR phyco* OR Chlorell* OR Protothec* OR Charophy* OR Chlorophyt* OR Rhodophy* OR Cryptophy* OR Haptophy* OR Charophy* OR Chlorarachniophy* OR Glaucophy* OR rockweed* OR dulse* OR dillisk* OR dilsk* OR carragheen moss* OR sea lettuce* OR Chondrus) Should we add: microalga, macroalga, phytoplankton, cyanobacteria? Else? See: https://www.sciencedirect.com/science/article/pii/B9780128170762000135
NETSCITY: a geospatial application to analyse and map world scale production and collaboration data between cities. In ISSI’19: Proceedings of the 17th International Conference on Scientometrics and Informetrics, Tome 1, p. 631-642, Rome: Edizioni Efesto. [PDF]