and urban hierarchy? • To what extent is the distribution of research activities dependent on urban hierarchy? • Is city size a major determinant of scientific growth? • Is there a relationship between the size of cities and the type of scientific activities that take place there?
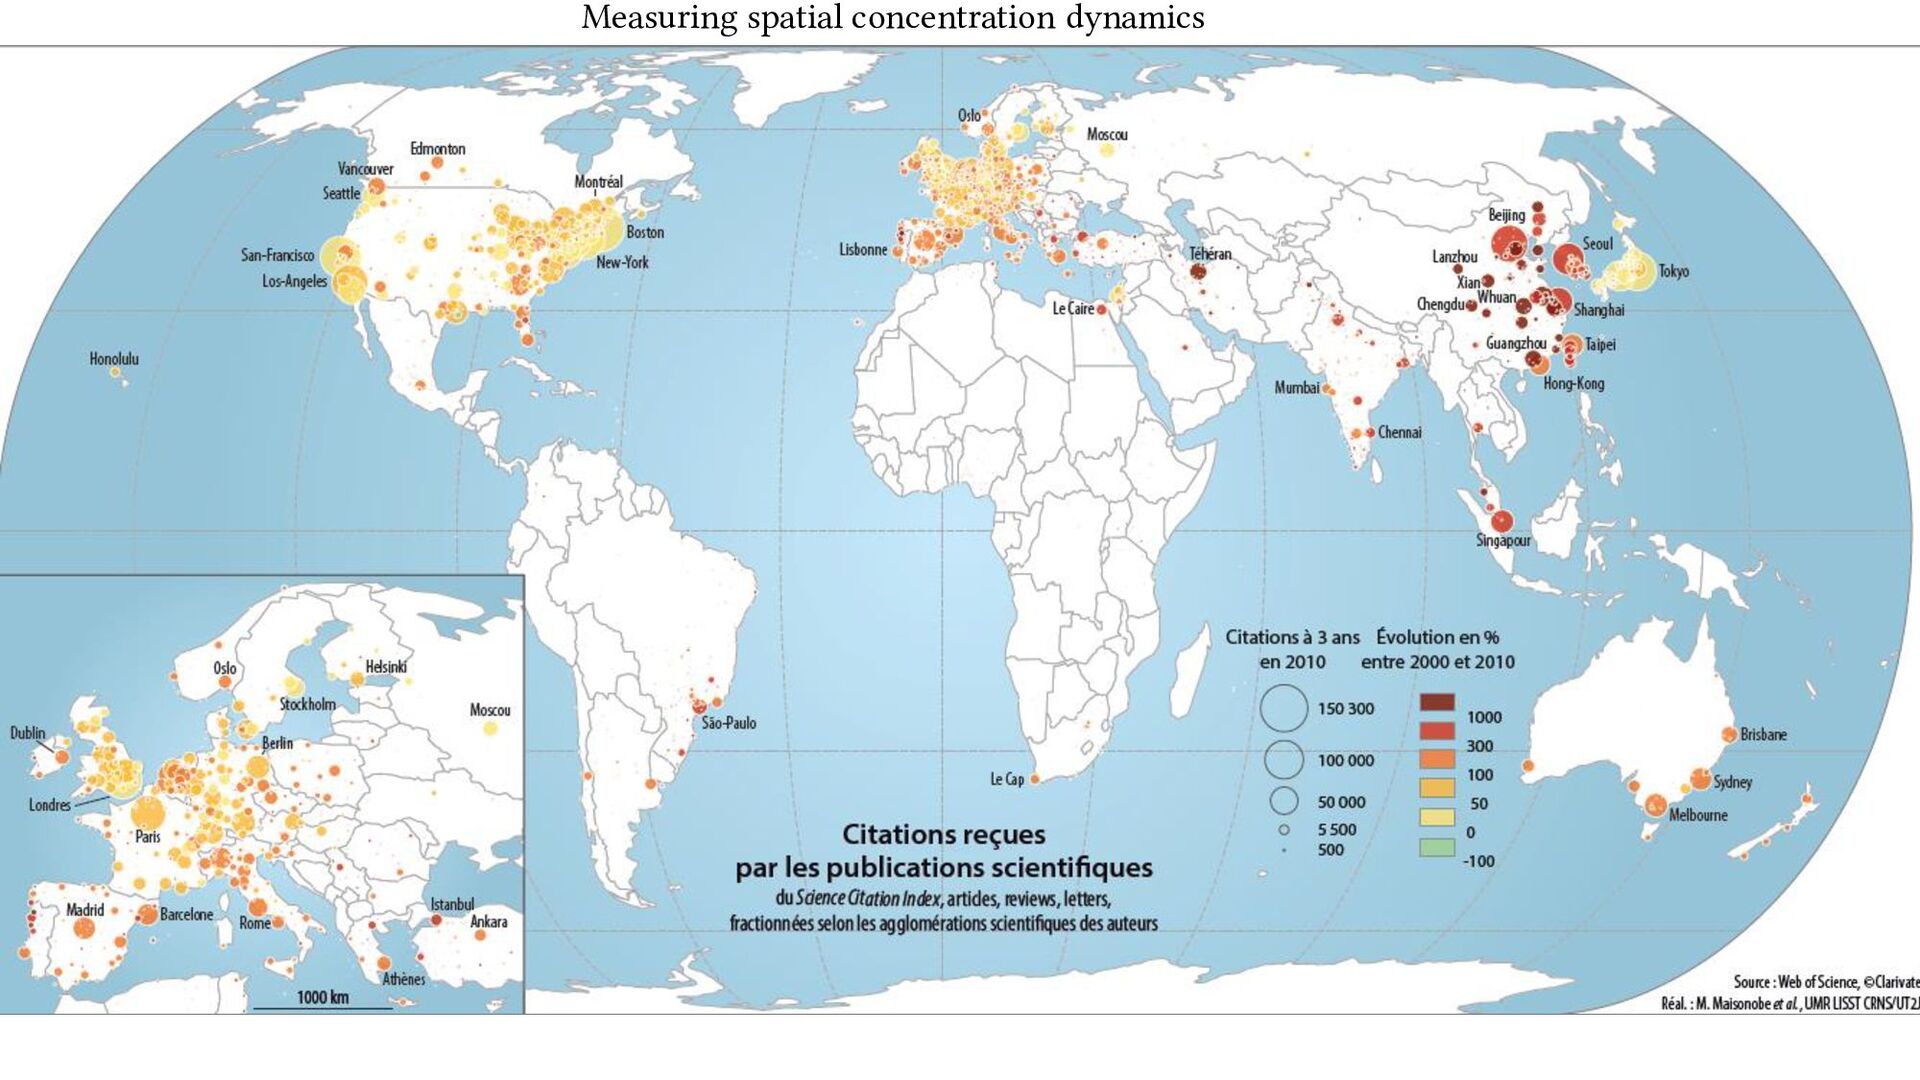
Linkages with Urban Theories, Challenges and Limitations. In Theories and Models of Urbanization: Geography, Economics and Computing Sciences, D. Pumain (Ed.). Springer International Publishing, Cham, 67–96. « More than a simple concentration index » (Finance & Swerts, 2020)
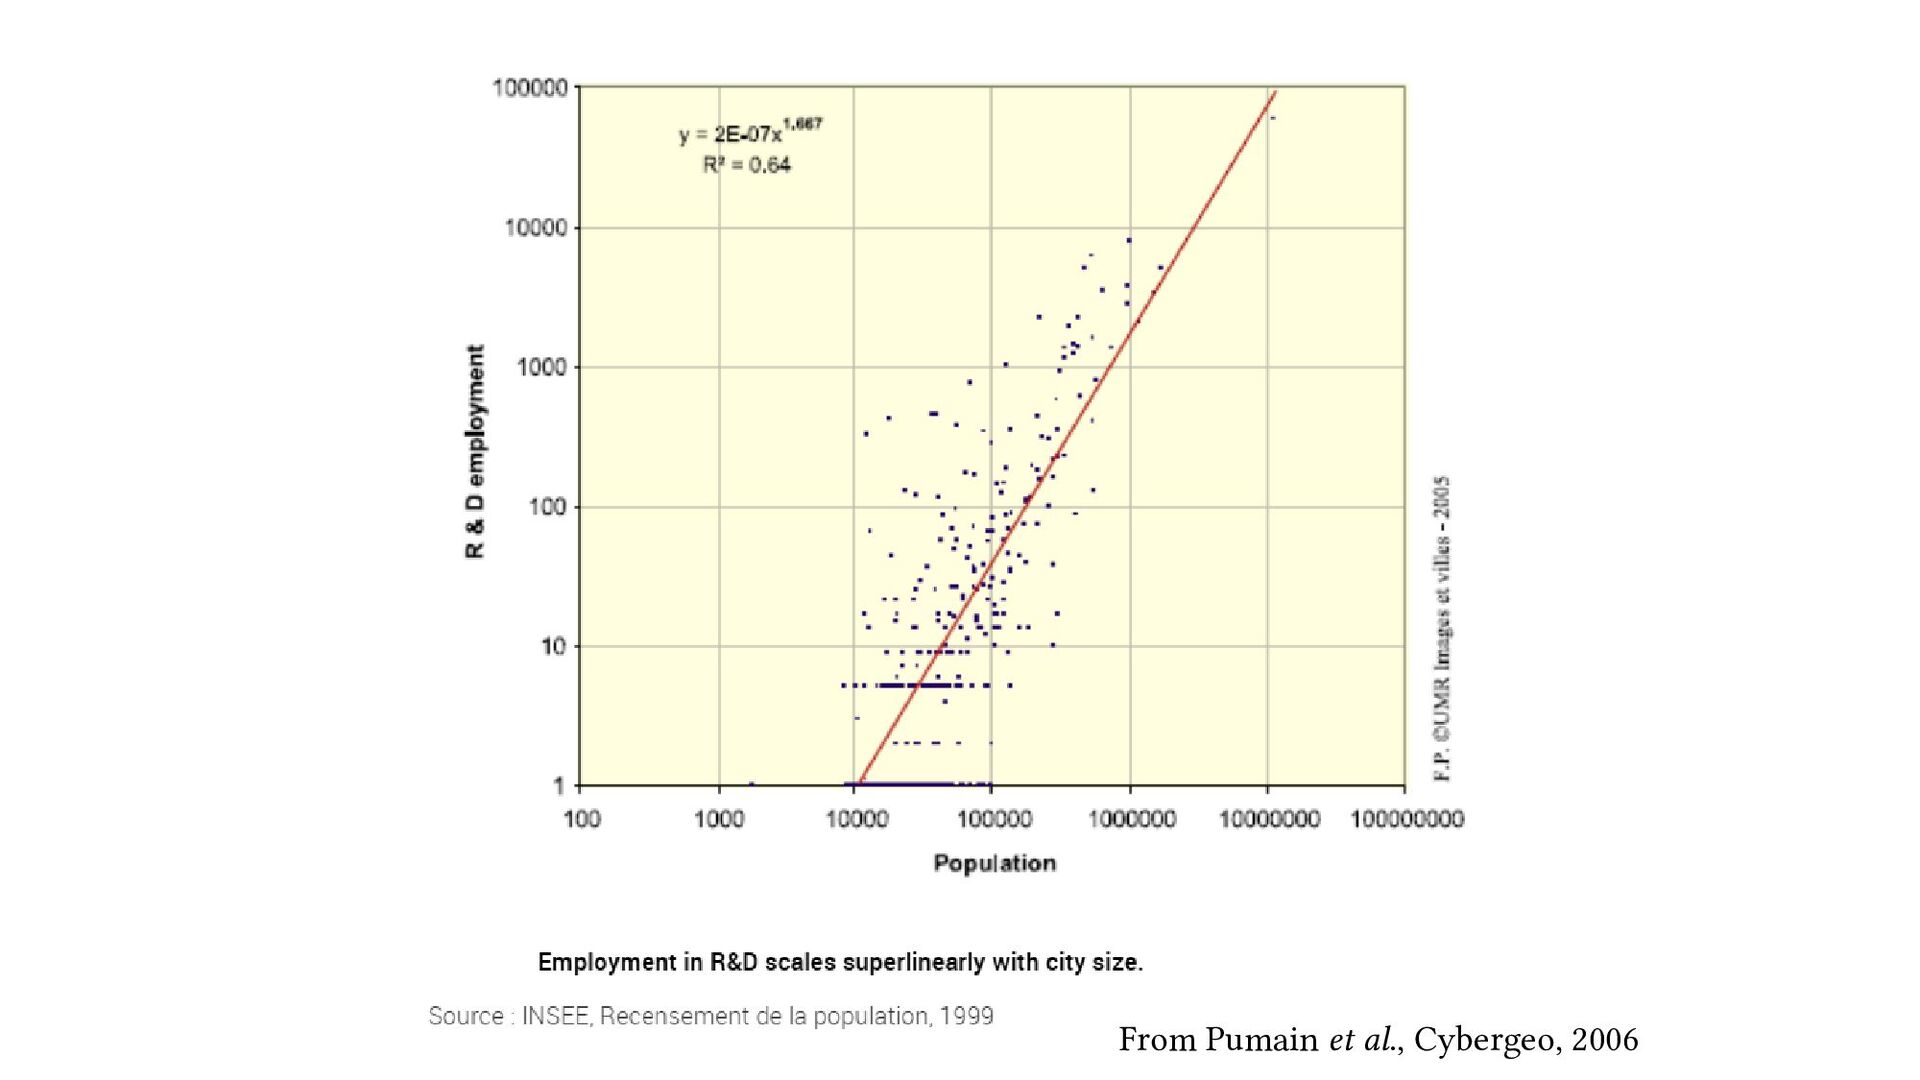
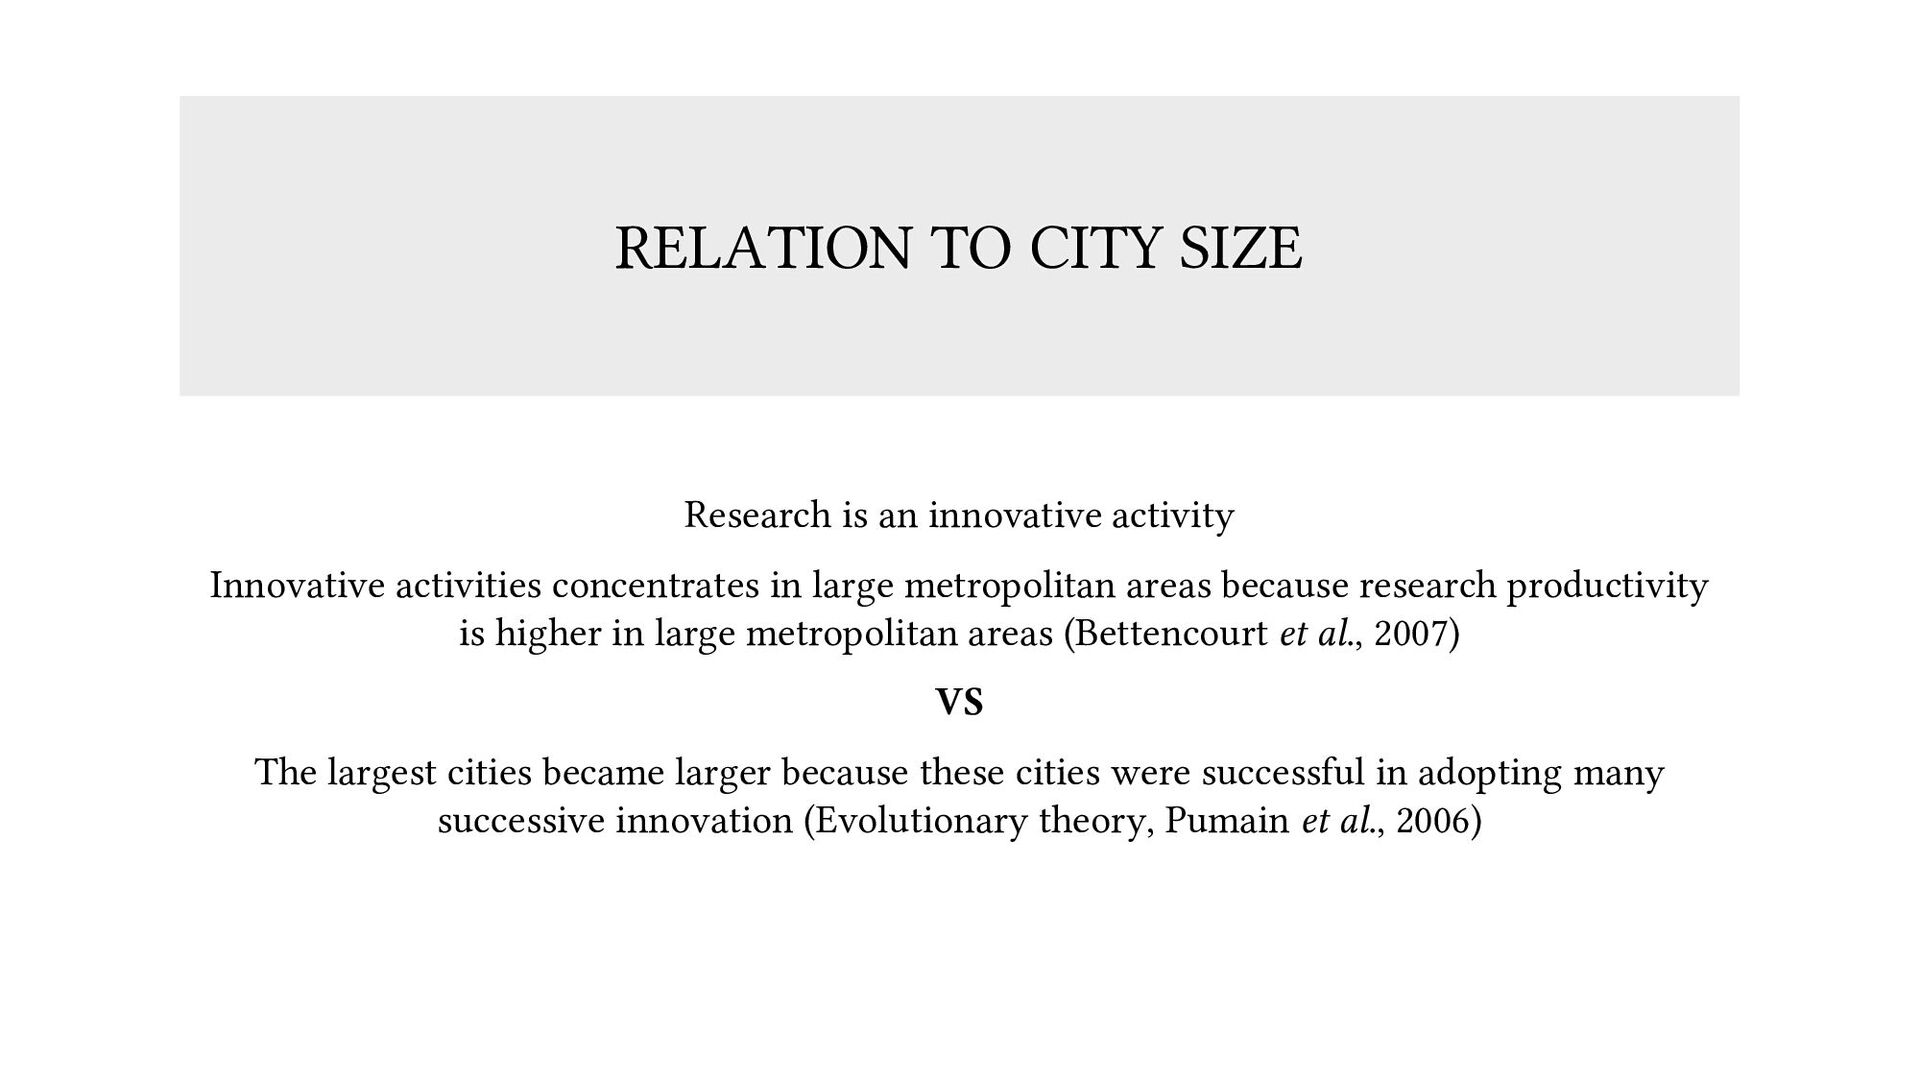
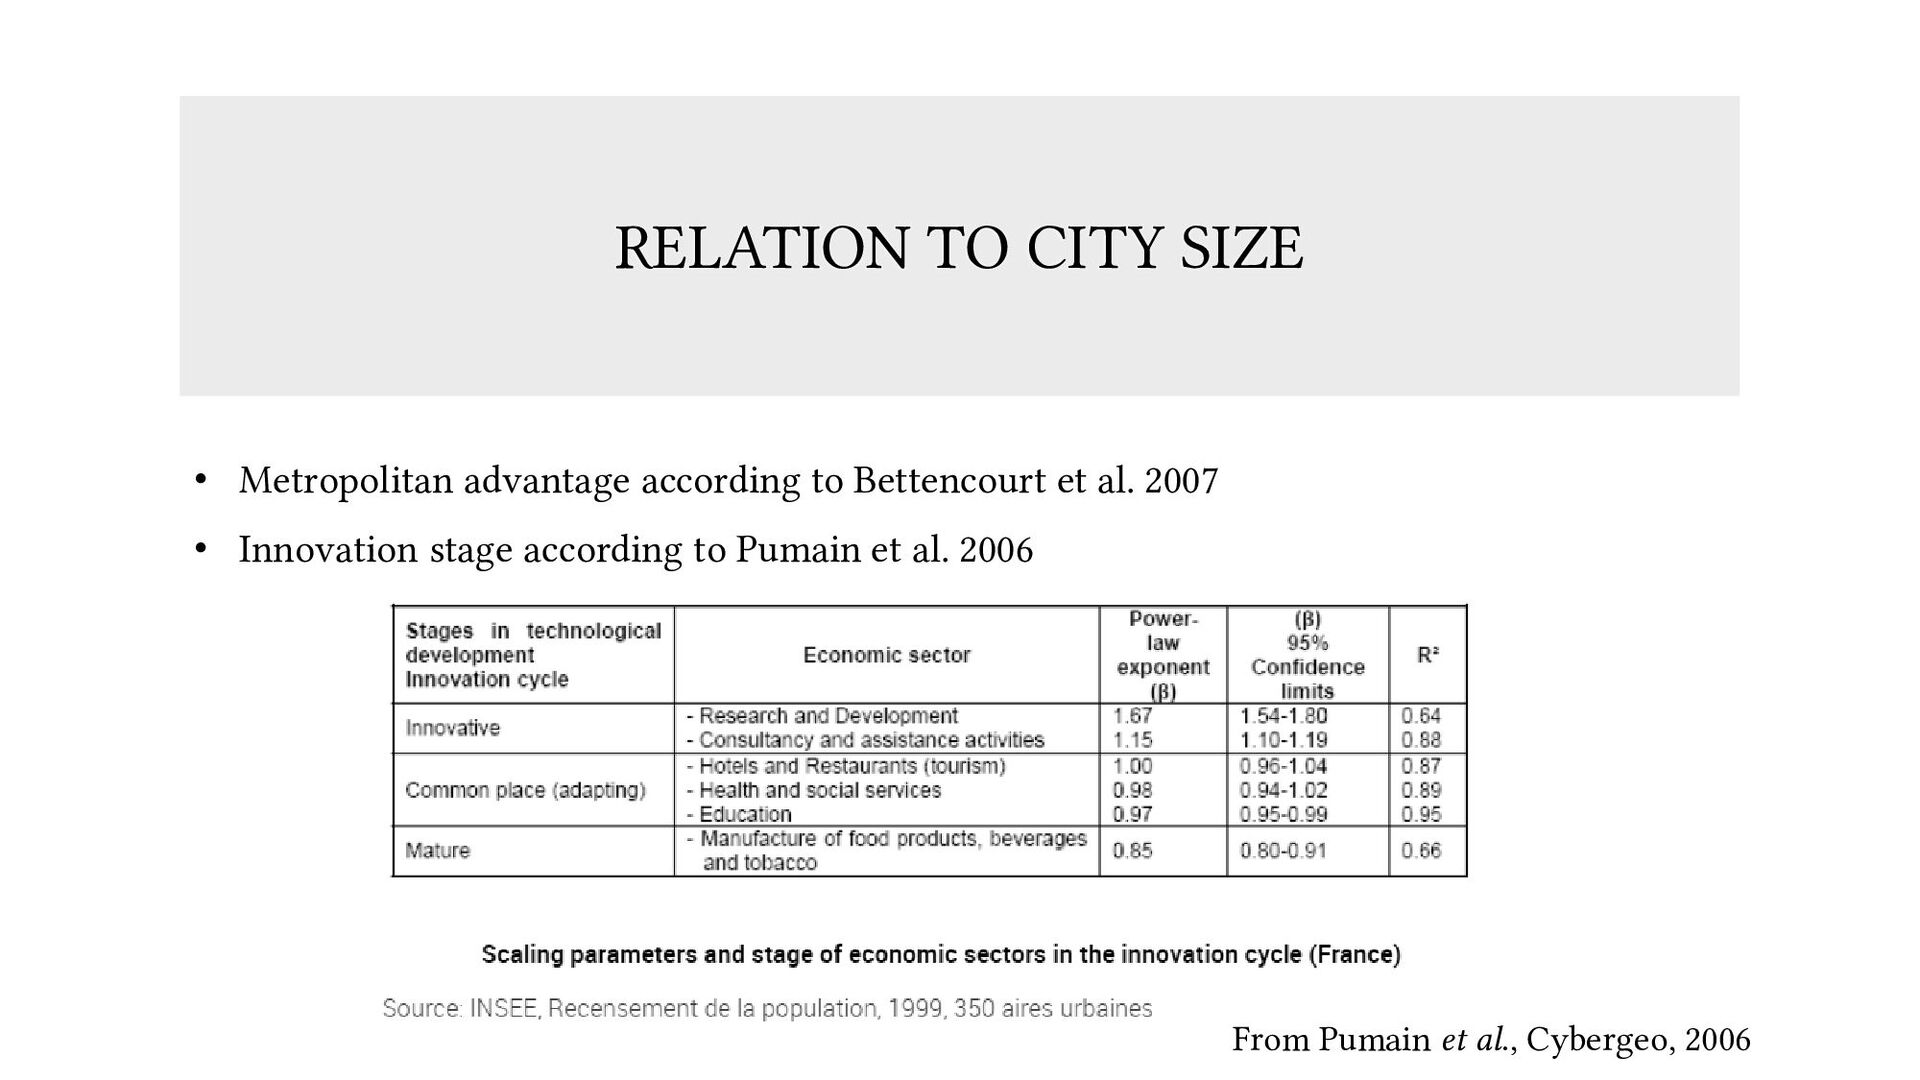
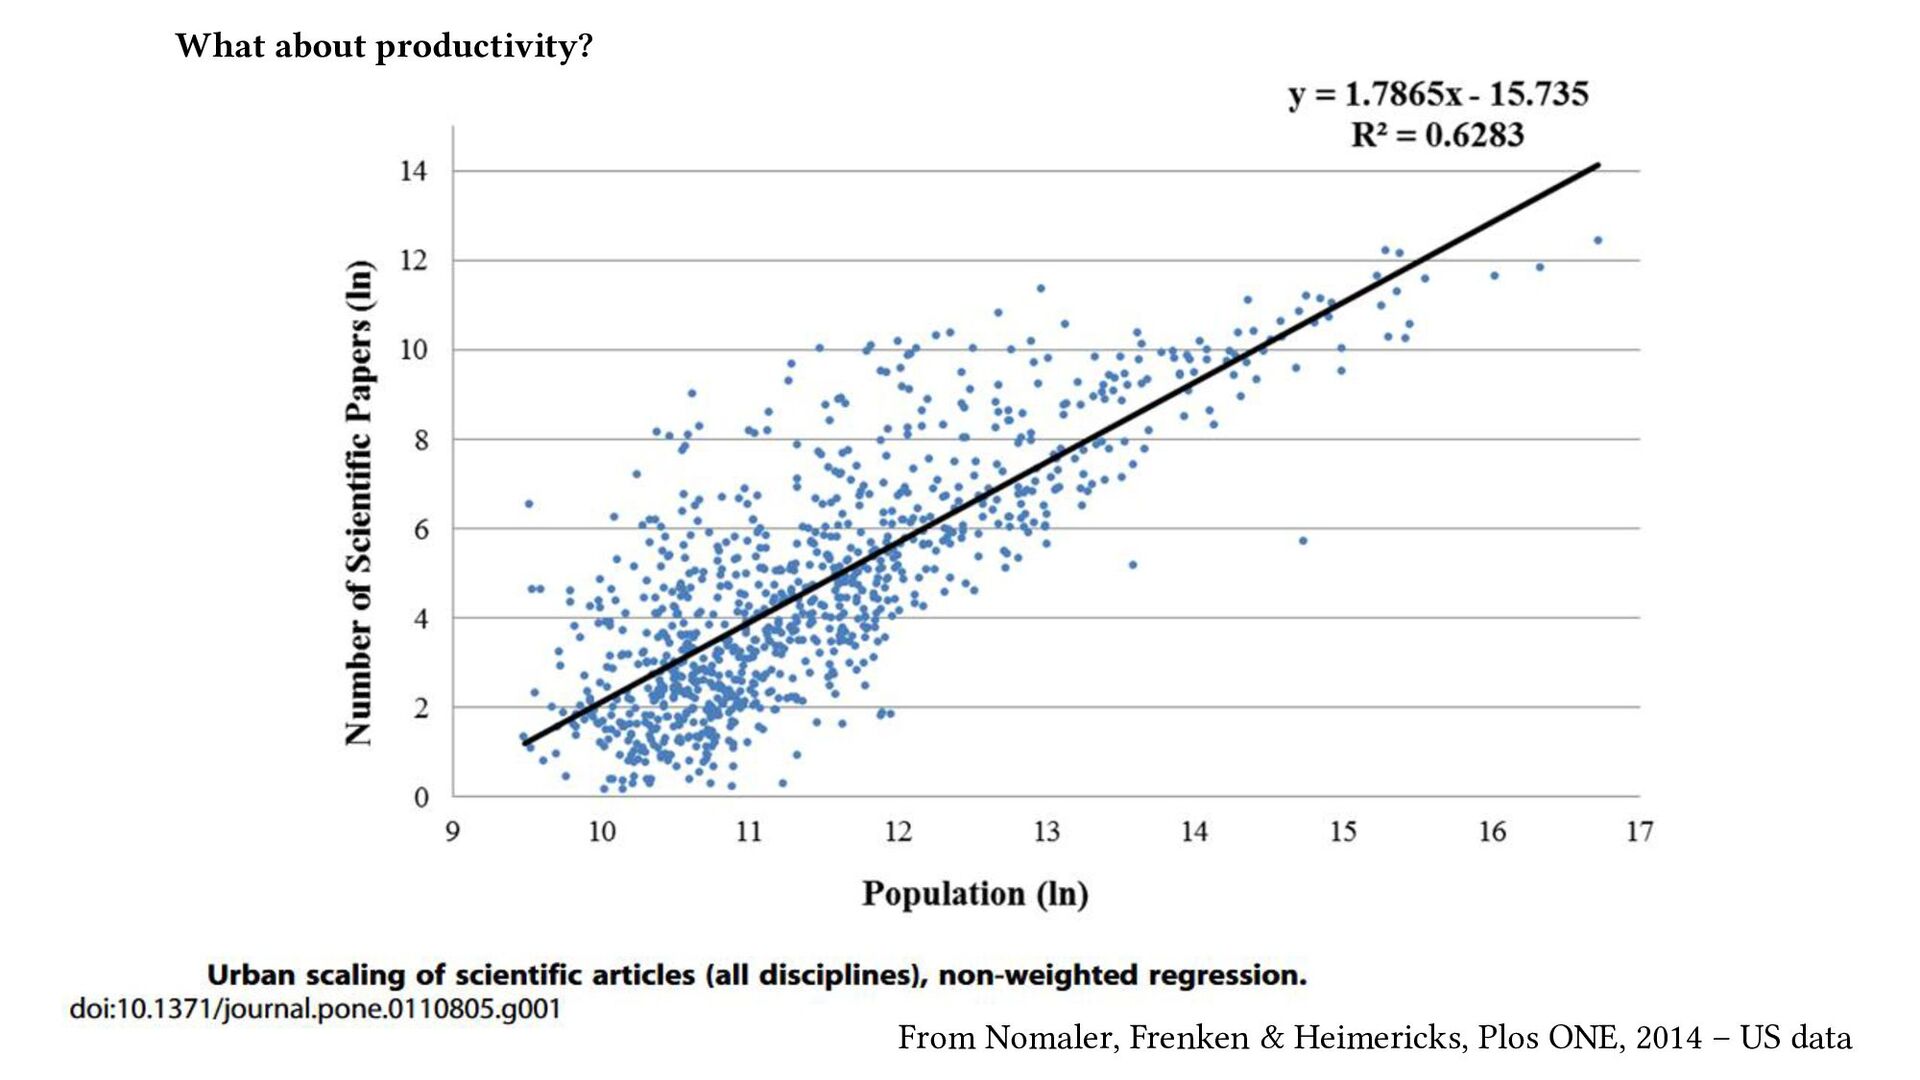
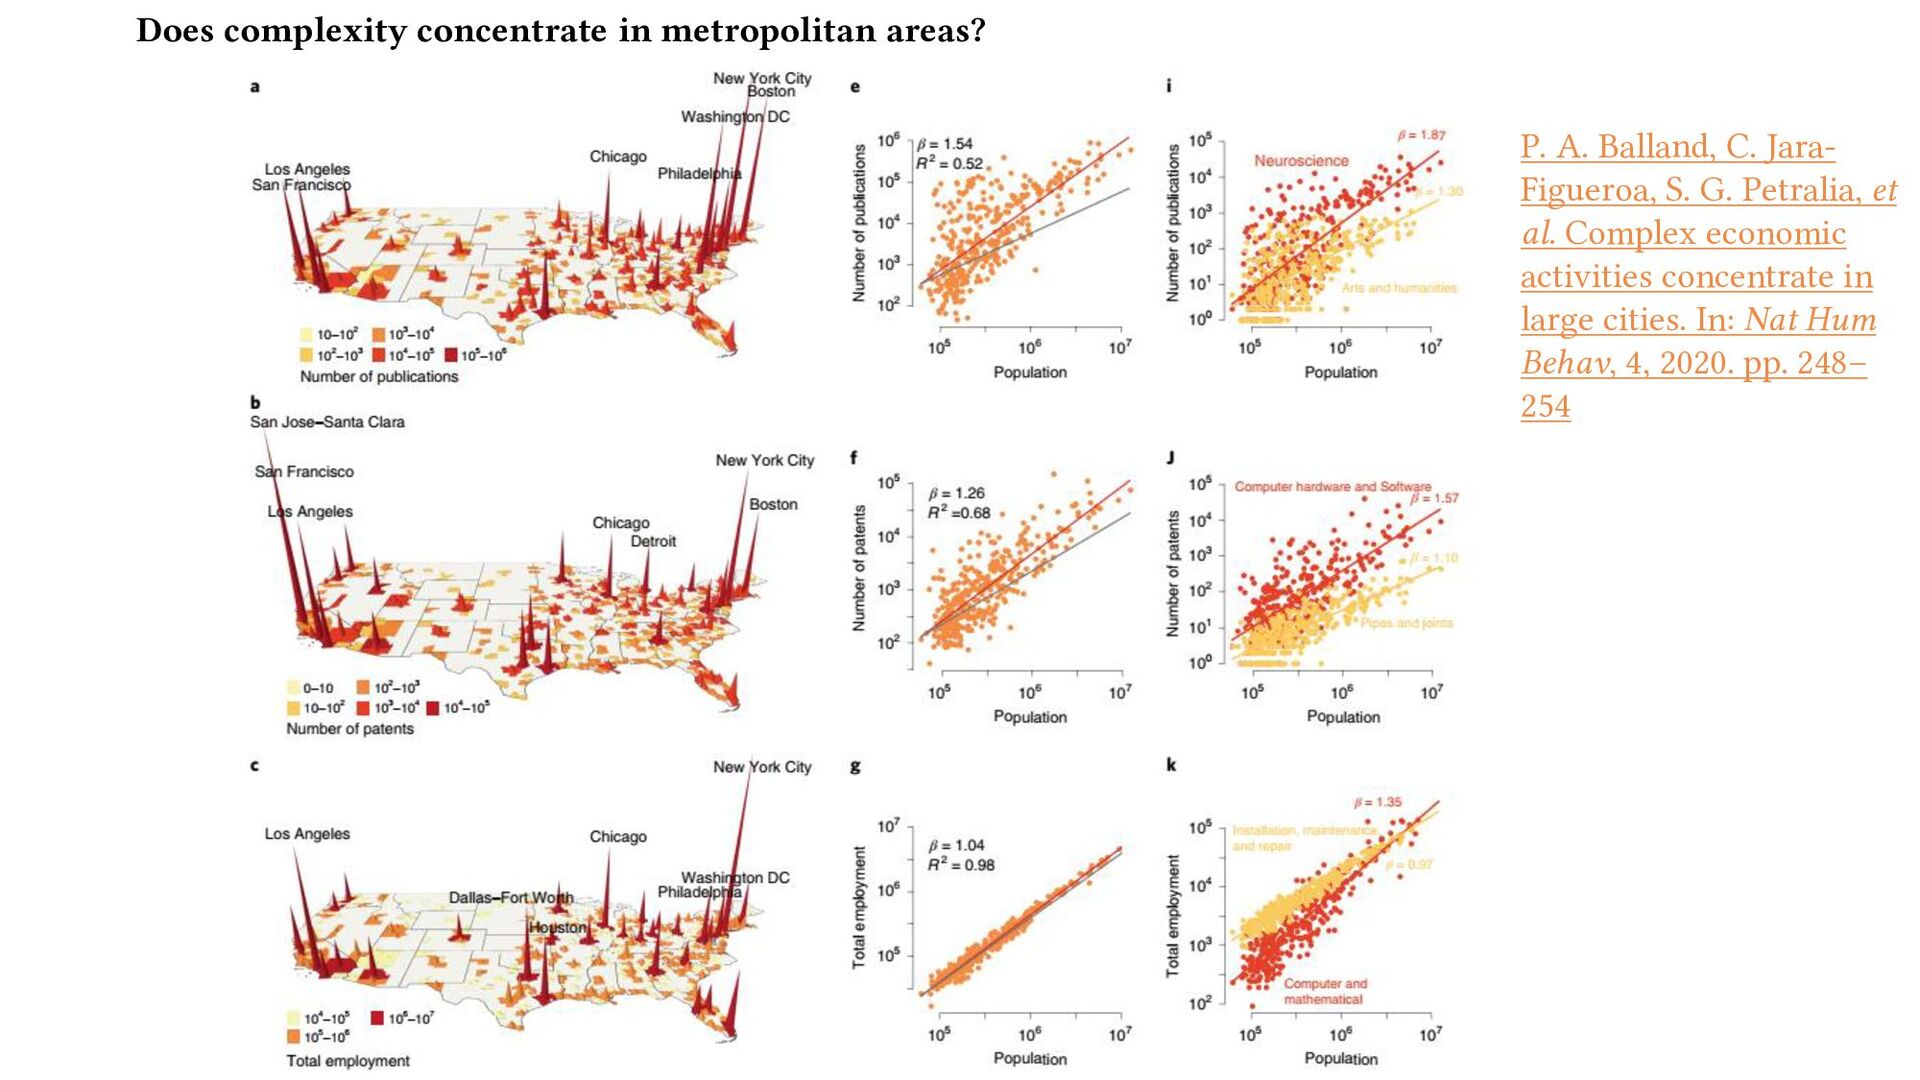
activities concentrates in large metropolitan areas because research productivity is higher in large metropolitan areas (Bettencourt et al., 2007) VS The largest cities became larger because these cities were successful in adopting many successive innovation (Evolutionary theory, Pumain et al., 2006)
include employees in Universities and Hospitals • In France, these employees are classified in « Education » and « Health » sectors • Using publication data can be a way to overcome this limitation • Using publication data also enables to test the relation between productivity per capita and population size of cities
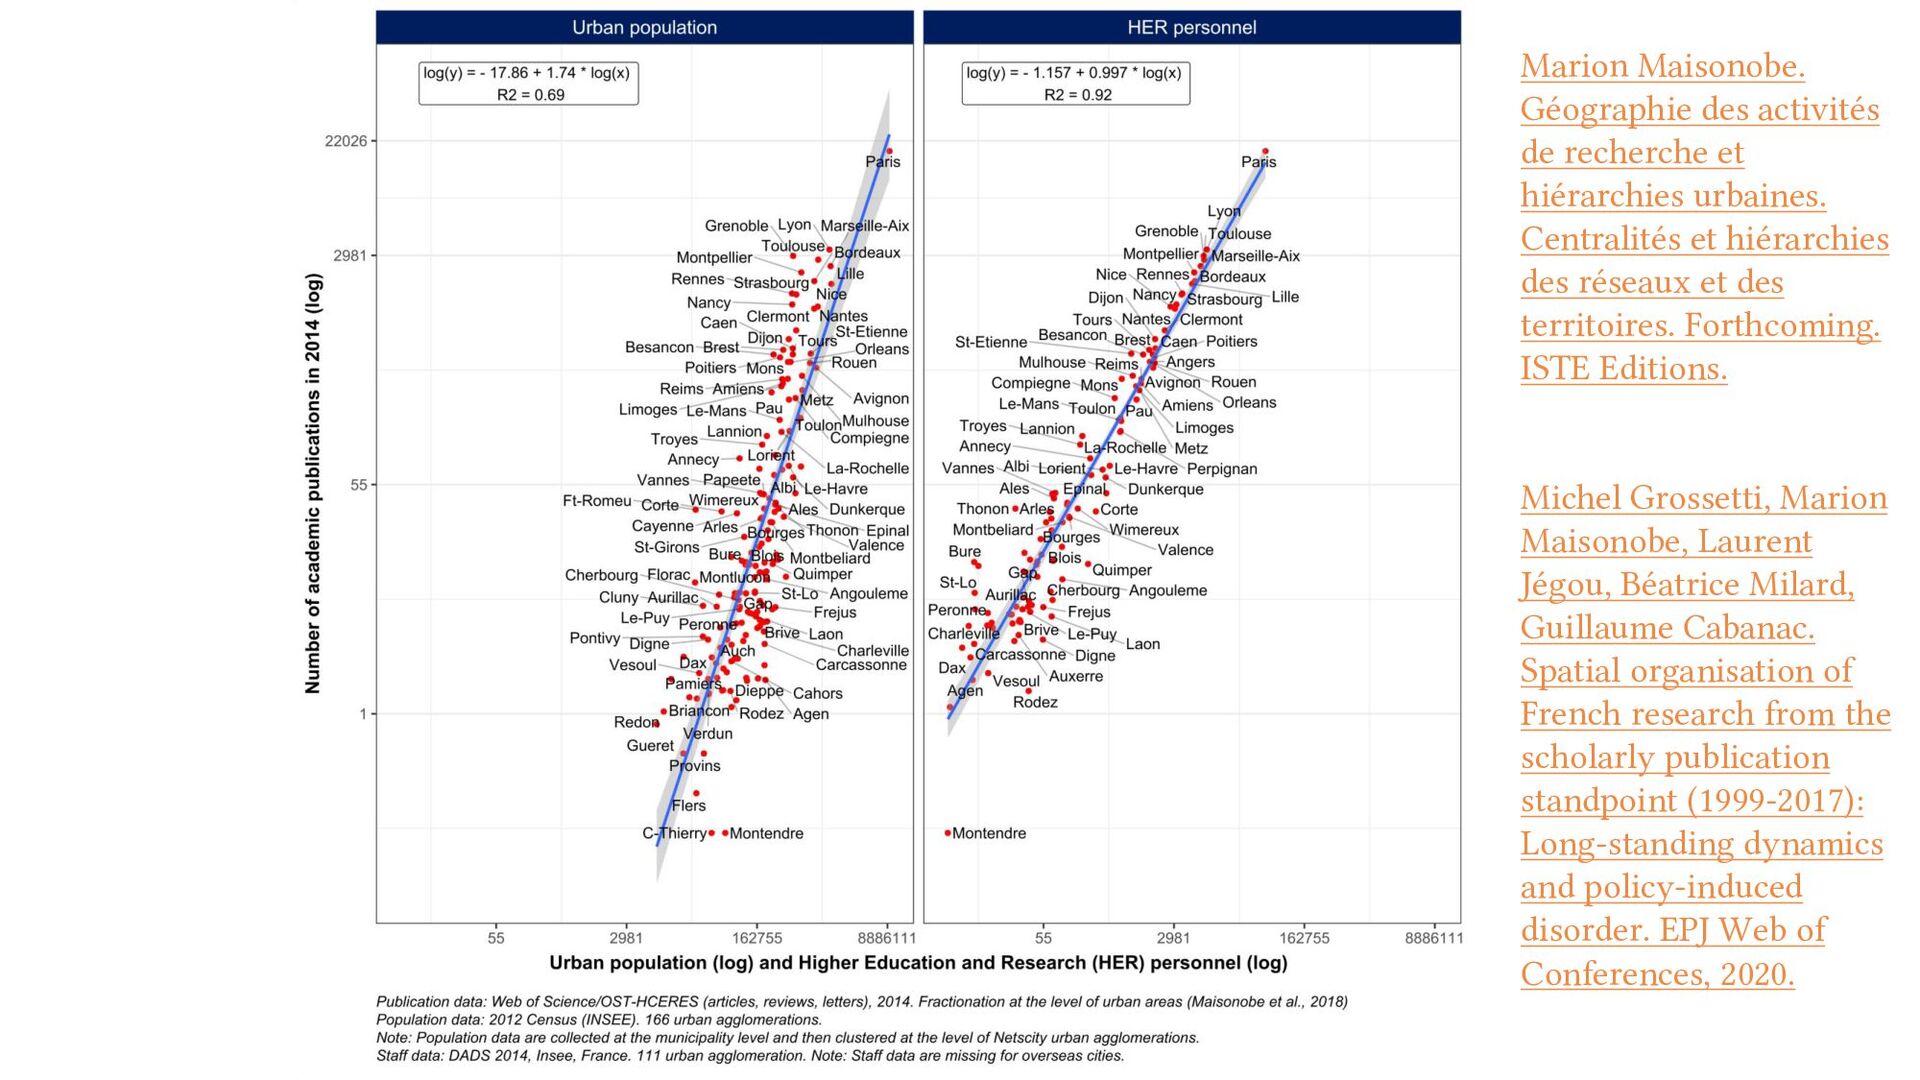
Centralités et hiérarchies des réseaux et des territoires. Forthcoming. ISTE Editions. Michel Grossetti, Marion Maisonobe, Laurent Jégou, Béatrice Milard, Guillaume Cabanac. Spatial organisation of French research from the scholarly publication standpoint (1999-2017): Long-standing dynamics and policy-induced disorder. EPJ Web of Conferences, 2020.
Research in France • «The distribution of researchers in higher education, because it is globally linked to that of students (correlation coefficient of 0.995!), is increasingly modelled on the upper level of the French urban structure. » (Brocard, 1991, p.73) ; • During the 1990s, «higher education facilities tended to become as widespread as the facilities in which compulsory education is completed » so that in the late 2000s, « all major complete higher education hubs are less than two hours' drive from other centres in their region or neighbouring regions» (Baron, 2010). Madeleine Brocard. La science et les régions : géoscopie de la France. In: RECLUS-La Documentation Française. 1991. ; Myriam Baron. Les transformations de la carte universitaire depuis les années 1960 : constats et enjeux. In: Le Mouvement Social, vol. 233, no. 4, 2010. pp. 93-105
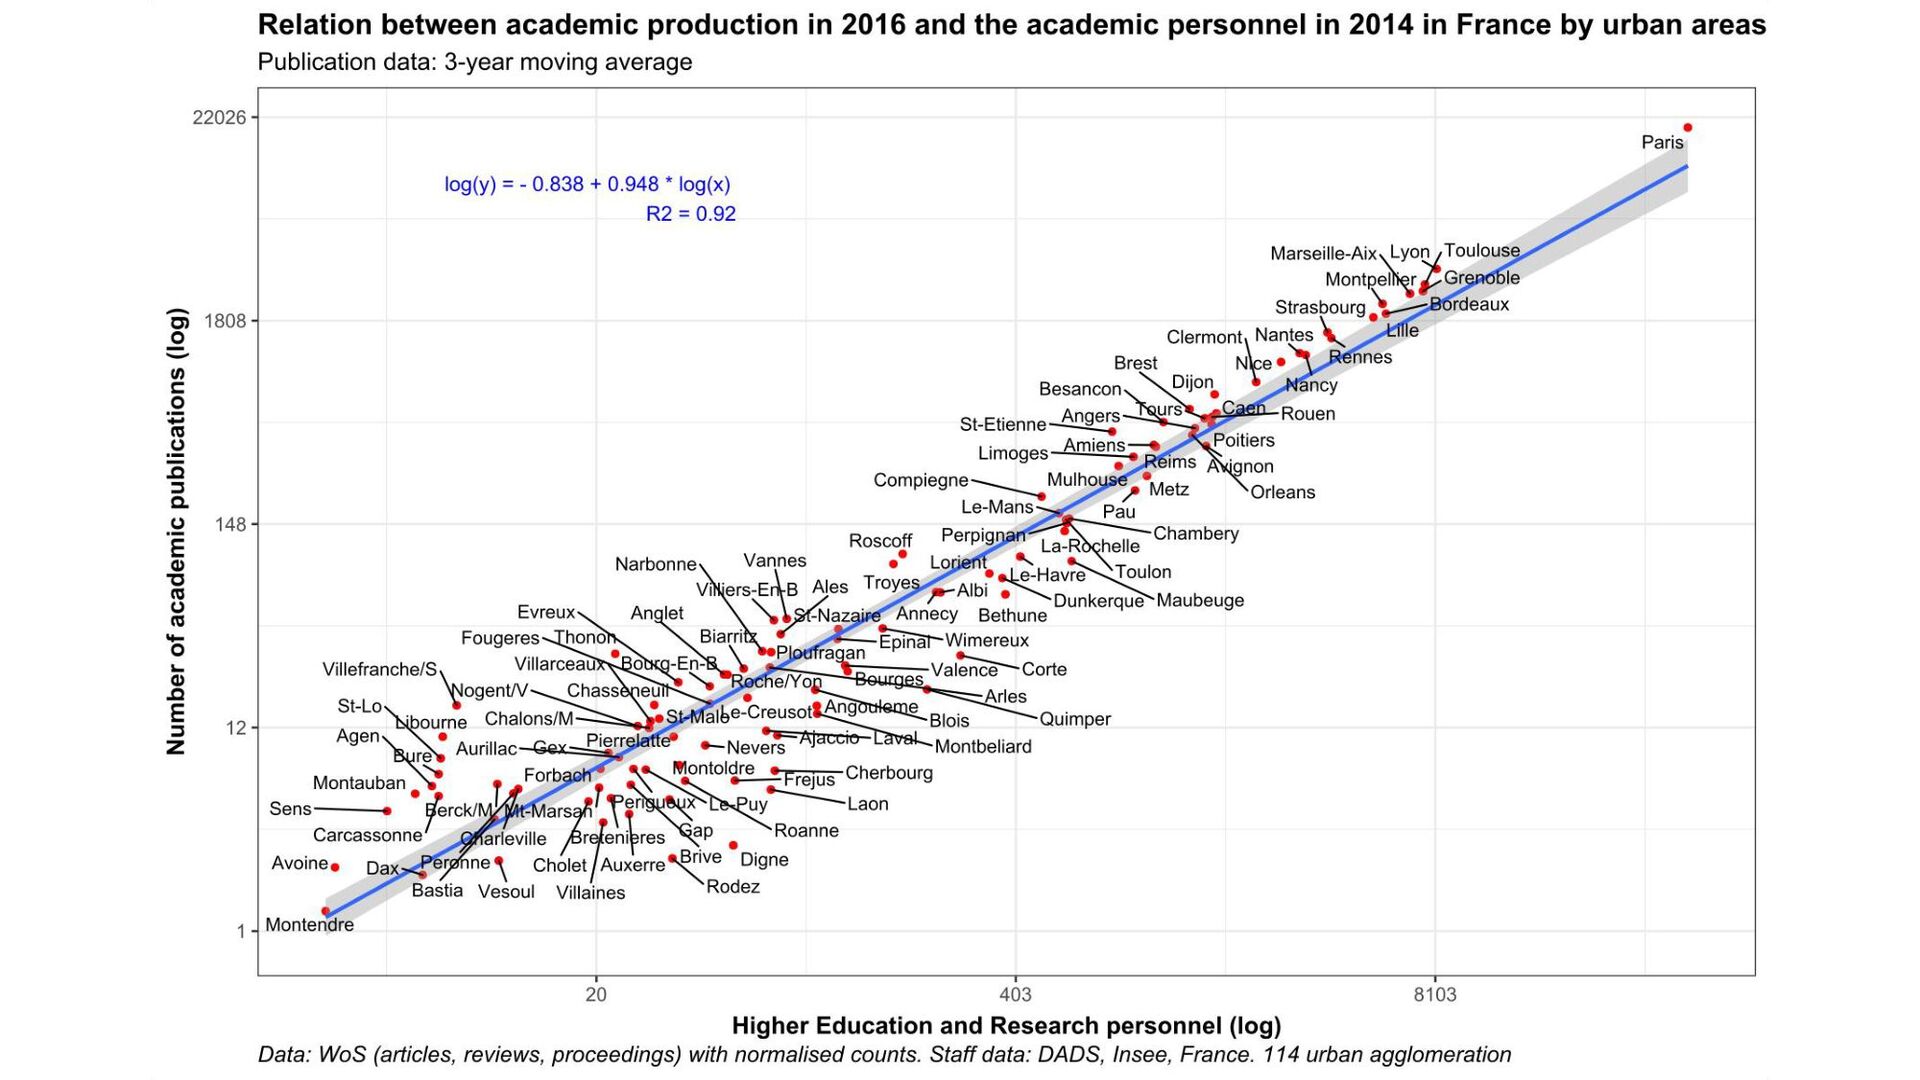
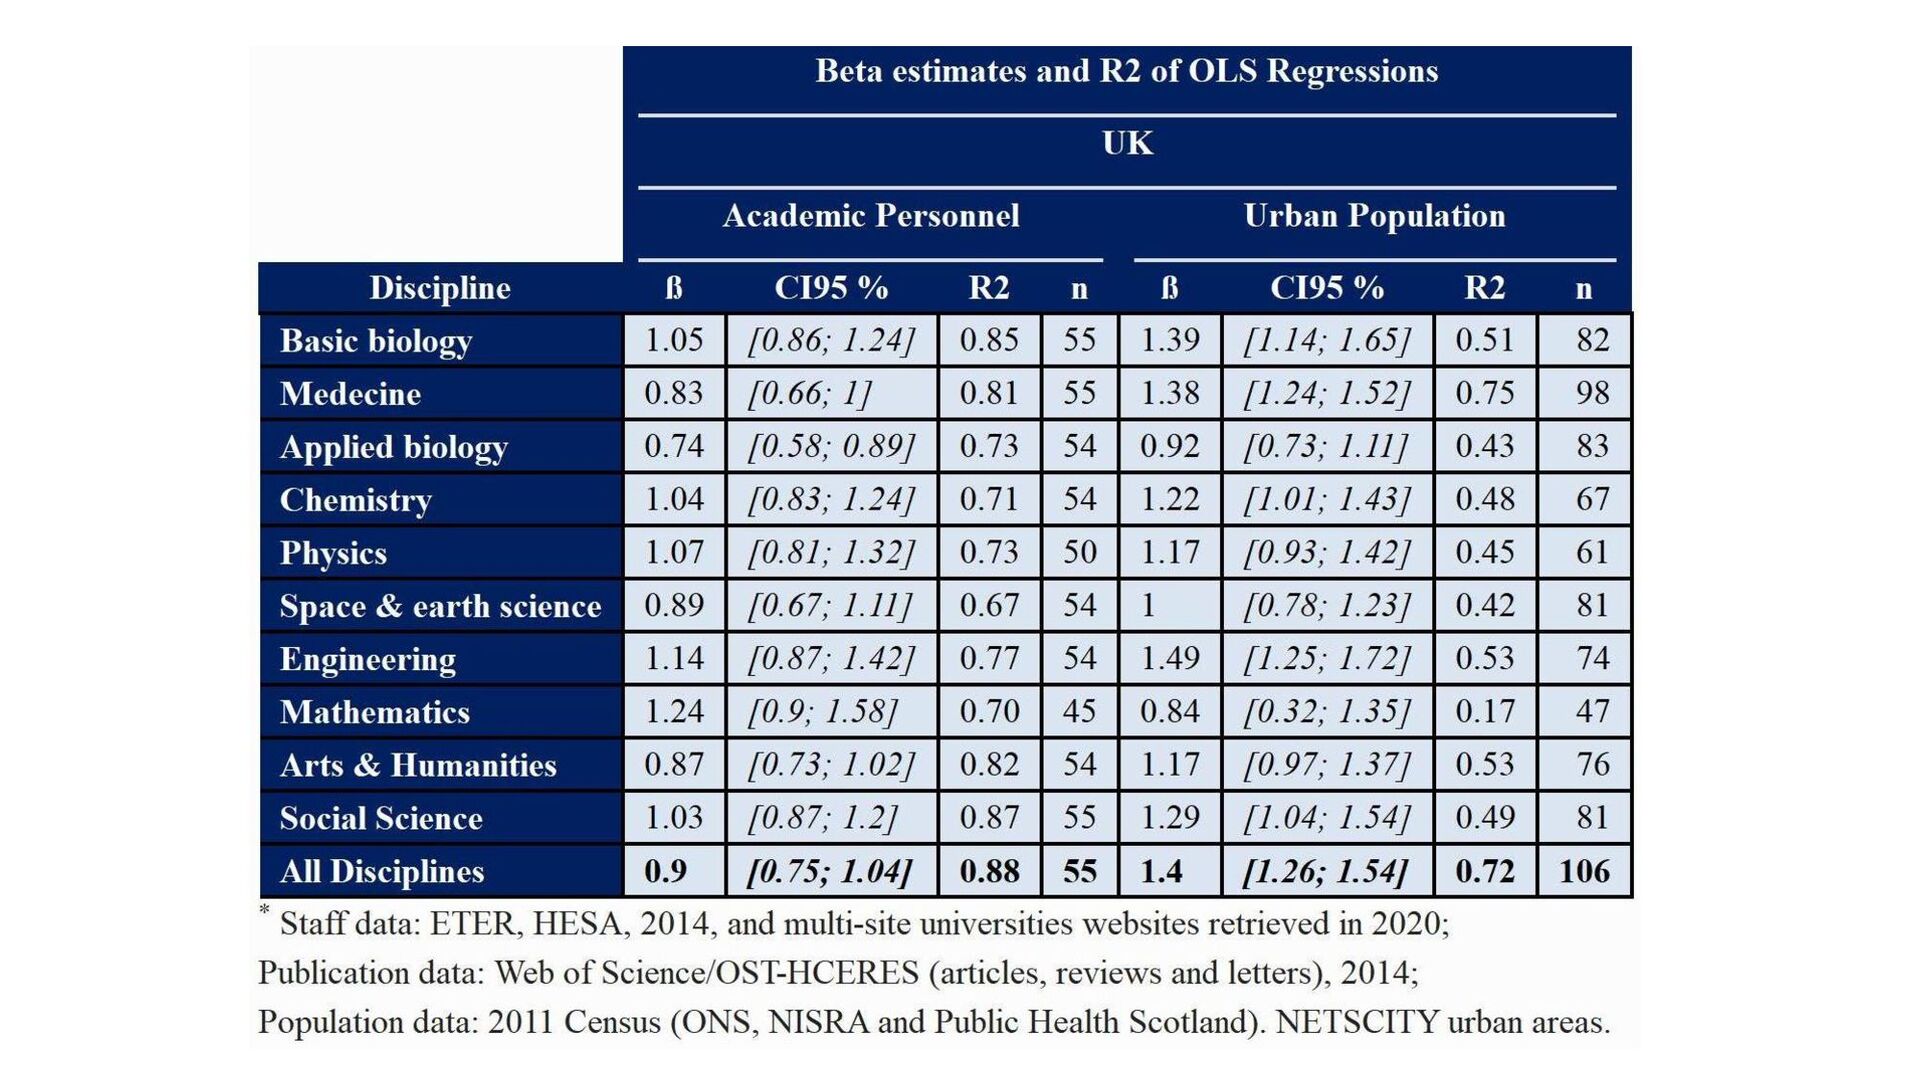
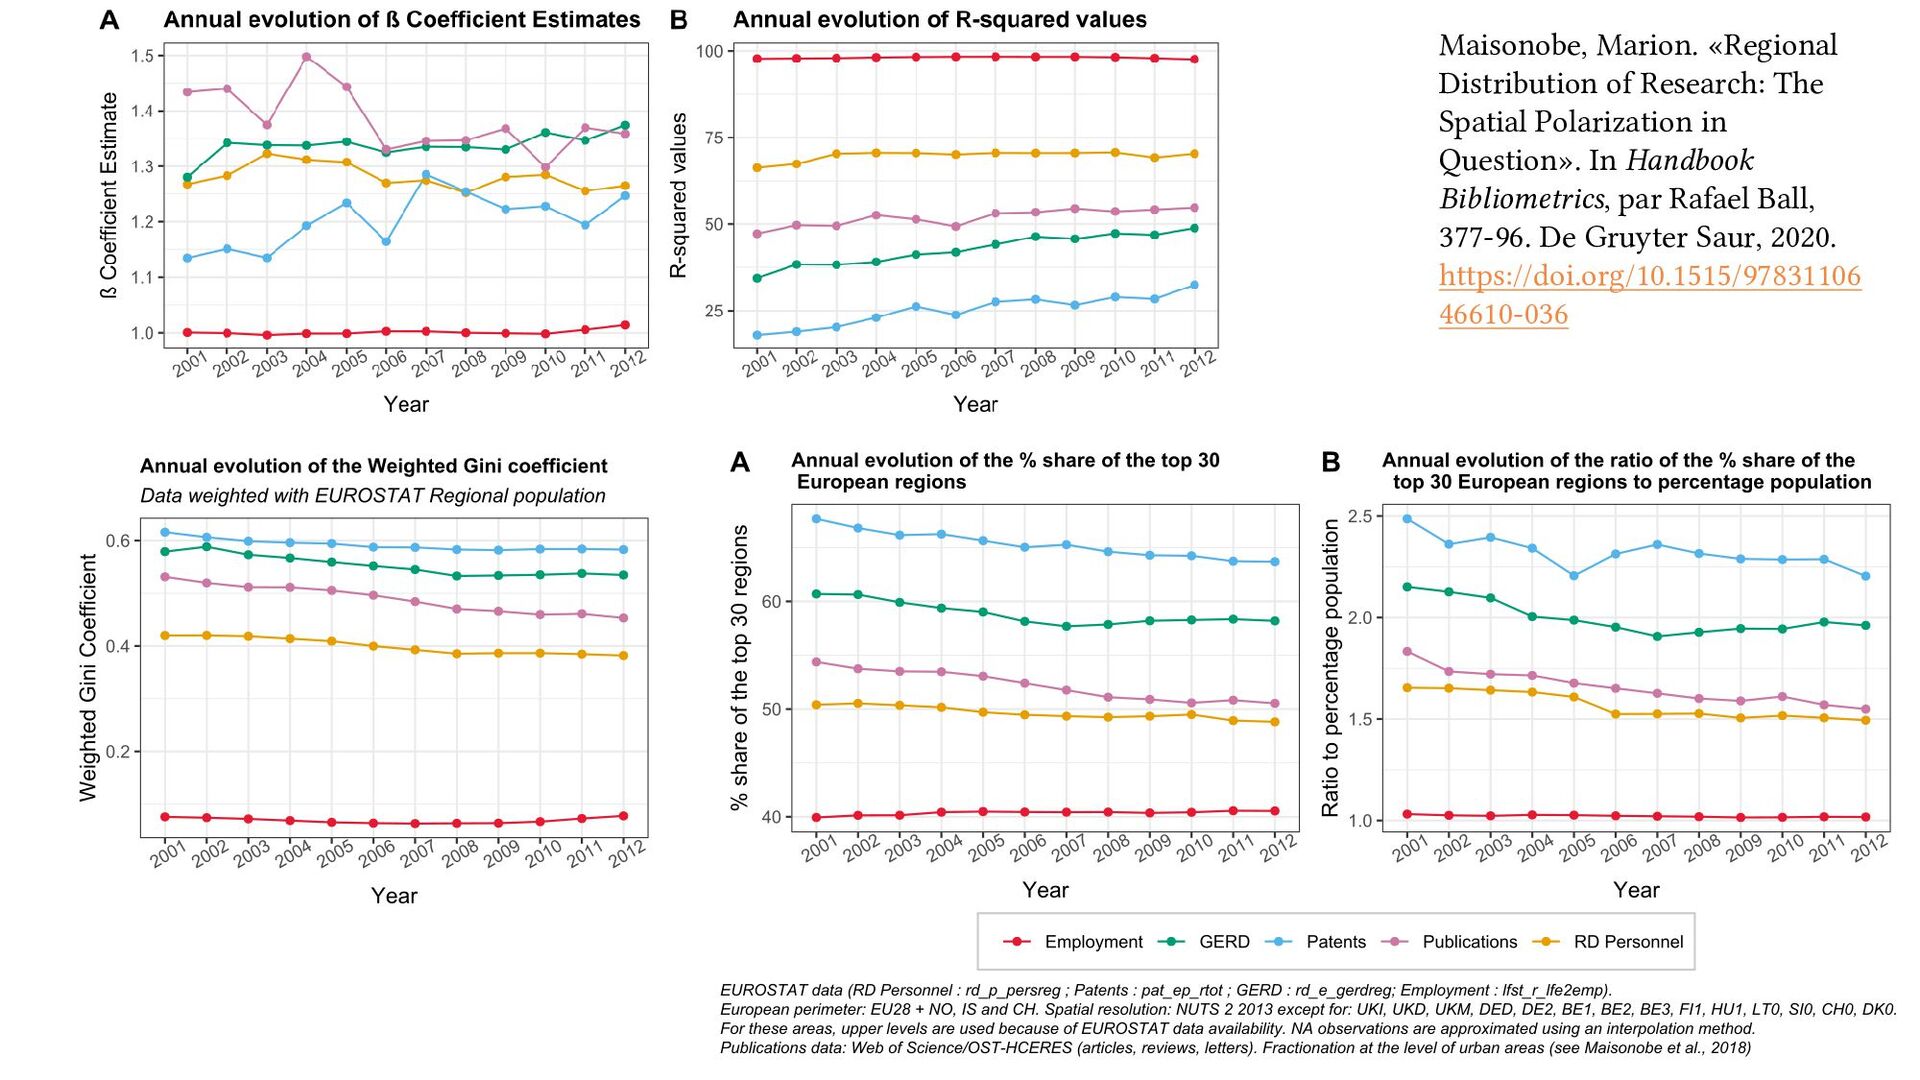
of University Alliance (2009 & 2011), we found no evidence of a size effect regarding the spatial distribution of scientific activities between urban areas (Grossetti et al., 2015, Handbook of geographies of innovation) • The spatial distribution of academics explains the spatial distribution of scientific activity (volume of publications per urban area) : • In France with a very good R2 (95%) - Grossetti et al., 2020 • In the UK with a very good R2 (88%) - Maisonobe, forthcoming → Agglomeration perimeters shared in Maisonobe, Jégou & Eckert, 2018, Cybergeo
al. Complex economic activities concentrate in large cities. In: Nat Hum Behav, 4, 2020. pp. 248– 254 Does complexity concentrate in metropolitan areas?
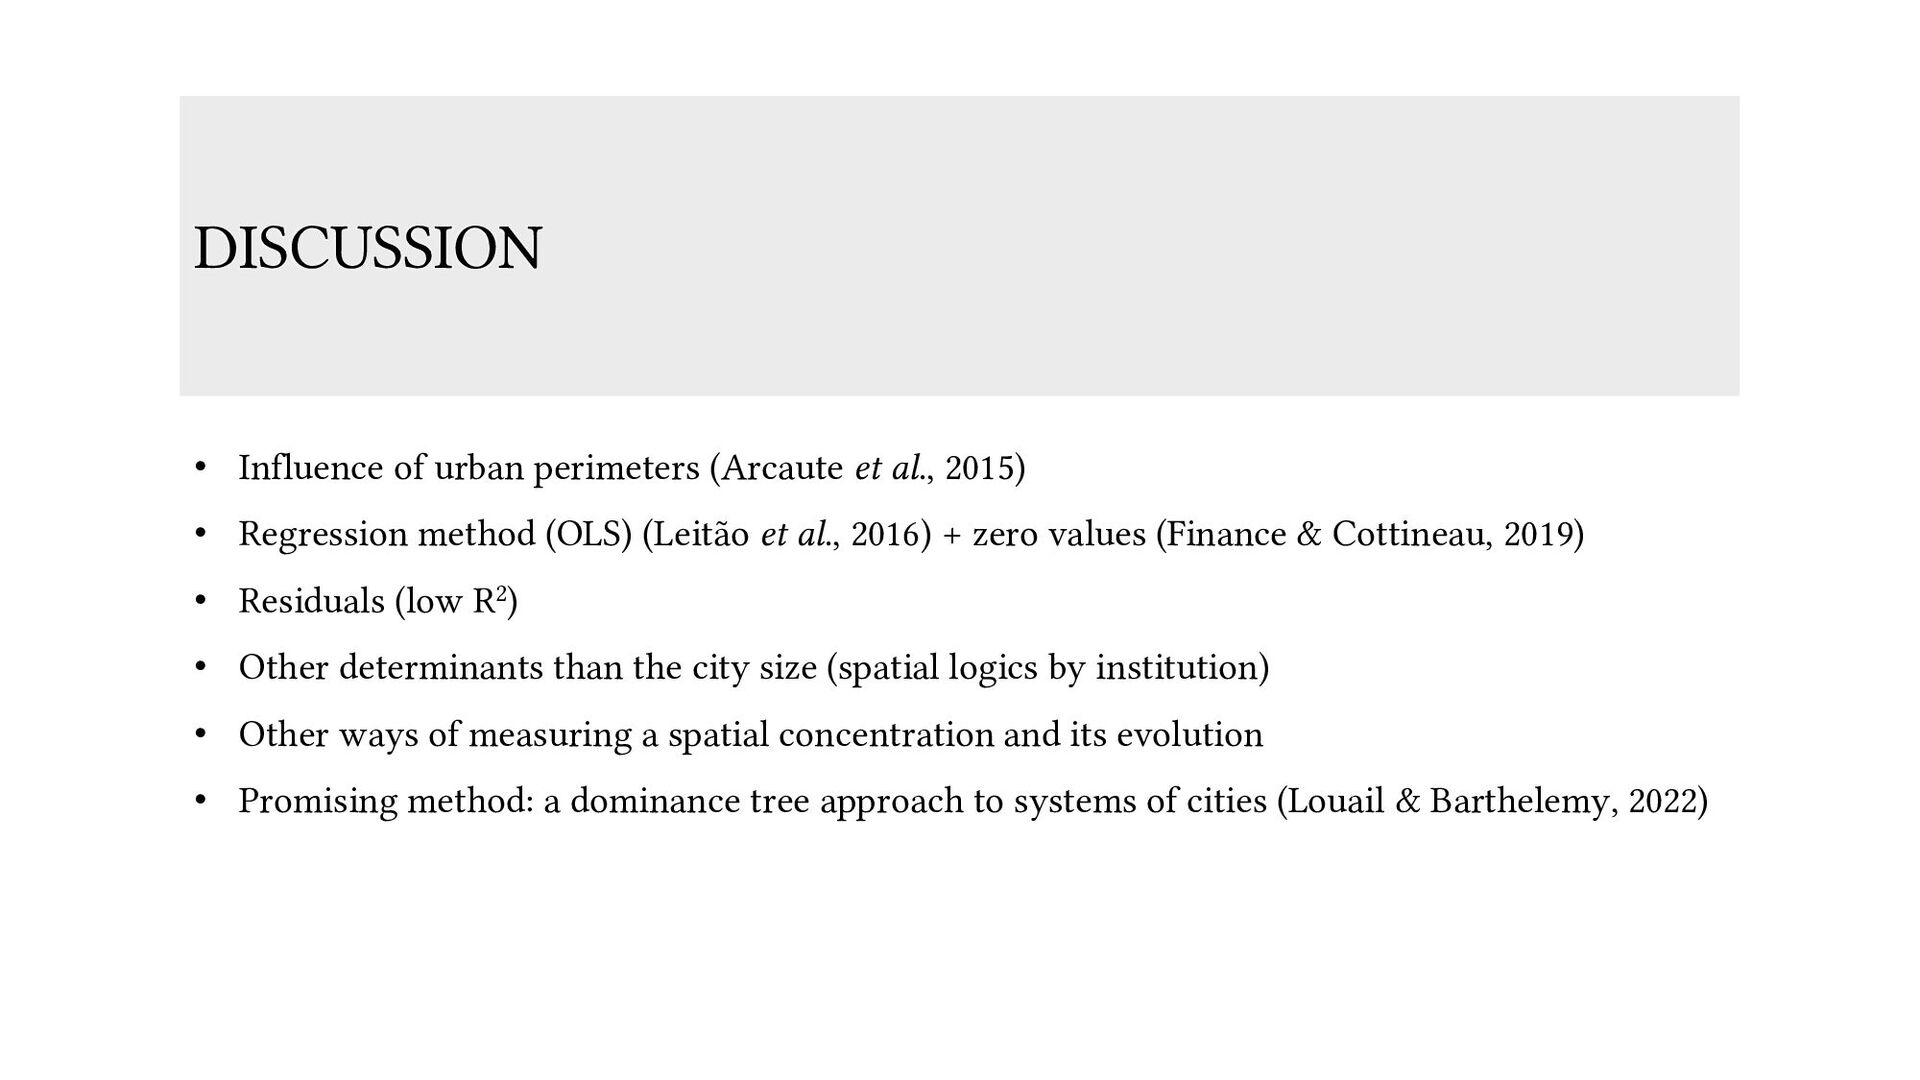
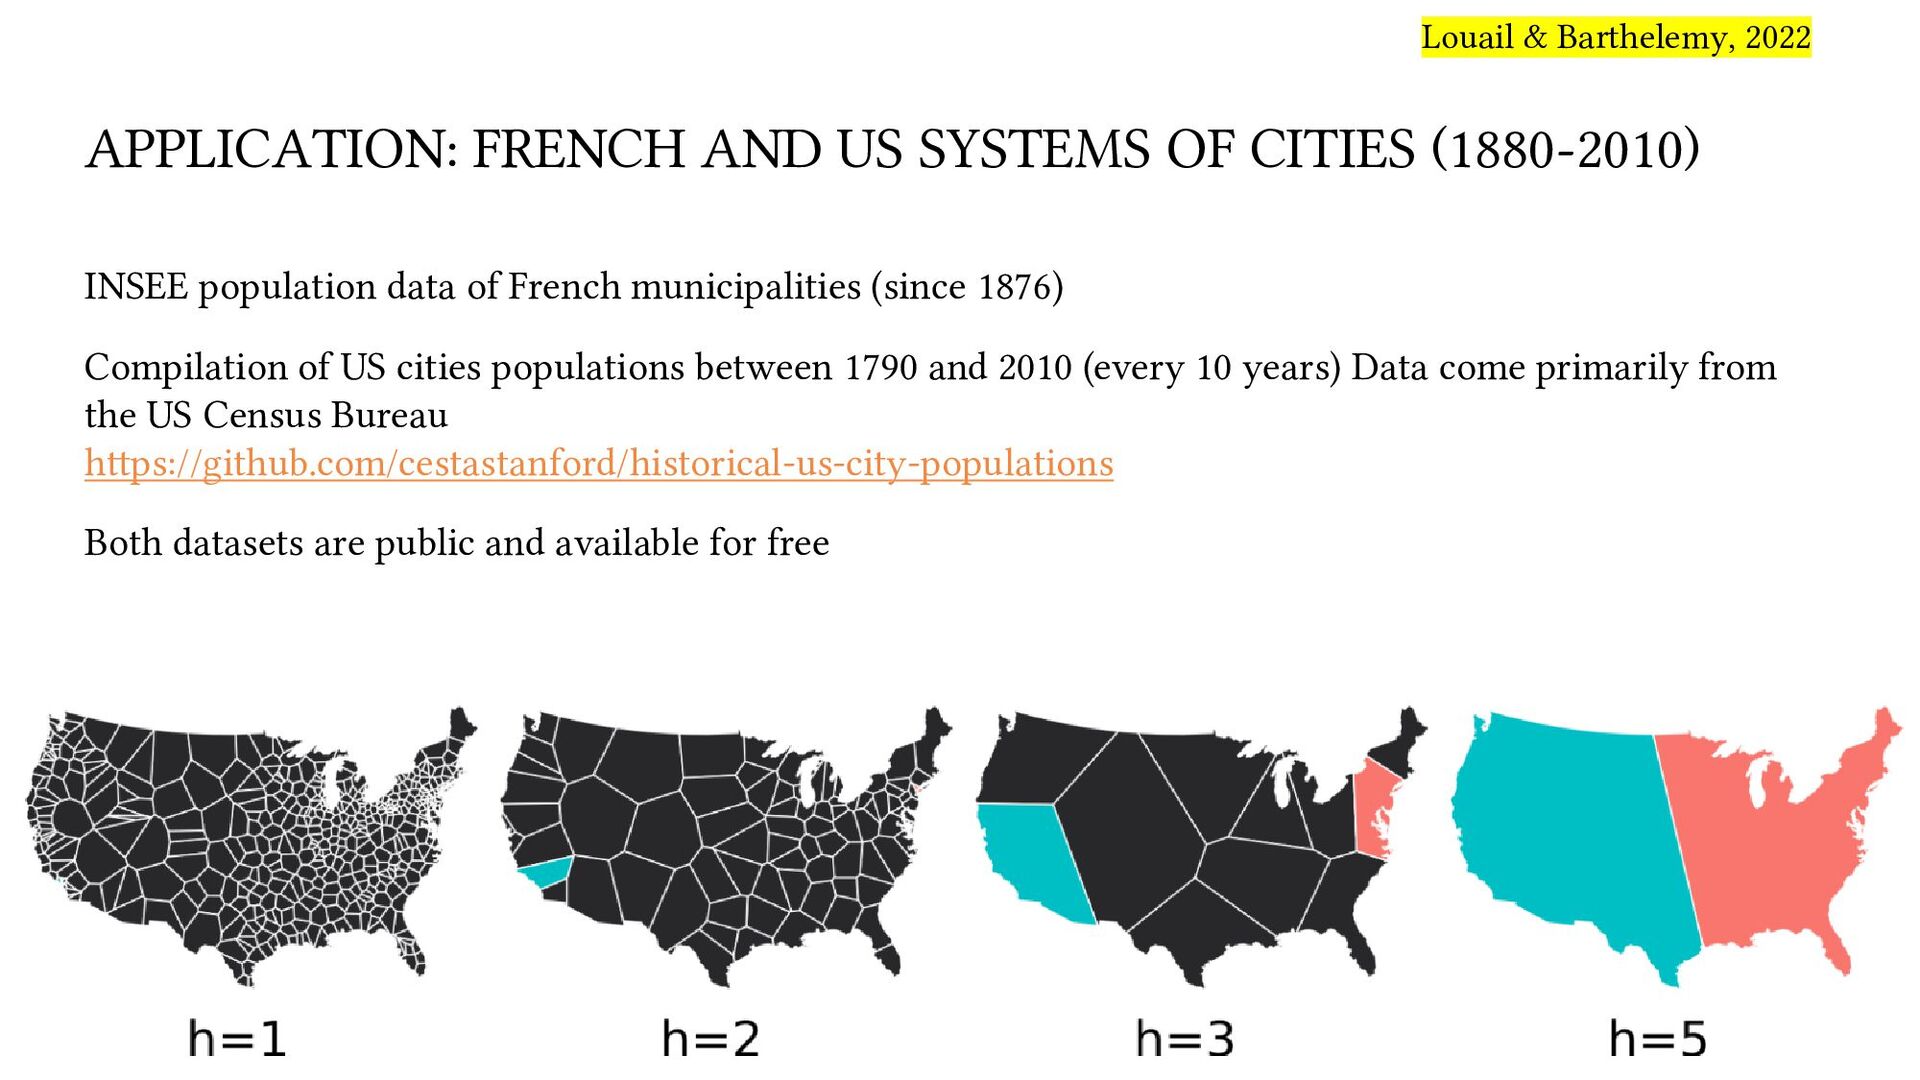
• Regression method (OLS) (Leitão et al., 2016) + zero values (Finance & Cottineau, 2019) • Residuals (low R2) • Other determinants than the city size (spatial logics by institution) • Other ways of measuring a spatial concentration and its evolution • Promising method: a dominance tree approach to systems of cities (Louail & Barthelemy, 2022)
transregional knowledge network. The case of a French research federation in green chemistry. International Conference on Scientometrics and Informetrics (ISSI 2019), Sep 2019, Rome, Italy.
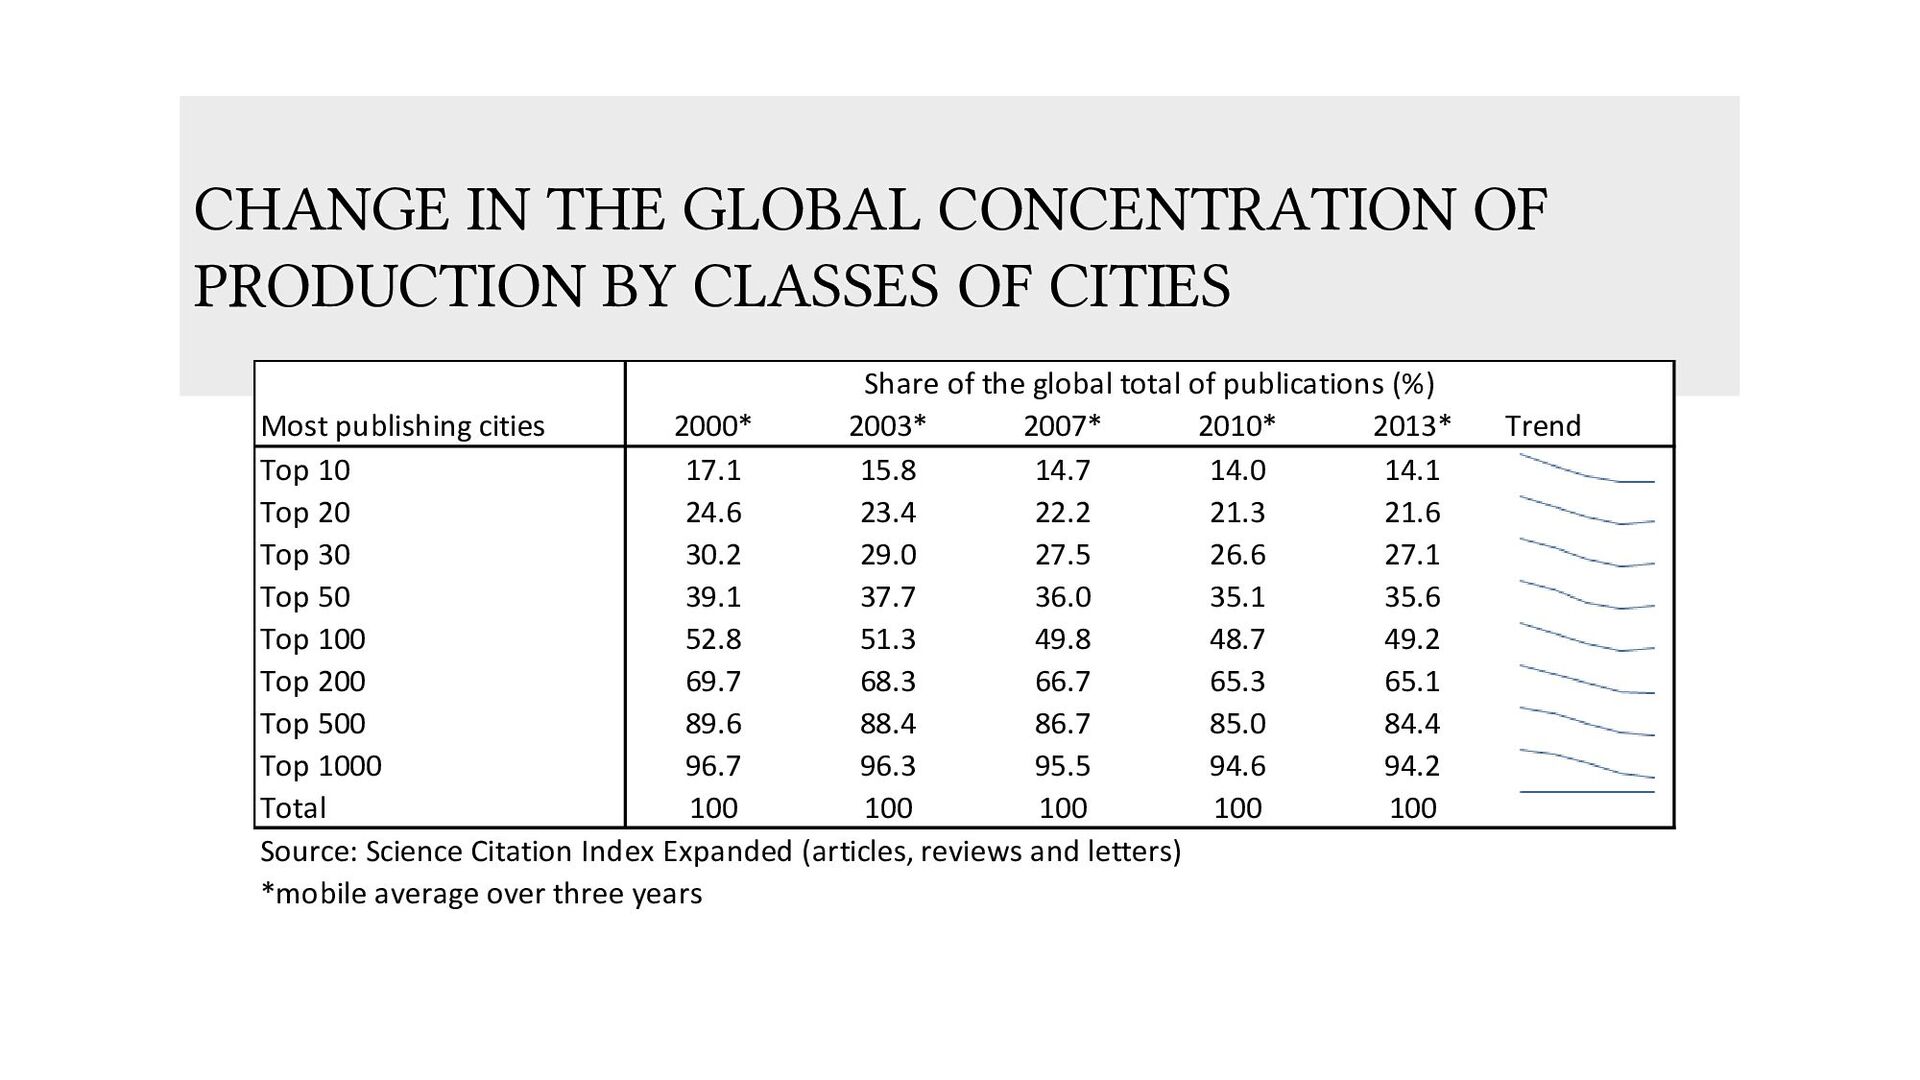
CITIES Most publishing cities 2000* 2003* 2007* 2010* 2013* Trend Top 10 17.1 15.8 14.7 14.0 14.1 Top 20 24.6 23.4 22.2 21.3 21.6 Top 30 30.2 29.0 27.5 26.6 27.1 Top 50 39.1 37.7 36.0 35.1 35.6 Top 100 52.8 51.3 49.8 48.7 49.2 Top 200 69.7 68.3 66.7 65.3 65.1 Top 500 89.6 88.4 86.7 85.0 84.4 Top 1000 96.7 96.3 95.5 94.6 94.2 Total 100 100 100 100 100 Share of the global total of publications (%) Source: Science Citation Index Expanded (articles, reviews and letters) *mobile average over three years
centers from the initial Voronoi tessellation B. Draw new Voronoi polygons by considering these local centers only C. Determine the local centers, etc. A. In the end we obtain a dominance tree representing the spatial hierarchy of the system. Each node is characterized by its height h in the tree Louail & Barthelemy, 2022
data of French municipalities (since 1876) Compilation of US cities populations between 1790 and 2010 (every 10 years) Data come primarily from the US Census Bureau https://github.com/cestastanford/historical-us-city-populations Both datasets are public and available for free Louail & Barthelemy, 2022
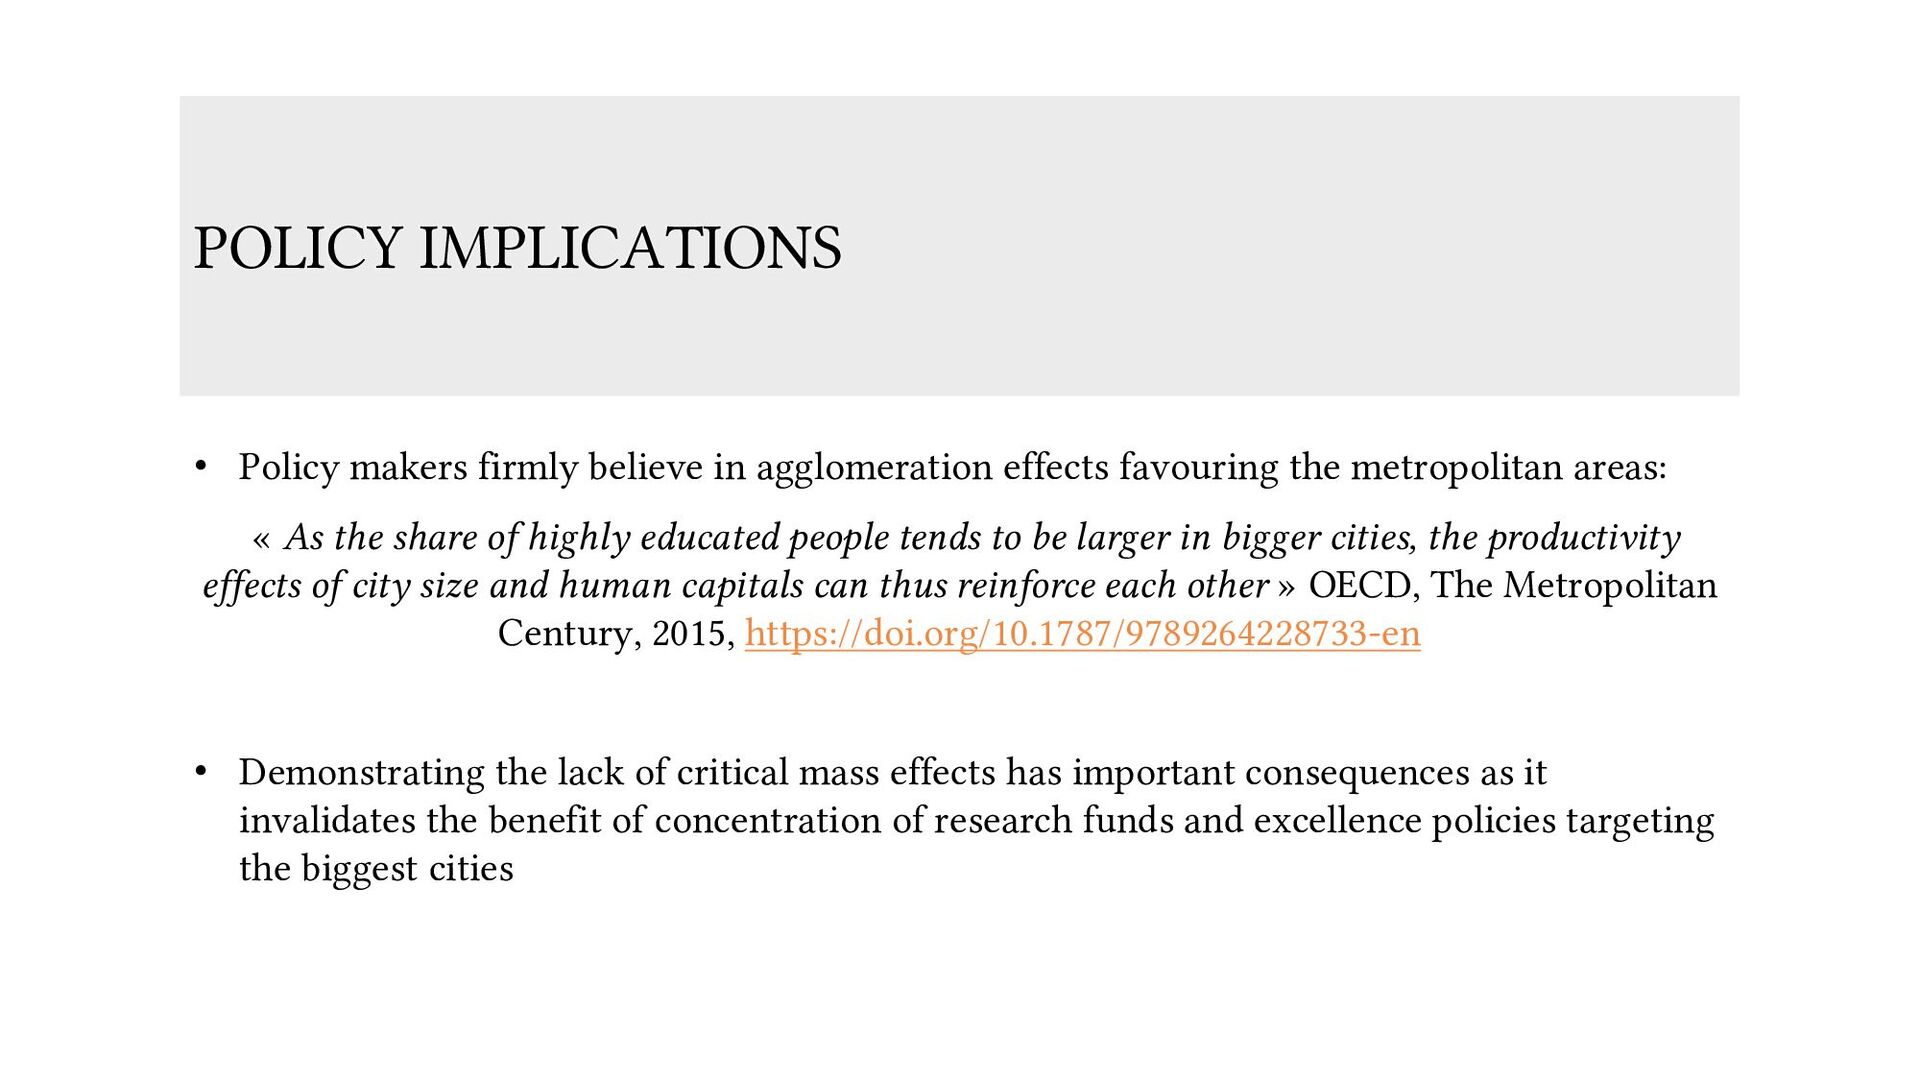
favouring the metropolitan areas: « As the share of highly educated people tends to be larger in bigger cities, the productivity effects of city size and human capitals can thus reinforce each other » OECD, The Metropolitan Century, 2015, https://doi.org/10.1787/9789264228733-en • Demonstrating the lack of critical mass effects has important consequences as it invalidates the benefit of concentration of research funds and excellence policies targeting the biggest cities
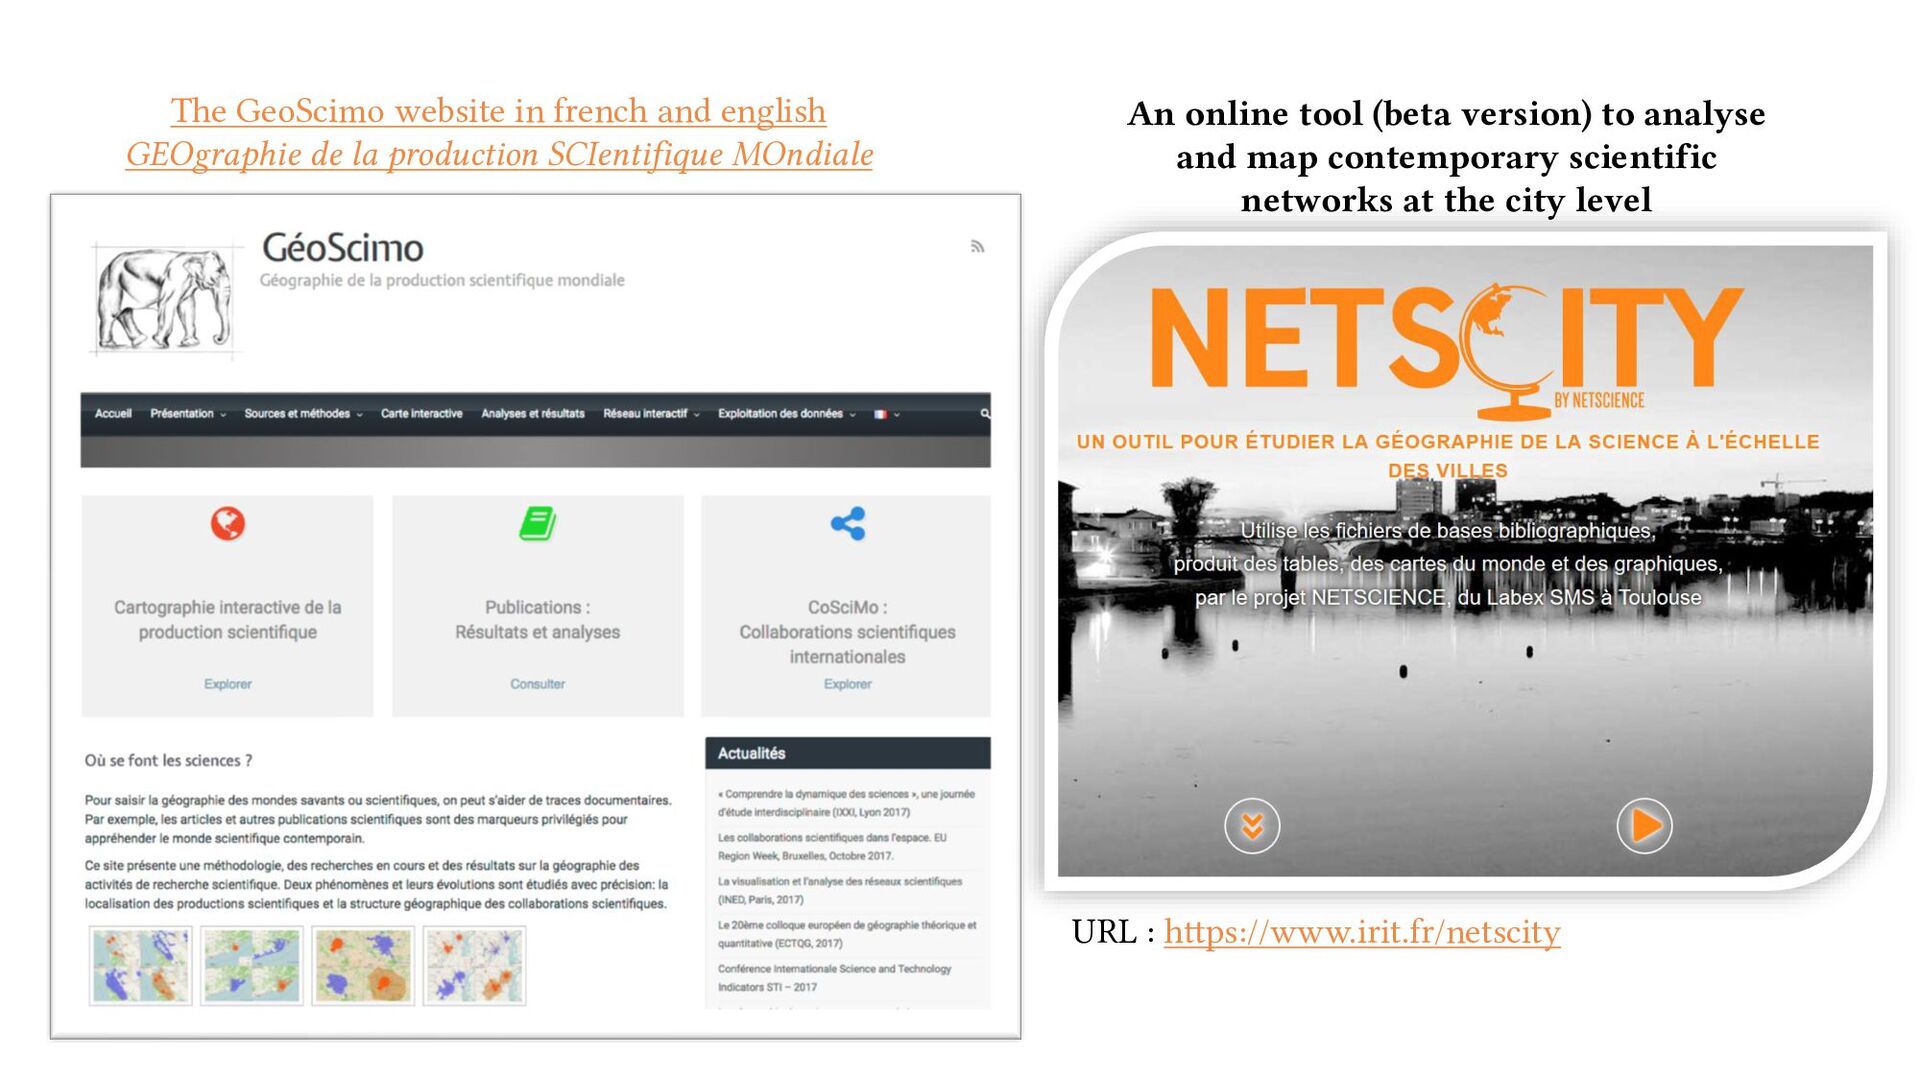
production SCIentifique MOndiale URL : https://www.irit.fr/netscity An online tool (beta version) to analyse and map contemporary scientific networks at the city level