explore academic sociality #Sunbelt2020 virtual sessions on 𝘽𝙞𝙥𝙖𝙧𝙩𝙞𝙩𝙚 𝙉𝙚𝙩𝙬𝙤𝙧𝙠𝙨 & 𝙋𝙧𝙤𝙟𝙚𝙘𝙩𝙞𝙤𝙣𝙨 Empirical Insights from Bipartite and Multipartite Networks July 15, 2020 François Briatte · ESPOL, Catholic U. of Lille, France Marion Maisonobe · Géocités, CNRS, Paris, France
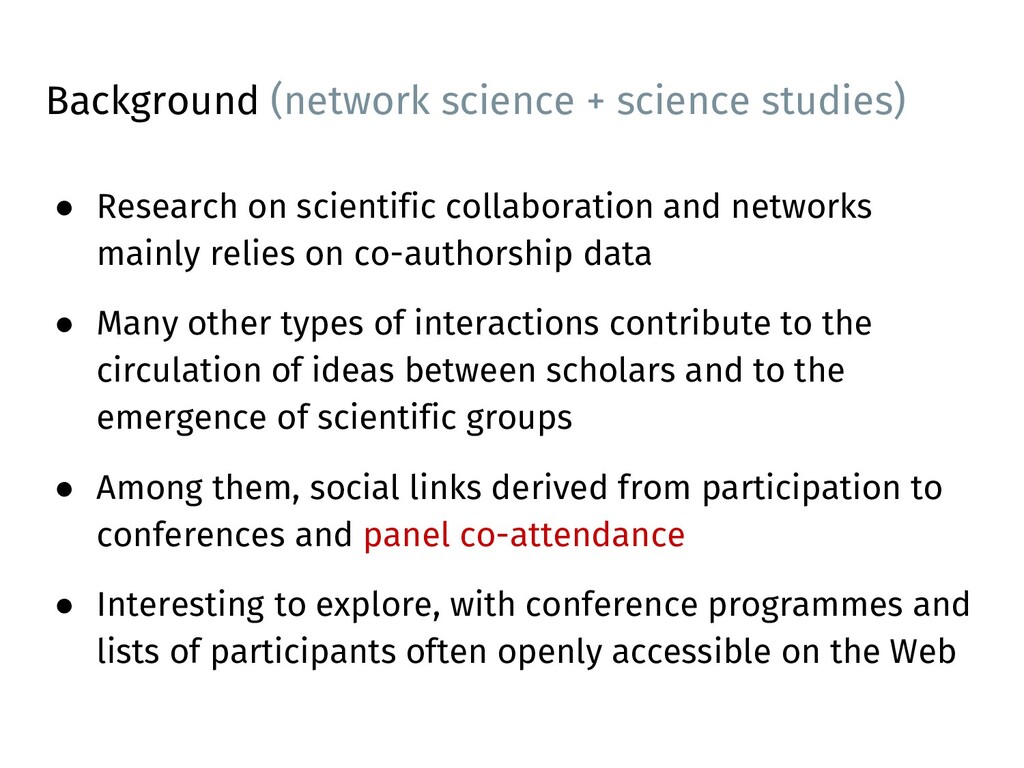
collaboration and networks mainly relies on co-authorship data • Many other types of interactions contribute to the circulation of ideas between scholars and to the emergence of scientific groups • Among them, social links derived from participation to conferences and panel co-attendance • Interesting to explore, with conference programmes and lists of participants often openly accessible on the Web
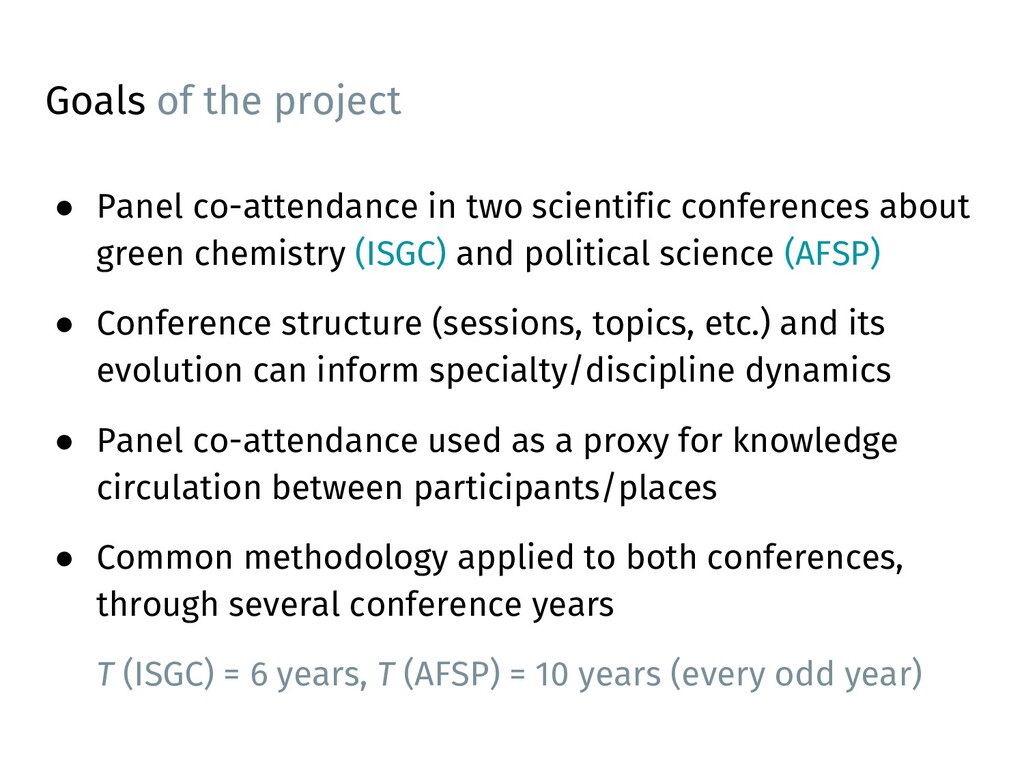
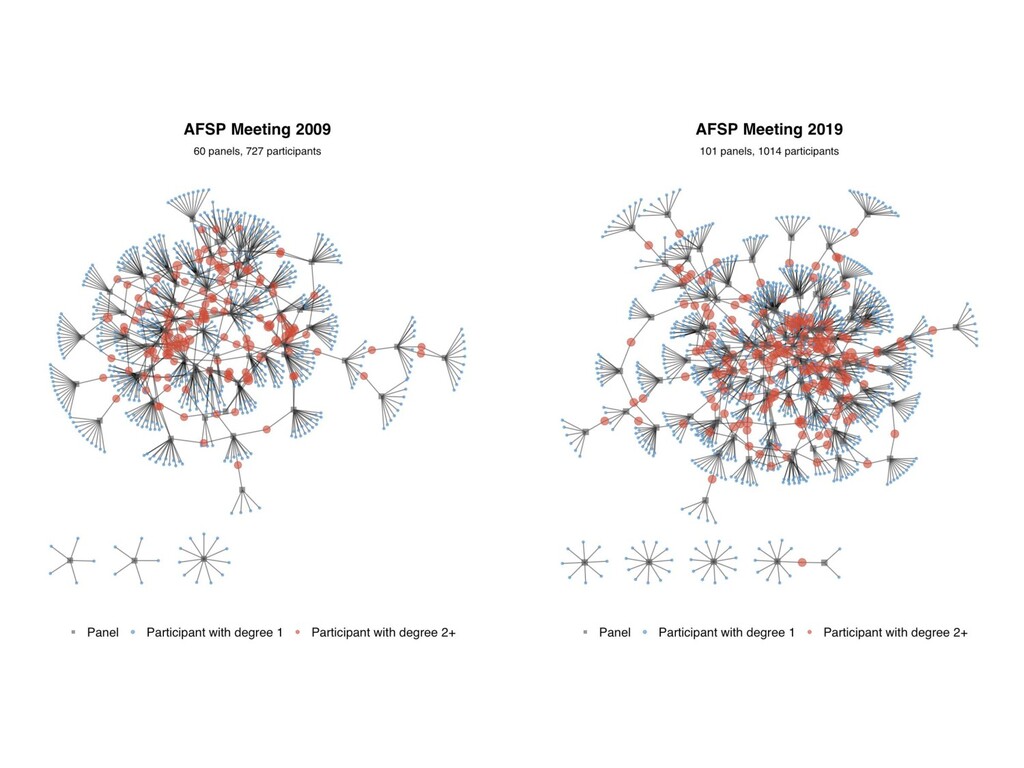
(ISGC) and political science (AFSP) • Conference structure (sessions, topics, etc.) and its evolution can inform specialty/discipline dynamics • Panel co-attendance used as a proxy for knowledge circulation between participants/places • Common methodology applied to both conferences, through several conference years T (ISGC) = 6 years, T (AFSP) = 10 years (every odd year) Goals of the project
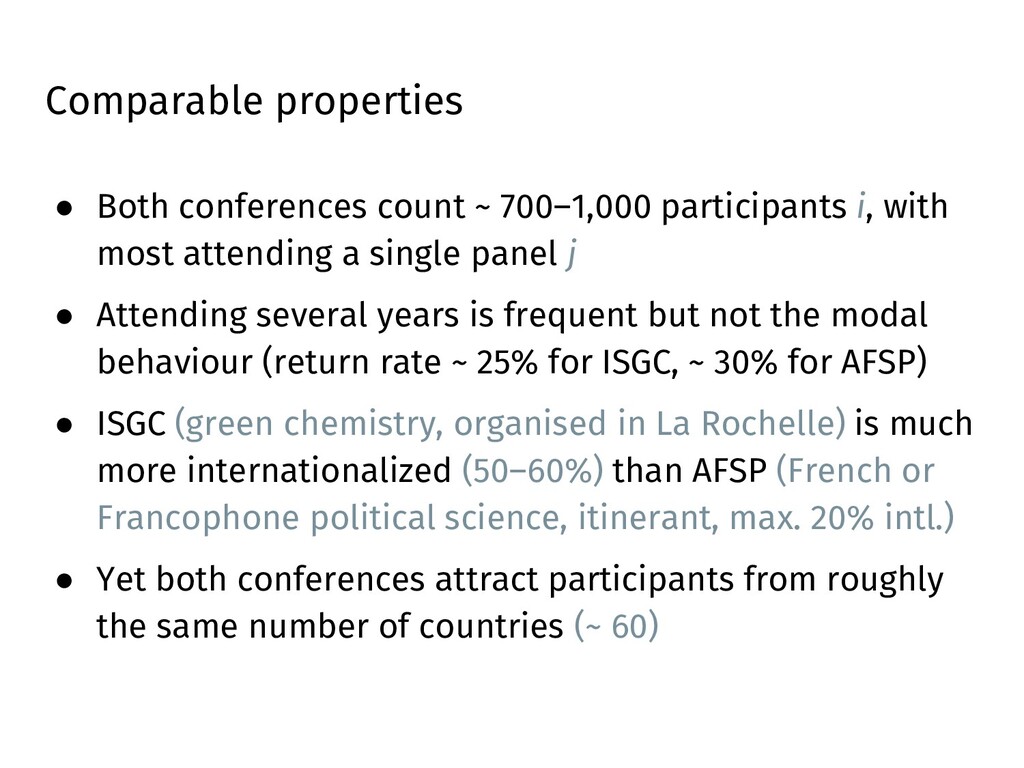
with most attending a single panel j • Attending several years is frequent but not the modal behaviour (return rate ~ 25% for ISGC, ~ 30% for AFSP) • ISGC (green chemistry, organised in La Rochelle) is much more internationalized (50–60%) than AFSP (French or Francophone political science, itinerant, max. 20% intl.) • Yet both conferences attract participants from roughly the same number of countries (~ 60)
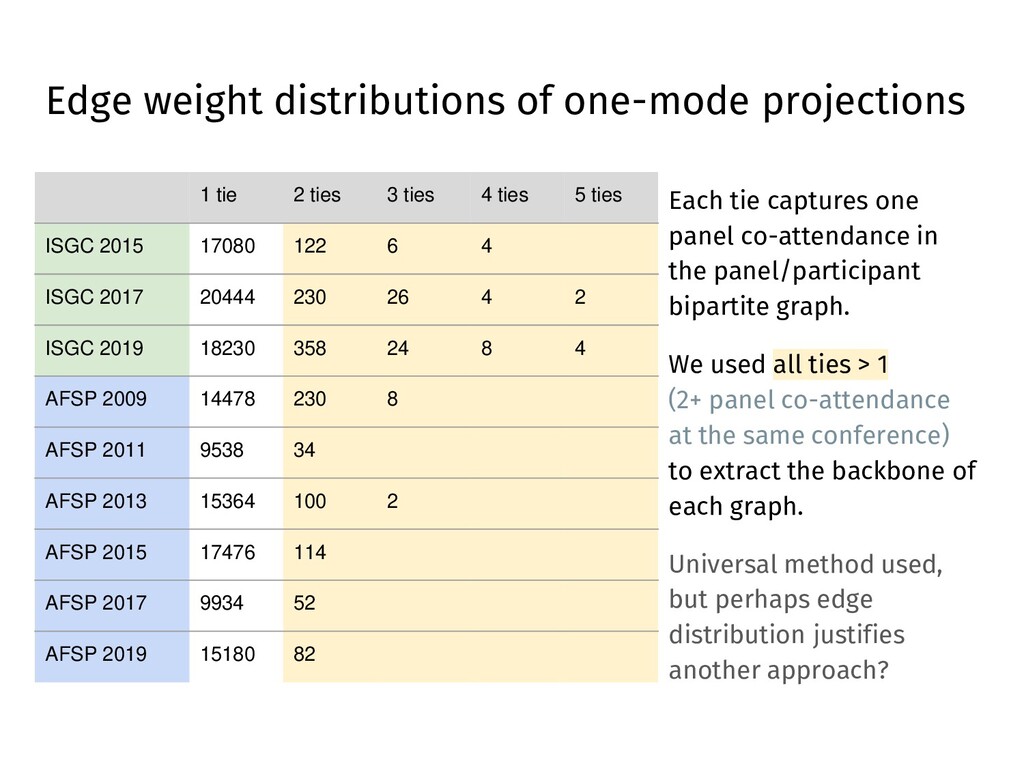
graph. We used all ties > 1 (2+ panel co-attendance at the same conference) to extract the backbone of each graph. Universal method used, but perhaps edge distribution justifies another approach? Edge weight distributions of one-mode projections 1 tie 2 ties 3 ties 4 ties 5 ties ISGC 2015 17080 122 6 4 ISGC 2017 20444 230 26 4 2 ISGC 2019 18230 358 24 8 4 AFSP 2009 14478 230 8 AFSP 2011 9538 34 AFSP 2013 15364 100 2 AFSP 2015 17476 114 AFSP 2017 9934 52 AFSP 2019 15180 82
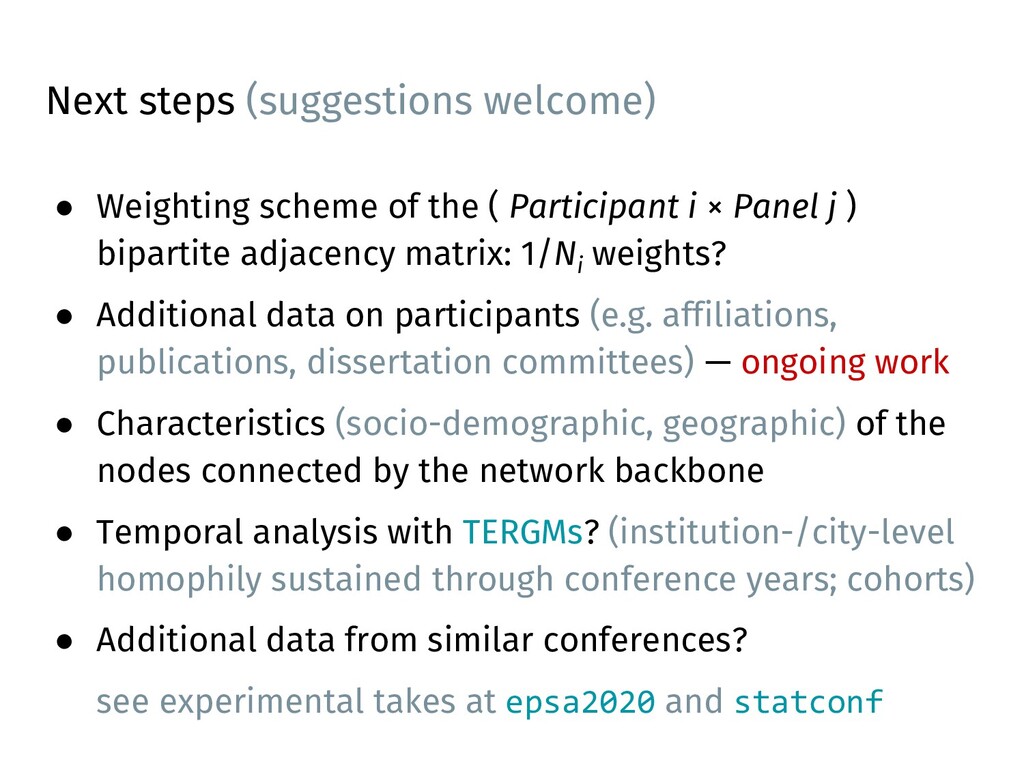
Participant i × Panel j ) bipartite adjacency matrix: 1/N i weights? • Additional data on participants (e.g. affiliations, publications, dissertation committees) — ongoing work • Characteristics (socio-demographic, geographic) of the nodes connected by the network backbone • Temporal analysis with TERGMs? (institution-/city-level homophily sustained through conference years; cohorts) • Additional data from similar conferences? see experimental takes at epsa2020 and statconf
AFSP conference data scraped from the AFSP website see congres-afsp for the code and (preliminary) data • Graph visualizations performed with igraph (Csárdi), ggraph (Pedersen) and graphlayouts (Schoch) • Backbone extraction performed with backbone (Domagalski, Neal and Sagan) • References for final report on Zotero Sources
![Thank you for your attention Slides at frama.link/netconf-2020-sunbelt [email protected] ·](https://files.speakerdeck.com/presentations/2e0a4be68b8b4c939392fb6ac4bbebd3/slide_13.jpg)