Upgrade to Pro
— share decks privately, control downloads, hide ads and more …
Speaker Deck
Features
Speaker Deck
PRO
Sign in
Sign up for free
Search
Search
Linux の Debug 機能
Search
Sponsored
·
Your Podcast. Everywhere. Effortlessly.
Share. Educate. Inspire. Entertain. You do you. We'll handle the rest.
→
Masami Ichikawa
May 18, 2016
Programming
110
0
Share
Embed
Copy iframe code
Copy JS code
Copy link
Start on current slide
Linux の Debug 機能
Masami Ichikawa
May 18, 2016
More Decks by Masami Ichikawa
See All by Masami Ichikawa
cgroupsとプロセス生成・終了処理
masami256
1
1.4k
Linux Namespaces
masami256
0
82
slub: alloc and free
masami256
0
99
SLUB data structures
masami256
0
130
SystemV IPC
masami256
0
140
Linux Namespace
masami256
0
94
とある帽子の大蛇料理Ⅱ
masami256
0
100
Gnomeとdogtail
masami256
0
110
x86 とコンテキストスイッチ
masami256
0
300
Other Decks in Programming
See All in Programming
AIエージェントで 変わるAndroid開発環境
takahirom
2
480
任せる範囲はこう広がった / How the Scope of AI Delegation Has Expanded
nrslib
1
240
吝嗇家のためのAI活用 / AI development for miser - ChatGPT + Issue Driven Development
tooppoo
0
180
これからAgentCoreを触る方へ トレンドはGatewayです
har1101
6
480
LLMによるContent Moderationの本番運用の裏側と品質担保への挑戦
suikabar
3
840
act1-costs.pdf
sumedhbala
0
200
20260623_Loop Engineeringで自分の分身の問い合わせBotを作る
ryugen04
0
190
OS アップデート対応の取り組み方がもっと共有されてほしい
andpad
0
110
Observability in Practice:Grafana 與 Edge Device SRE 的那些事
blueswen
0
190
Dataformのリポジトリを立ち上げるときにまずやること / dataform-day0-2026
snhryt
0
220
TSKaigi Night Talks 2026_TypeScriptでサプライチェーンの整合性を型に閉じ込める
geekplus_tech
0
440
Webフレームワークの ベンチマークについて
yusukebe
0
200
Featured
See All Featured
AI Search: Where Are We & What Can We Do About It?
aleyda
0
7.7k
A brief & incomplete history of UX Design for the World Wide Web: 1989–2019
jct
2
420
Docker and Python
trallard
47
3.9k
More Than Pixels: Becoming A User Experience Designer
marktimemedia
3
460
Efficient Content Optimization with Google Search Console & Apps Script
katarinadahlin
PRO
1
670
The Curse of the Amulet
leimatthew05
2
13k
Why Mistakes Are the Best Teachers: Turning Failure into a Pathway for Growth
auna
0
180
The Cult of Friendly URLs
andyhume
79
6.9k
Being A Developer After 40
akosma
91
590k
How to Build an AI Search Optimization Roadmap - Criteria and Steps to Take #SEOIRL
aleyda
1
2.1k
Why Your Marketing Sucks and What You Can Do About It - Sophie Logan
marketingsoph
0
200
RailsConf 2023
tenderlove
30
1.5k
Transcript
Linux の Debug 機能 • @masami256
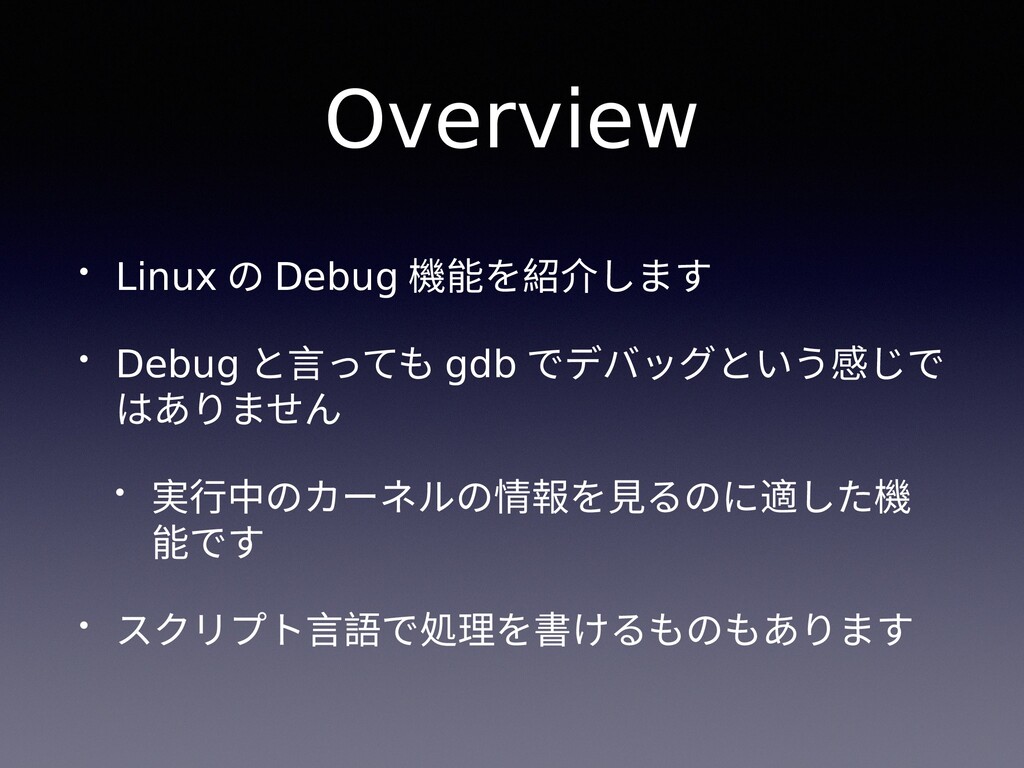
Overview • Linux の Debug 機能を紹介します • Debug と言っても gdb
でデバッグという感じで はありません • 実行中のカーネルの情報を見るのに適した機 能です • スクリプト言語で処理を書けるものもあります
Importance • debug 系のパッケージがあると捗ります • -debuginfo • RHEL 系 •
-dbgsym • Ubuntu • symbol 見れないのはやっぱり辛い>< • debug 系のパッケージを提供していないディストリビューション の場合は自前でビルドしましょう
Tools • SystemTap • Perf • Ftrace • eBPF
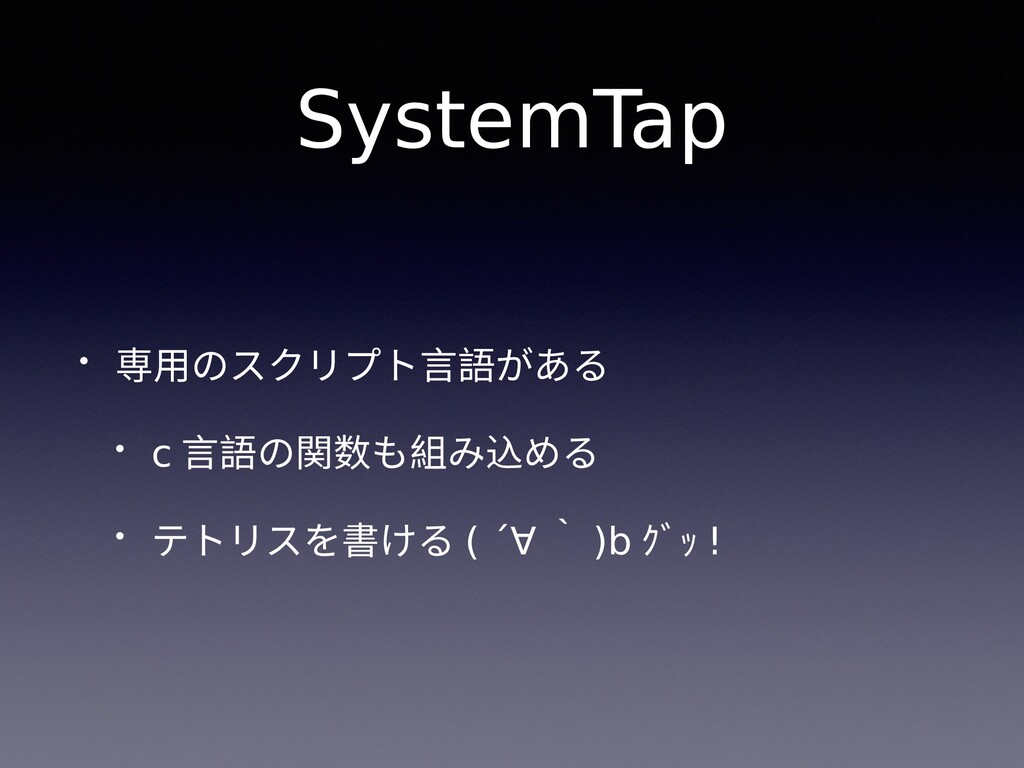
SystemTap • 専用のスクリプト言語がある • c 言語の関数も組み込める • テトリスを書ける ( ´∀
` )b グッ !
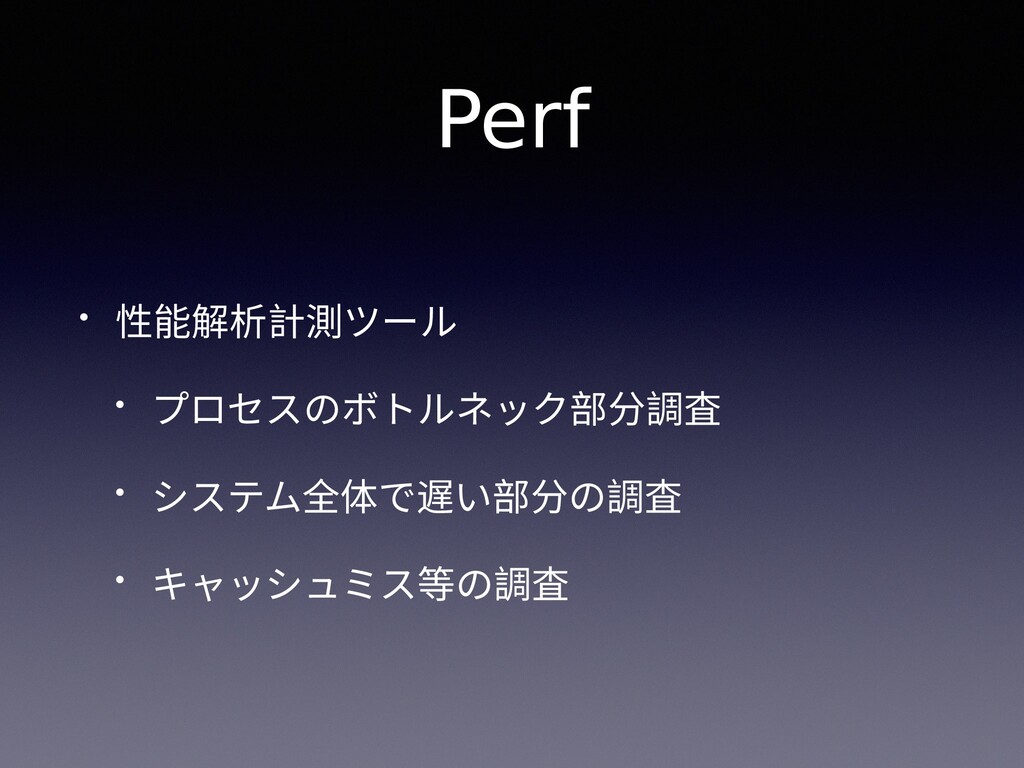
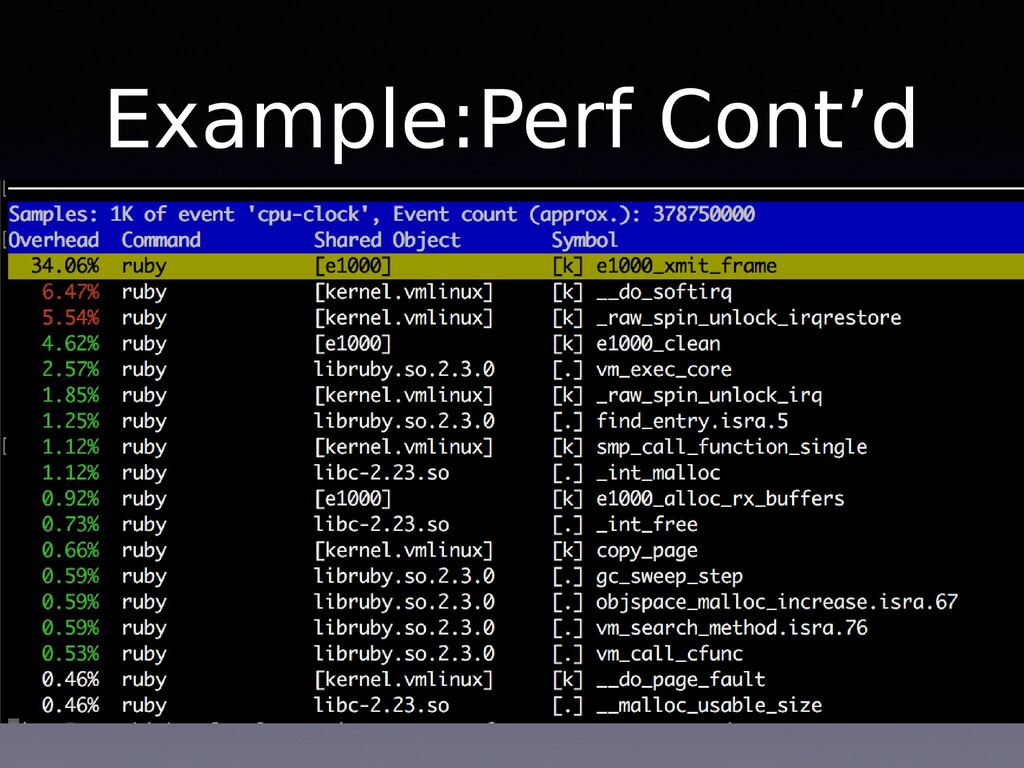
Perf • 性能解析計測ツール • プロセスのボトルネック部分調査 • システム全体で遅い部分の調査 • キャッシュミス等の調査
Ftrace • Linux カーネルの関数のトレース • 関数のコールフローだけでなく、処理時間も計 測できる • 素の ftrace
を使うよりは trace-cmd とかを 使うほうが楽
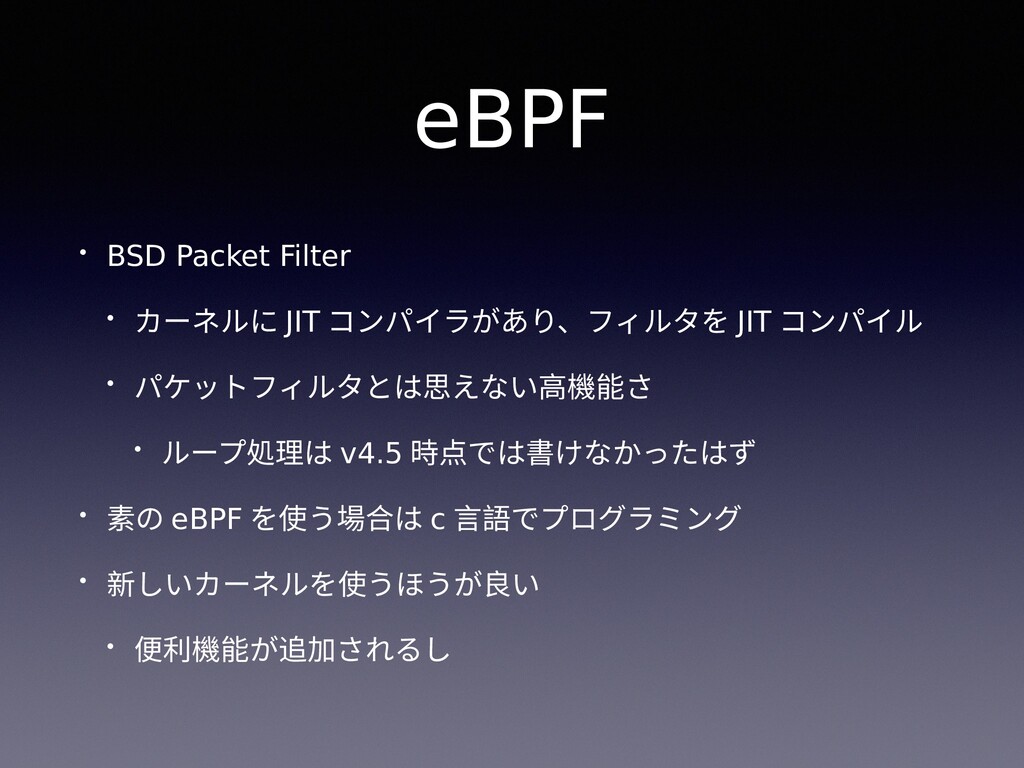
eBPF • BSD Packet Filter • カーネルに JIT コンパイラがあり、フィルタを JIT
コンパイル • パケットフィルタとは思えない高機能さ • ループ処理は v4.5 時点では書けなかったはず • 素の eBPF を使う場合は c 言語でプログラミング • 新しいカーネルを使うほうが良い • 便利機能が追加されるし
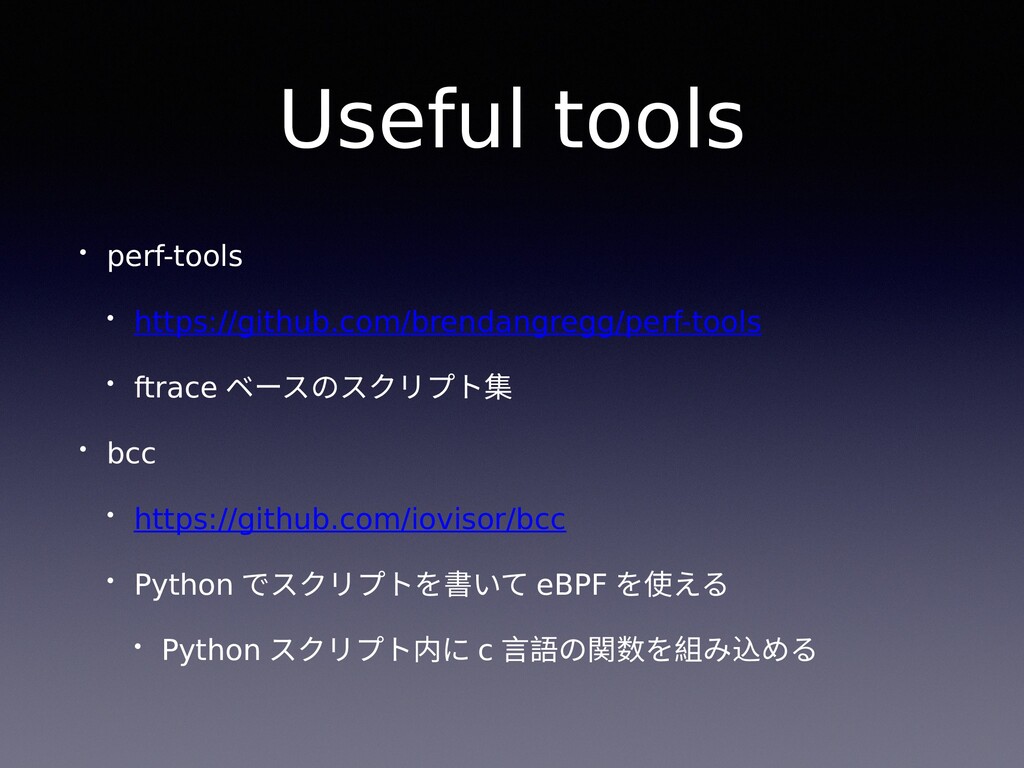
Useful tools • perf-tools • https://github.com/brendangregg/perf-tools • ftrace ベースのスクリプト集 •
bcc • https://github.com/iovisor/bcc • Python でスクリプトを書いて eBPF を使える • Python スクリプト内に c 言語の関数を組み込める
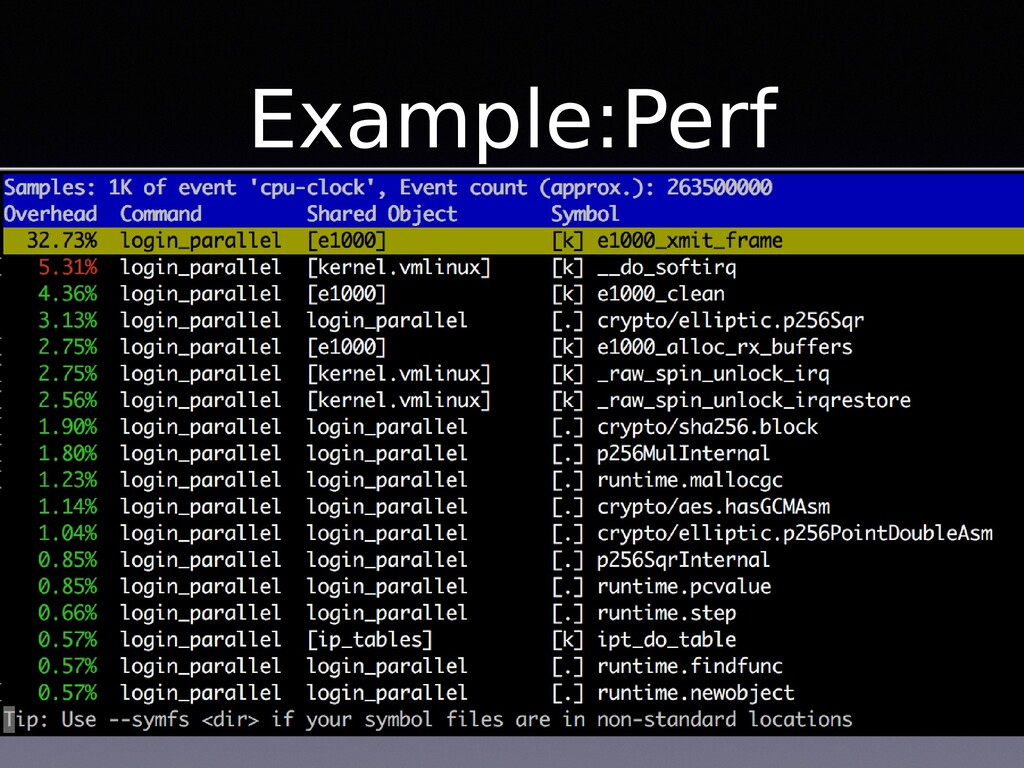
Example:Perf
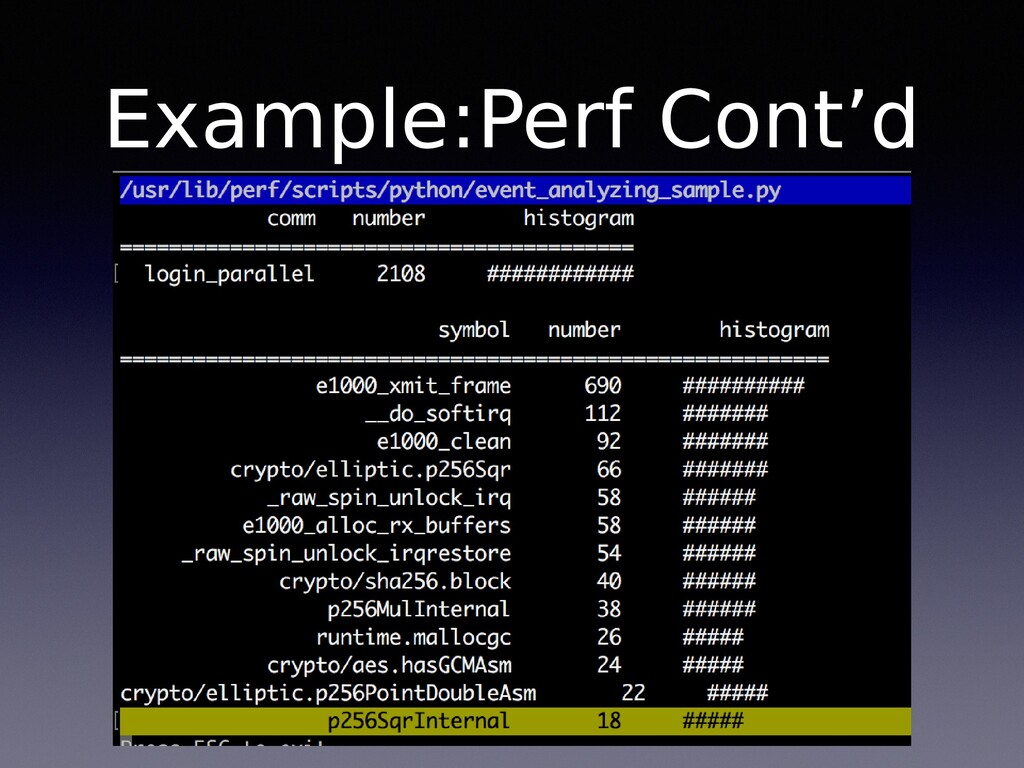
Example:Perf Cont’d
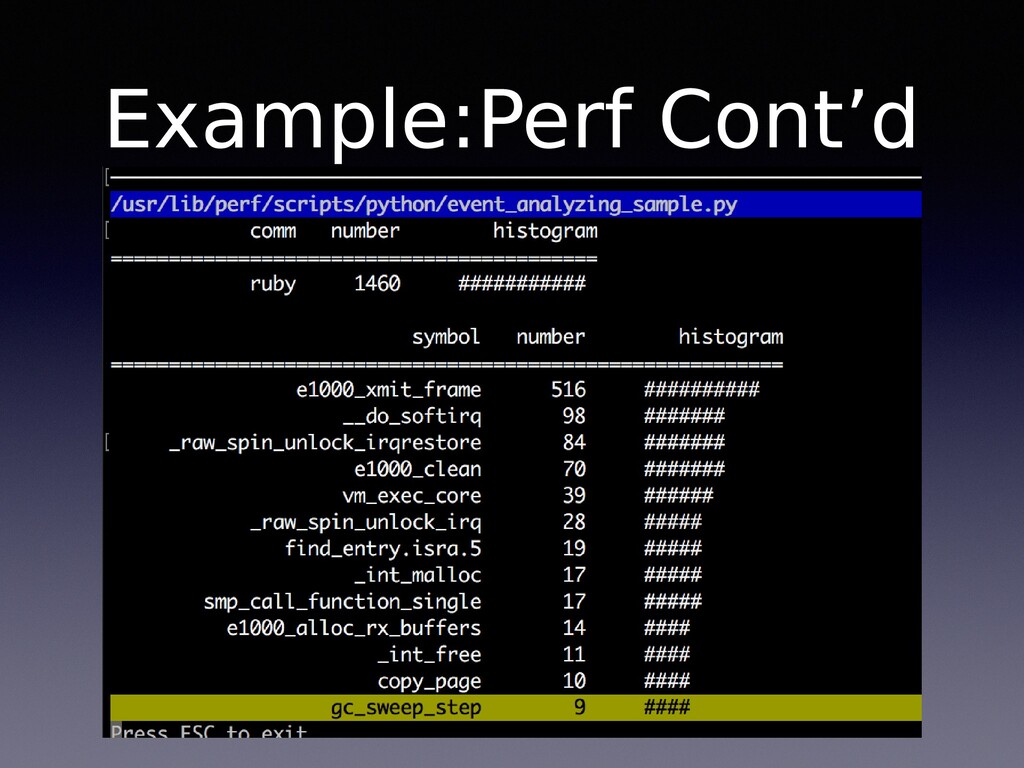
Example:Perf Cont’d
Example:Perf Cont’d
Example:bcc bcc 付属の tcp connection のモニタリングスクリプトを実行 http status 302 が最初に返
り、 Location ヘッダにある先に接続 するので 2 回分のログが出てる http status 302 が最初に返 り、 Location ヘッダにある先に接続 するので 2 回分のログが出てる
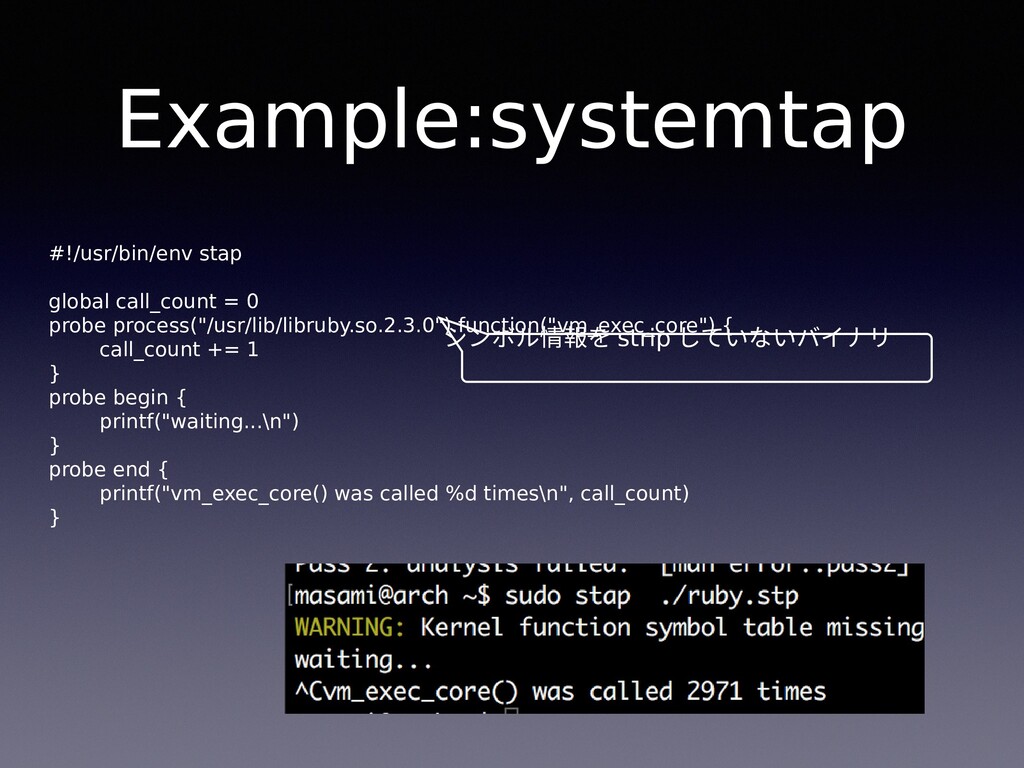
Example:systemtap #!/usr/bin/env stap global call_count = 0 probe process("/usr/lib/libruby.so.2.3.0").function("vm_exec_core") {
call_count += 1 } probe begin { printf("waiting...\n") } probe end { printf("vm_exec_core() was called %d times\n", call_count) } シンボル情報を strip していないバイナリ シンボル情報を strip していないバイナリ
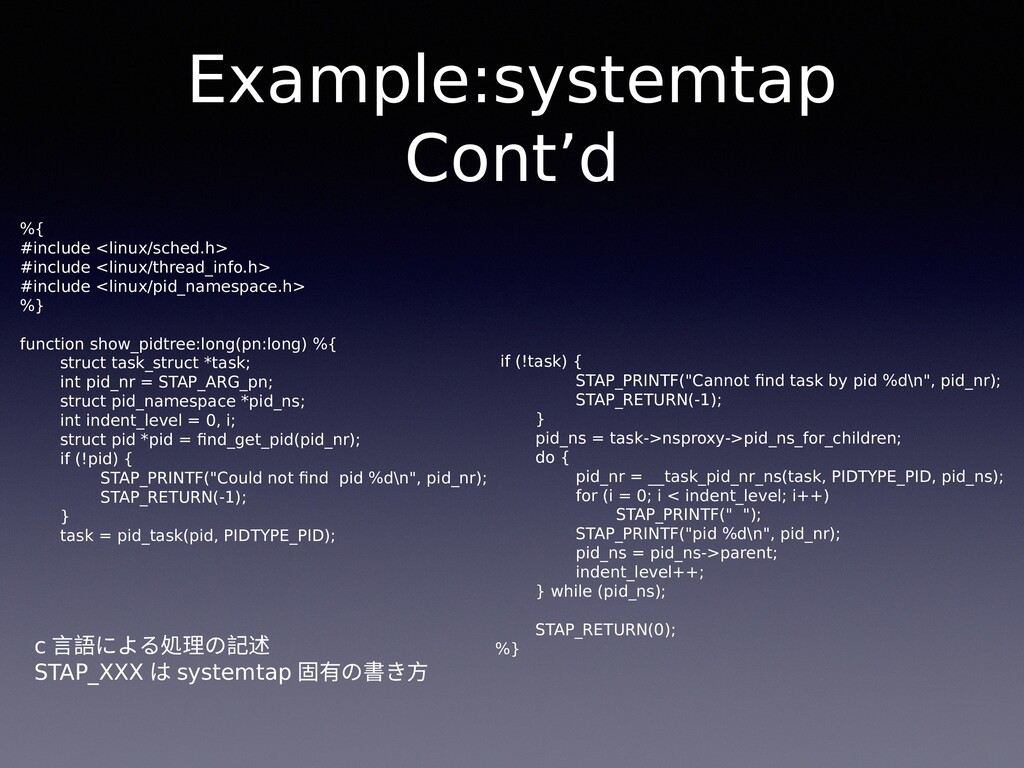
Example:systemtap Cont’d %{ #include <linux/sched.h> #include <linux/thread_info.h> #include <linux/pid_namespace.h> %}
function show_pidtree:long(pn:long) %{ struct task_struct *task; int pid_nr = STAP_ARG_pn; struct pid_namespace *pid_ns; int indent_level = 0, i; struct pid *pid = find_get_pid(pid_nr); if (!pid) { STAP_PRINTF("Could not find pid %d\n", pid_nr); STAP_RETURN(-1); } task = pid_task(pid, PIDTYPE_PID); if (!task) { STAP_PRINTF("Cannot find task by pid %d\n", pid_nr); STAP_RETURN(-1); } pid_ns = task->nsproxy->pid_ns_for_children; do { pid_nr = __task_pid_nr_ns(task, PIDTYPE_PID, pid_ns); for (i = 0; i < indent_level; i++) STAP_PRINTF(" "); STAP_PRINTF("pid %d\n", pid_nr); pid_ns = pid_ns->parent; indent_level++; } while (pid_ns); STAP_RETURN(0); %} c 言語による処理の記述 STAP_XXX は systemtap 固有の書き方
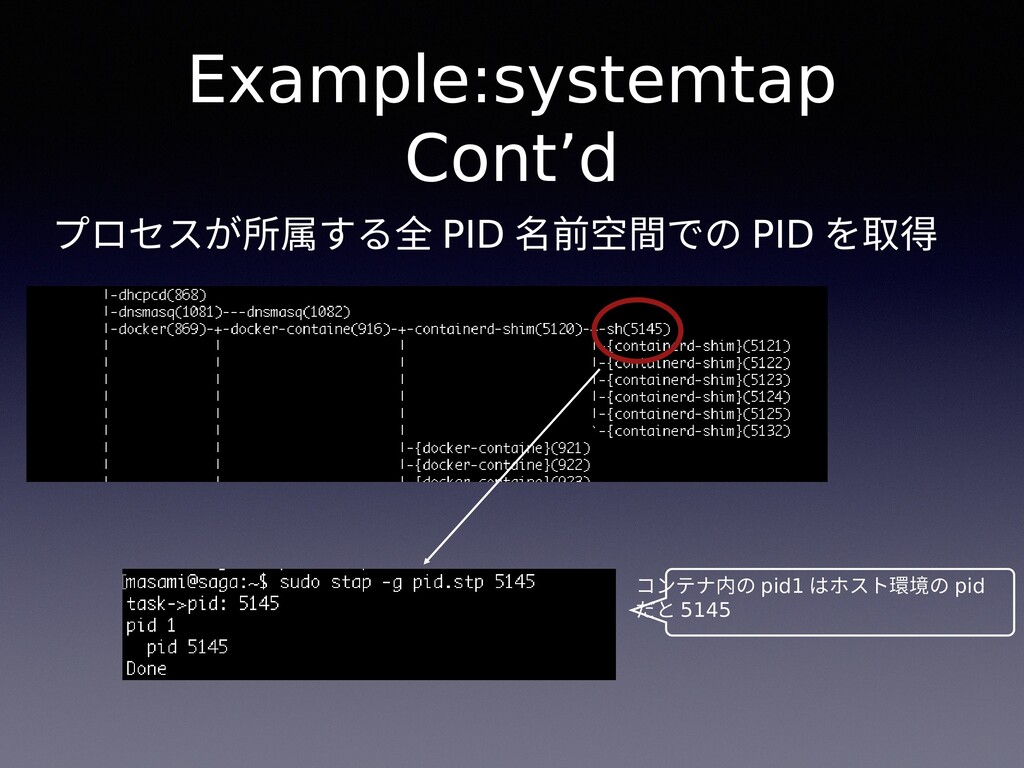
Example:systemtap Cont’d プロセスが所属する全 PID 名前空間での PID を取得 コンテナ内の pid1 はホスト環境の
pid だと 5145 コンテナ内の pid1 はホスト環境の pid だと 5145
Example:ftrace(perf- tools) masami@arch perf-tools[master]$ sudo ./syscount -c ~/login.rb Tracing while
running: "/home/masami/login.rb"... SYSCALL COUNT clock_gettime 1 exit_group 1 set_tid_address 1 sysinfo 1 access 2 connect 2 getrandom 2 getsockname 2 madvise 2 pipe2 2 poll 2 setsockopt 2 socket 2 exit 3 getrlimit 3 rt_sigprocmask 3 sched_getaffinity 3 sigaltstack 3 set_robust_list 4 prctl 5 ppoll 6 lseek 7 munmap 7 getdents 8 write 10 futex 14 rt_sigaction 21 newstat 42 mprotect 62 getgid 79 getegid 80 geteuid 80 getuid 80 mmap 83 fcntl 93 brk 102 ioctl 110 close 253 newfstat 310 read 379 newlstat 553 open 984
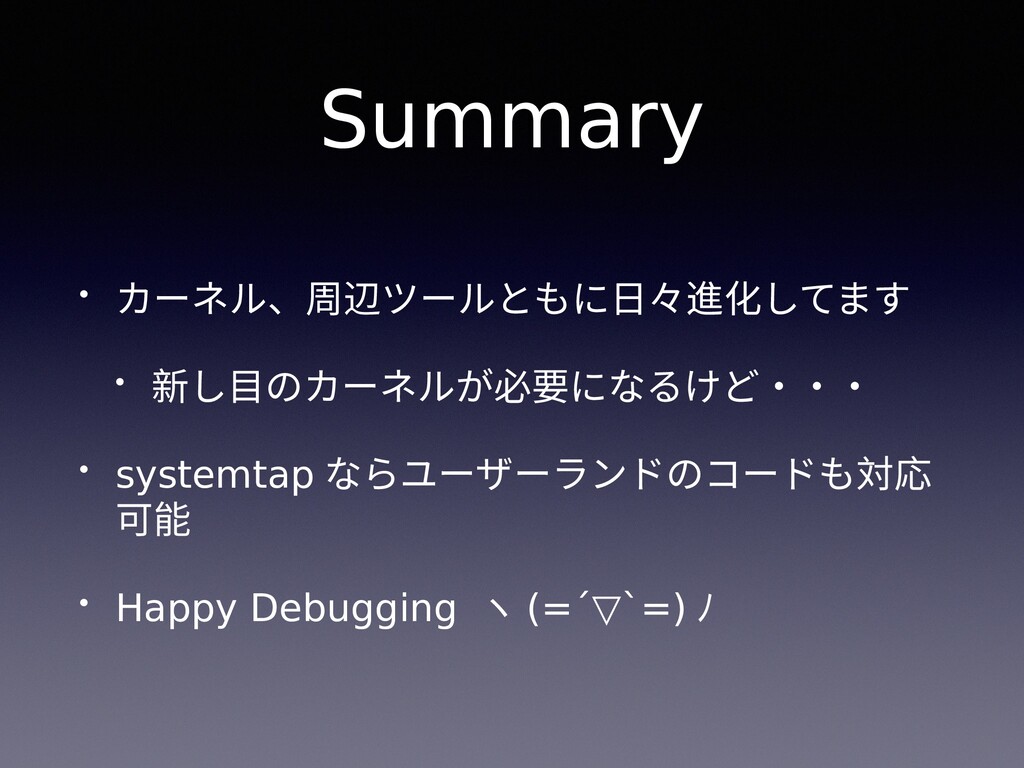
Summary • カーネル、周辺ツールともに日々進化してます • 新し目のカーネルが必要になるけど・・・ • systemtap ならユーザーランドのコードも対応 可能 •
Happy Debugging ヽ (=´▽`=) ノ
Reference • http://www.brendangregg.com/ • http://kernhack.hatenablog.com/
![Example:ftrace(perf- tools) masami@arch perf-tools[master]$ sudo ./syscount -c ~/login.rb Tracing while](https://files.speakerdeck.com/presentations/0456512cb97949e2b8c2343df4f456f0/slide_17.jpg)