Upgrade to Pro — share decks privately, control downloads, hide ads and more …

Golang Escape analysis

mbobakov
February 15, 2018

Golang Escape analysis

mbobakov

February 15, 2018
Tweet

Other Decks in Programming

Transcript

  1. Prelude with one allocation type click struct { id string

    info *info } func (c *click) description() {} func storeDescription(c *click) { c.description() }
  2. Benchmarks func BenchmarkExample1Ifaced(b *testing.B) { for i := 0; i

    < b.N; i++ { c := &click{id: "1"} storeDescriptionIfaced(c) } } func BenchmarkExample1(b *testing.B) { for i := 0; i < b.N; i++ { c := &click{id: "1"} storeDescription(c) } } go test -benchmem -run=none -bench Example1 -mempro le common.memout BenchmarkExample1Ifaced-4 50000000 31.2 ns/op 16 B/op 1 allocs/op BenchmarkExample1-4 2000000000 0.99 ns/op 0 B/op 0 allocs/op
  3. Benchmarks go tool pprof -alloc_space common.memout Total: 753.01MB ROUTINE ========================

    github.com/mbobakov/goway-1.2/presentation.BenchmarkExample1Ifaced in / 753.01MB 753.01MB (flat, cum) 100% of Total . . 31:func BenchmarkExample1Ifaced(b *testing.B) { . . 32: for i := 0; i < b.N; i++ { 753.01MB 753.01MB 33: c := &click{id: "1"} . . 34: storeDescriptionIfaced(c) . . 35: } . . 36:}
  4. Standard memory model disadvantages Concurrent access to the Heap One

    stack == one state Duplication(constans and instructions) for concurrency
  5. Golang Memory Model each goroutine has its own stackframe stack

    frames in the Heap dynamic size for the stackframe(default: 2048) Stackframe grows by allocate new, copy old to new, free old
  6. Escape analysis Escape analysis is the process that the compiler

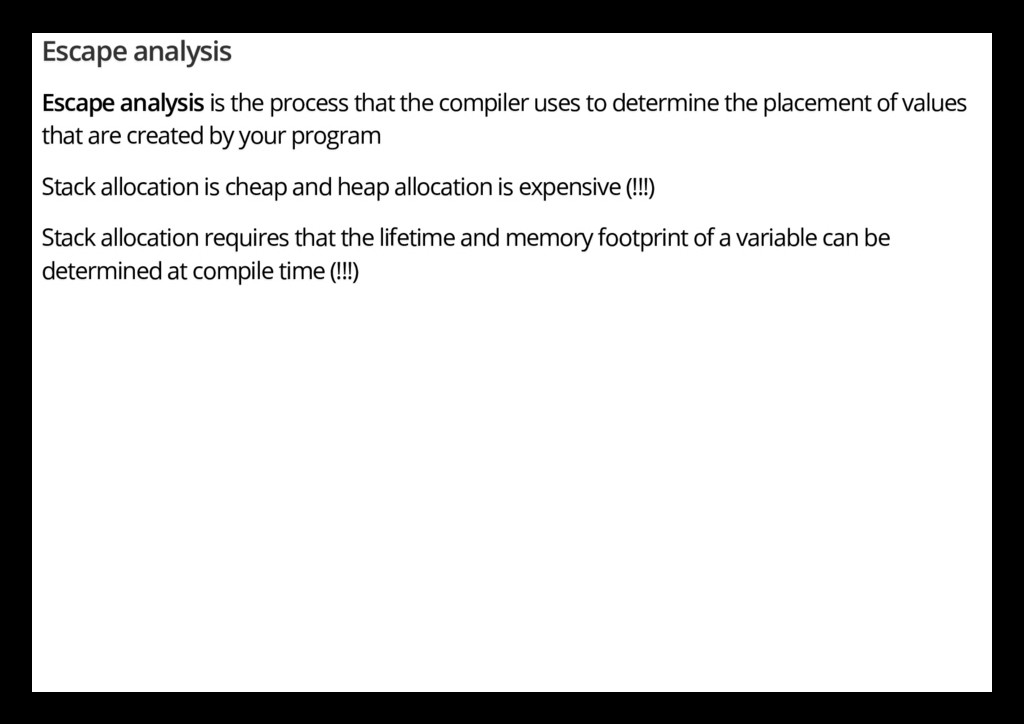
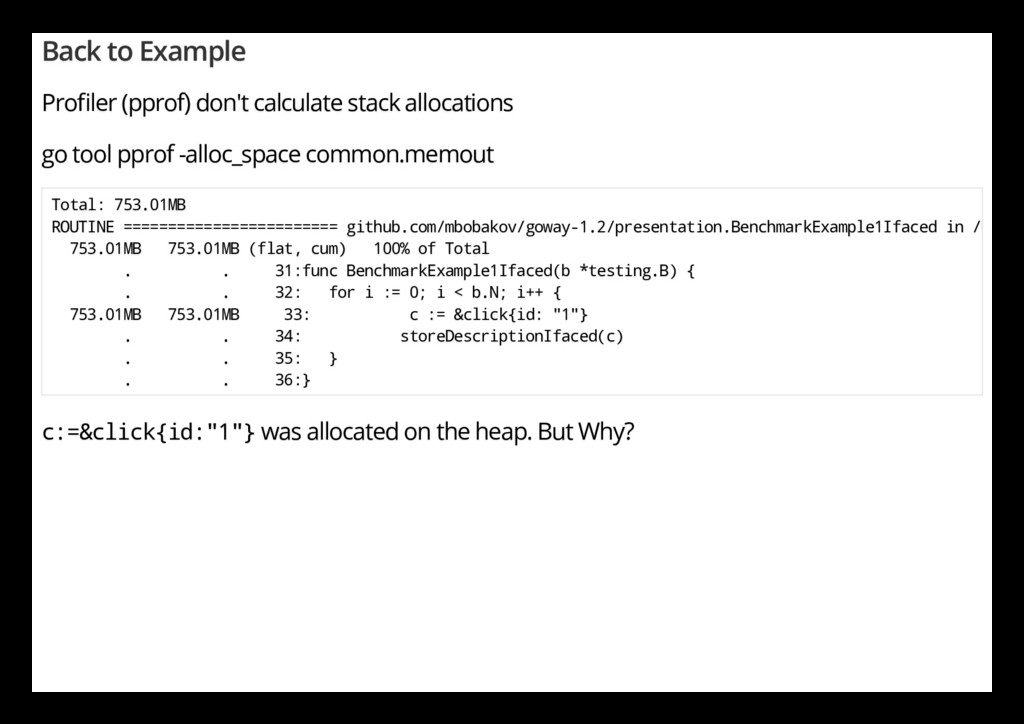
    uses to determine the placement of values that are created by your program Stack allocation is cheap and heap allocation is expensive (!!!) Stack allocation requires that the lifetime and memory footprint of a variable can be determined at compile time (!!!)
  7. Back to Example Pro ler (pprof) don't calculate stack allocations

    go tool pprof -alloc_space common.memout Total: 753.01MB ROUTINE ======================== github.com/mbobakov/goway-1.2/presentation.BenchmarkExample1Ifaced in / 753.01MB 753.01MB (flat, cum) 100% of Total . . 31:func BenchmarkExample1Ifaced(b *testing.B) { . . 32: for i := 0; i < b.N; i++ { 753.01MB 753.01MB 33: c := &click{id: "1"} . . 34: storeDescriptionIfaced(c) . . 35: } . . 36:} c:=&click{id:"1"} was allocated on the heap. But Why?
  8. How to see go tool compile -help -m print optimization

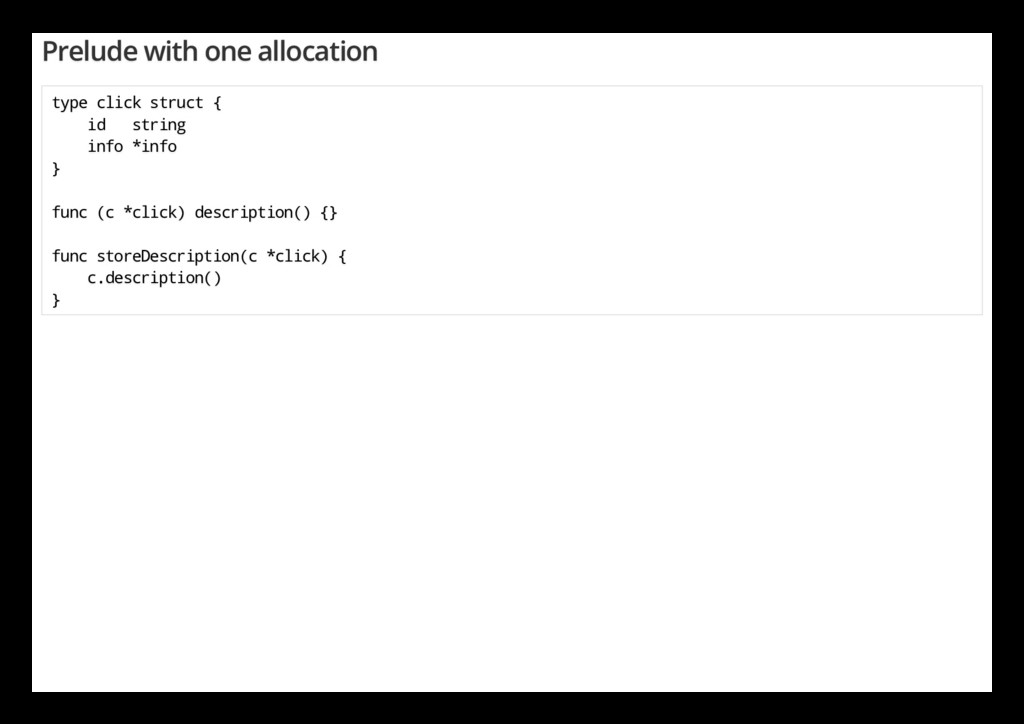
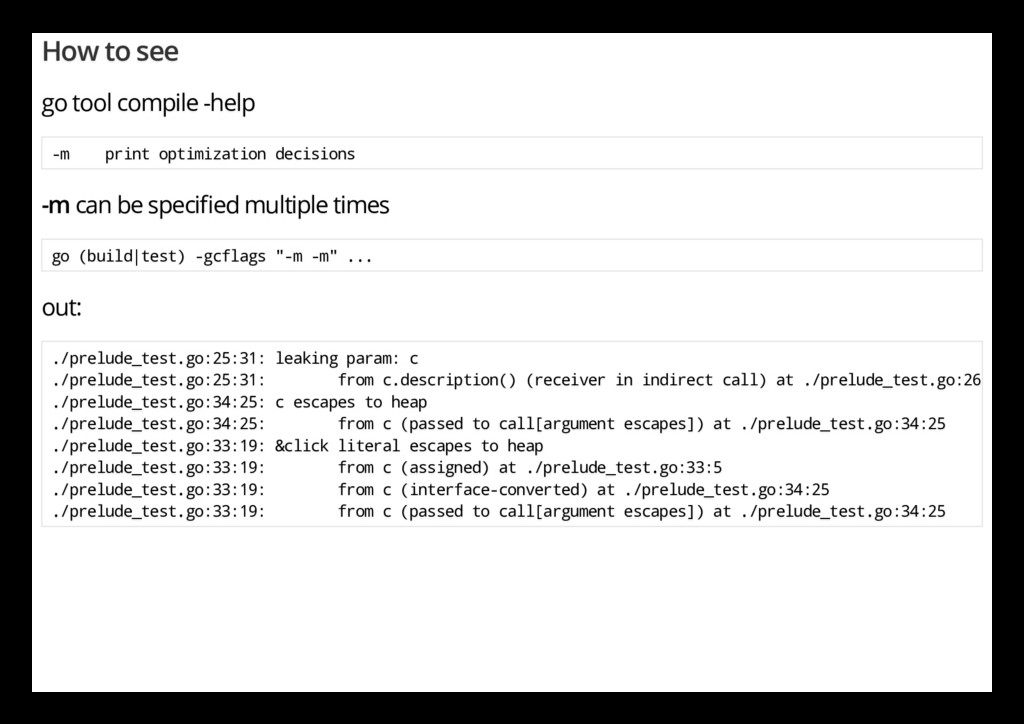
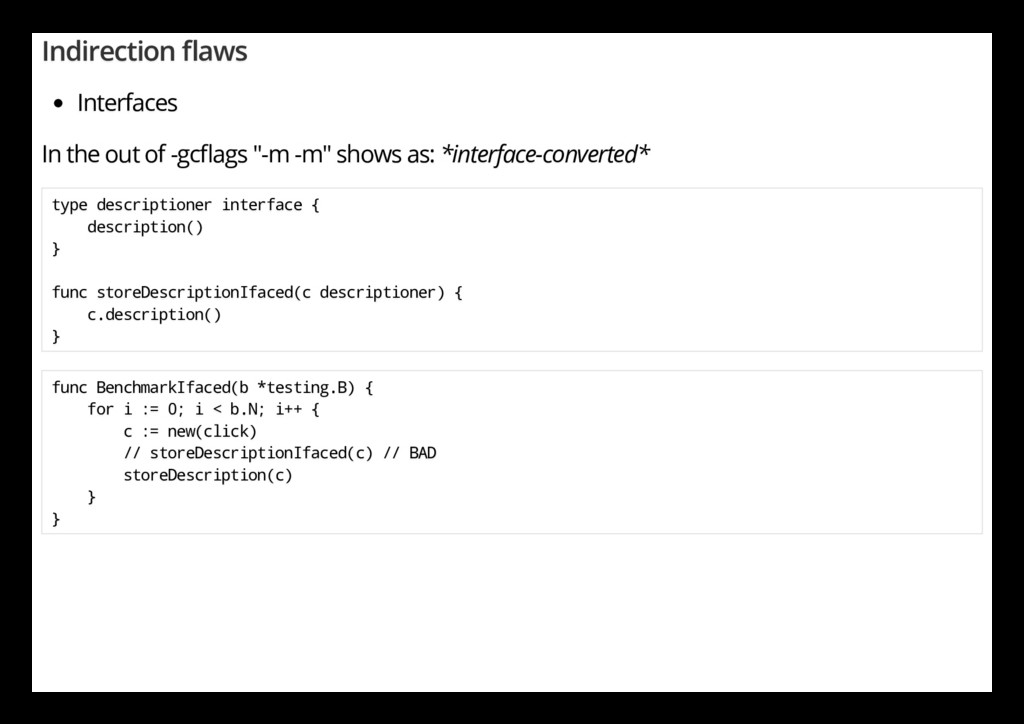
    decisions -m can be speci ed multiple times go (build|test) -gcflags "-m -m" ... out: ./prelude_test.go:25:31: leaking param: c ./prelude_test.go:25:31: from c.description() (receiver in indirect call) at ./prelude_test.go:26 ./prelude_test.go:34:25: c escapes to heap ./prelude_test.go:34:25: from c (passed to call[argument escapes]) at ./prelude_test.go:34:25 ./prelude_test.go:33:19: &click literal escapes to heap ./prelude_test.go:33:19: from c (assigned) at ./prelude_test.go:33:5 ./prelude_test.go:33:19: from c (interface-converted) at ./prelude_test.go:34:25 ./prelude_test.go:33:19: from c (passed to call[argument escapes]) at ./prelude_test.go:34:25
  9. Escape analysis aws William Kennedy. Escape analysis aws (https://www.ardanlabs.com/blog/2018/01/escape-analysis- aws.html)

    Dmitry Vyukov. Go Escape Analysis Flaws (https://docs.google.com/document/d/1CxgUBPlx9iJzkz9JWkb6tIpTe5q32QDmz8l0BouG0Cw/edit#heading=h.llaiaboyeyo3) Indirection calls(incl. Interfaces, Closures) Maps and slice Unknown
  10. Indirection aws Indirection assignment In the out of -gc ags

    "-m -m" shows as: *(star-dot-equals)* func BenchmarkIndirectAssign(b *testing.B) { for i := 0; i < b.N; i++ { // c := new(click) // c.info = &info{} // BAD c := &click{ info: &info{}, // GOOD } storeDescription(c) } }
  11. Indirection aws Indirection calls In the out of -gc ags

    "-m -m" shows as: _*(call part)*_ func (c *click) add(f int) { _ = f } func BenchmarkIndirectCall(b *testing.B) { for i := 0; i < b.N; i++ { t := 6 c := new(click) // foo := c.add //BAD // foo(t) c.add(t) storeDescription(c) } }
  12. Indirection aws Closures In the out of -gc ags "-m

    -m" shows as: _*capturing by value:*_ func BenchmarkClosure(b *testing.B) { for i := 0; i < b.N; i++ { c := new(click) // func() { //BAD // c.description() // }() c.uberDescription() } } func (c *click) uberDescription() { c.description() }
  13. Indirection aws Interfaces In the out of -gc ags "-m

    -m" shows as: *interface-converted* type descriptioner interface { description() } func storeDescriptionIfaced(c descriptioner) { c.description() } func BenchmarkIfaced(b *testing.B) { for i := 0; i < b.N; i++ { c := new(click) // storeDescriptionIfaced(c) // BAD storeDescription(c) } }
  14. Maps and slices map In the out of -gc ags

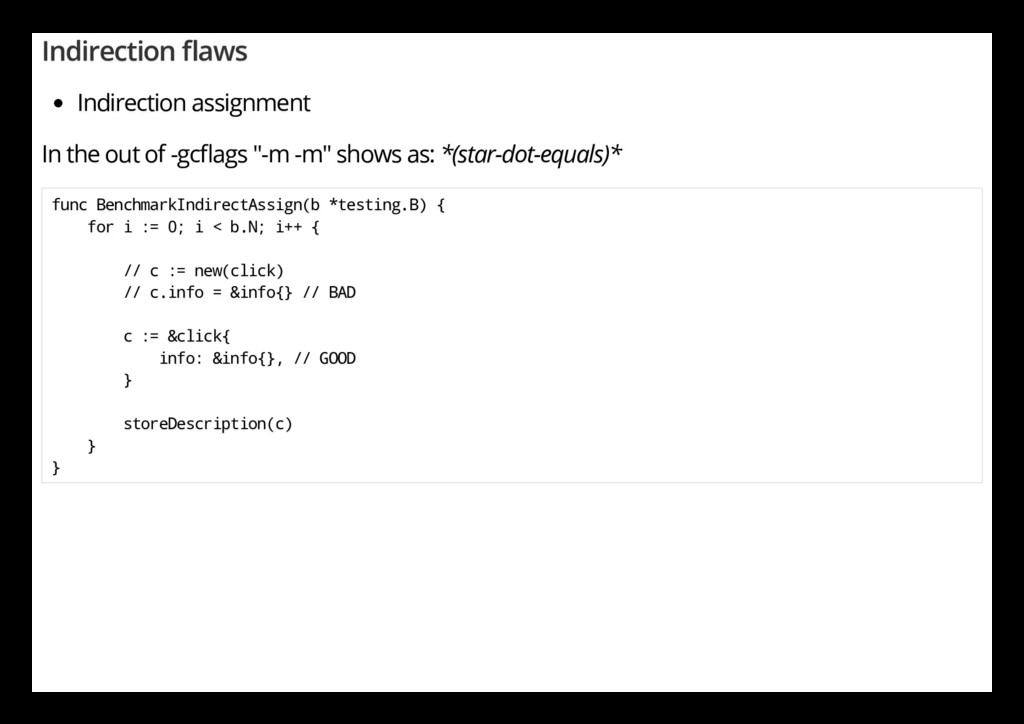
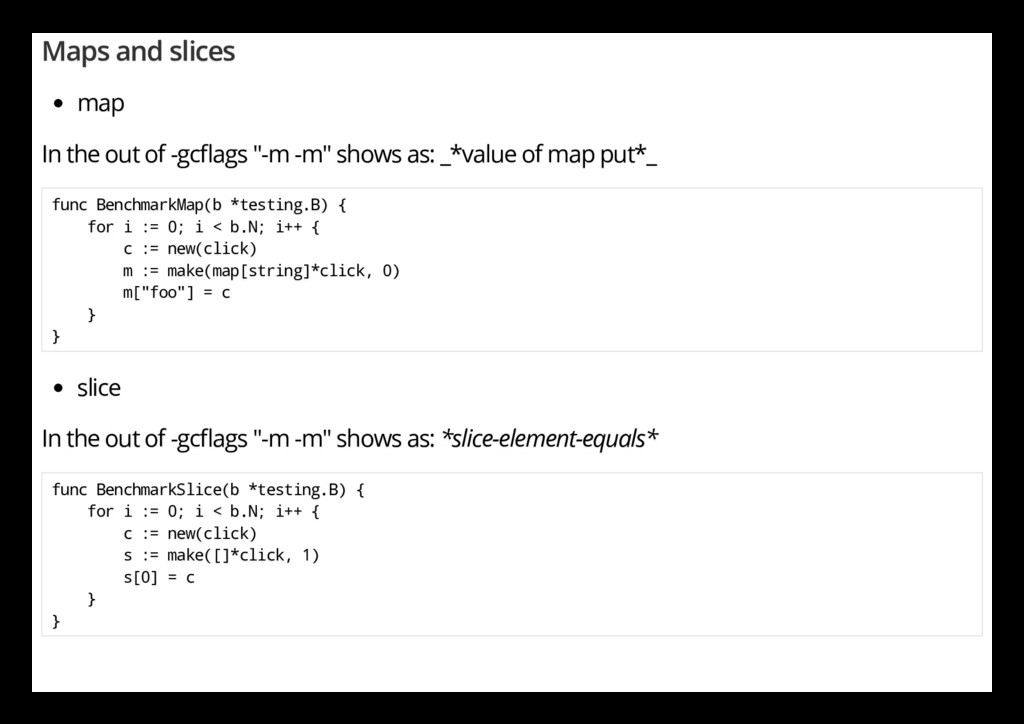
    "-m -m" shows as: _*value of map put*_ func BenchmarkMap(b *testing.B) { for i := 0; i < b.N; i++ { c := new(click) m := make(map[string]*click, 0) m["foo"] = c } } slice In the out of -gc ags "-m -m" shows as: *slice-element-equals* func BenchmarkSlice(b *testing.B) { for i := 0; i < b.N; i++ { c := new(click) s := make([]*click, 1) s[0] = c } }
  15. Conclusion In 95% if you have performance problem - it's

    too many allocations "don't guess - measure" Test your allocations in tests