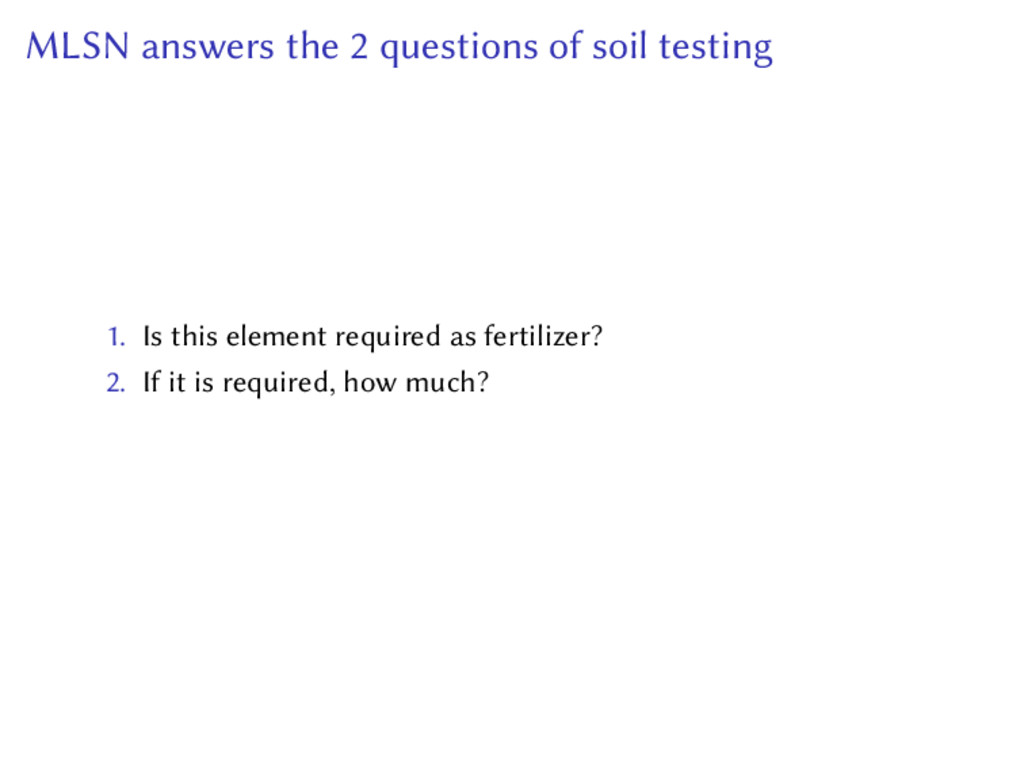
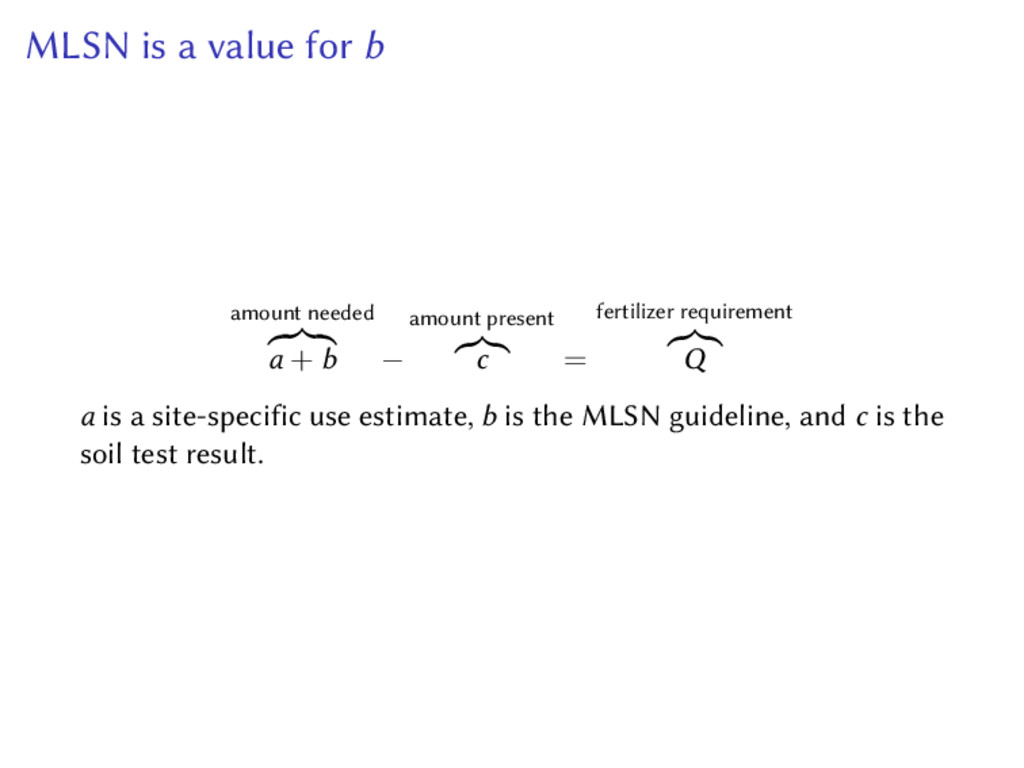
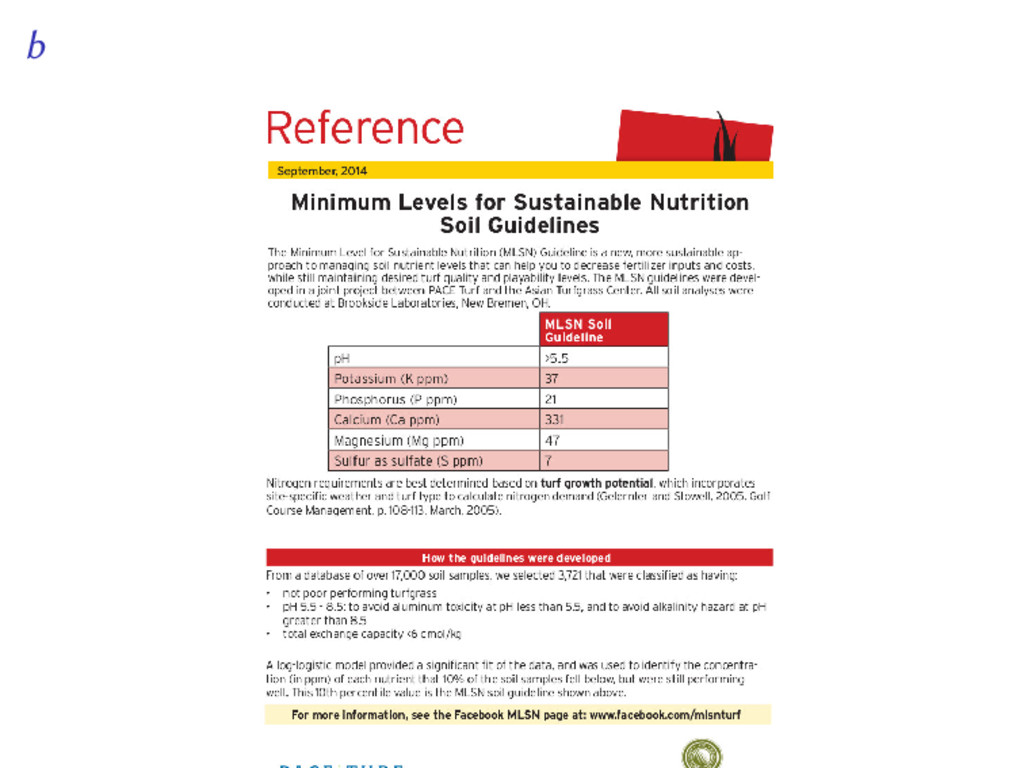
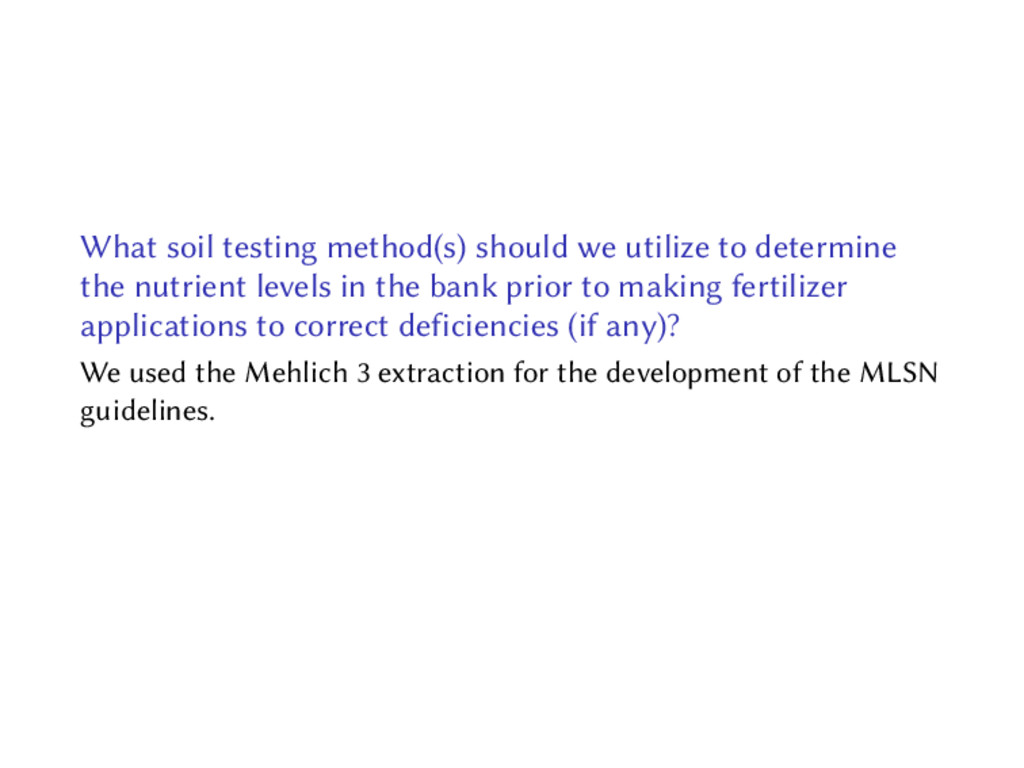
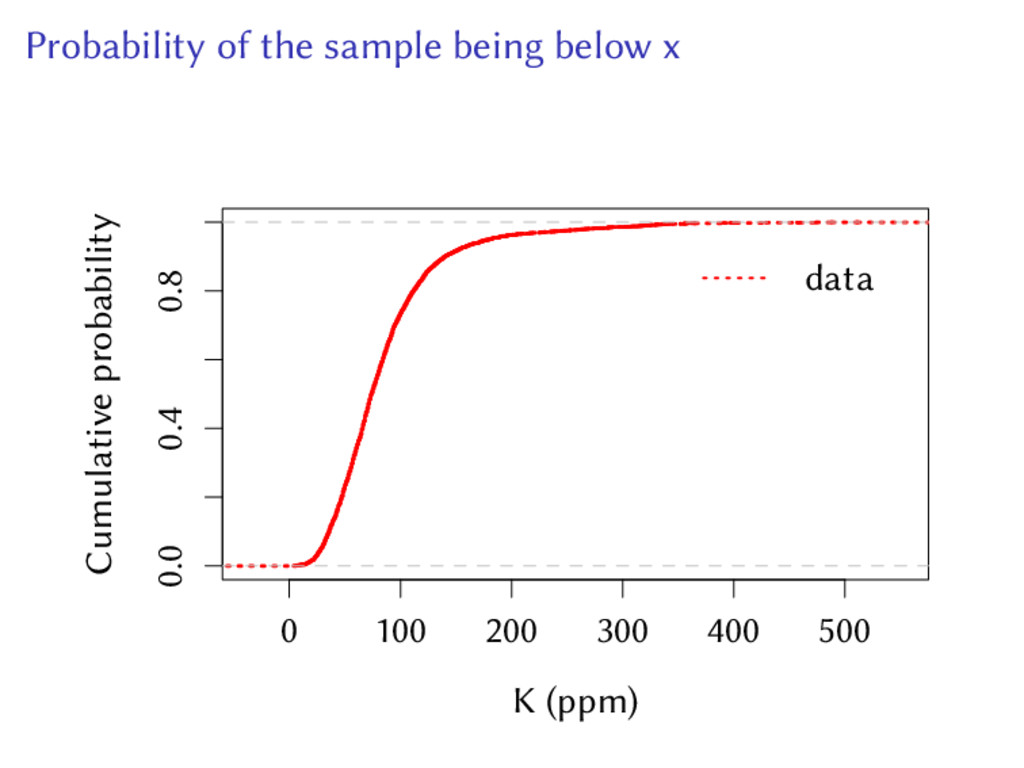
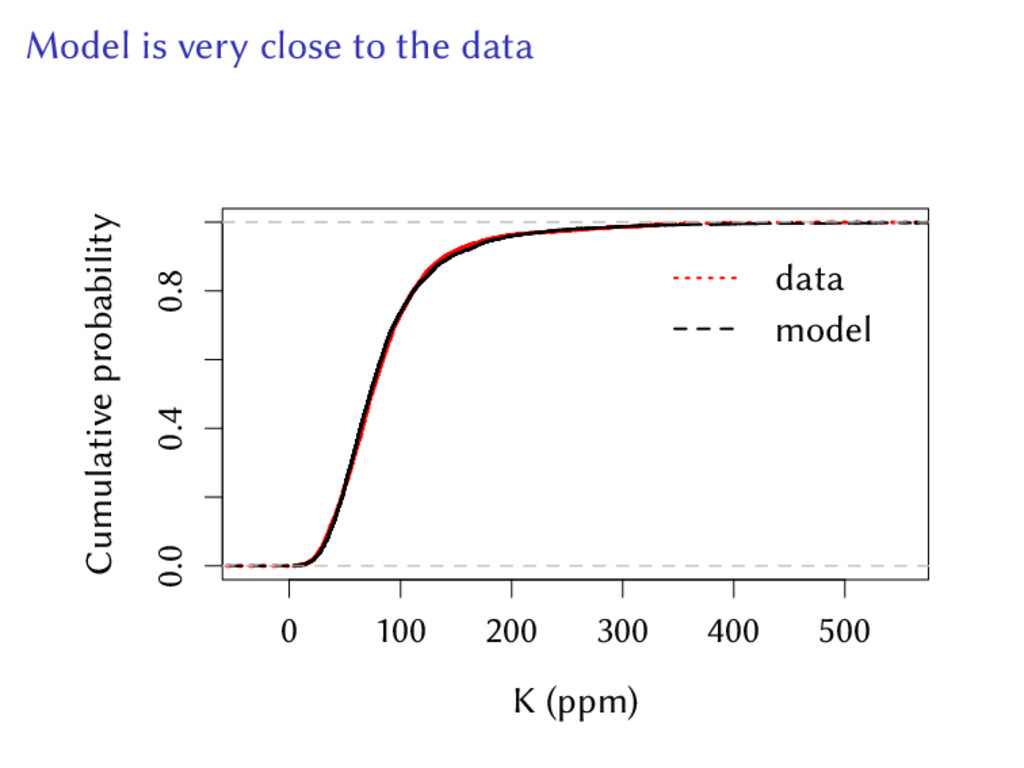
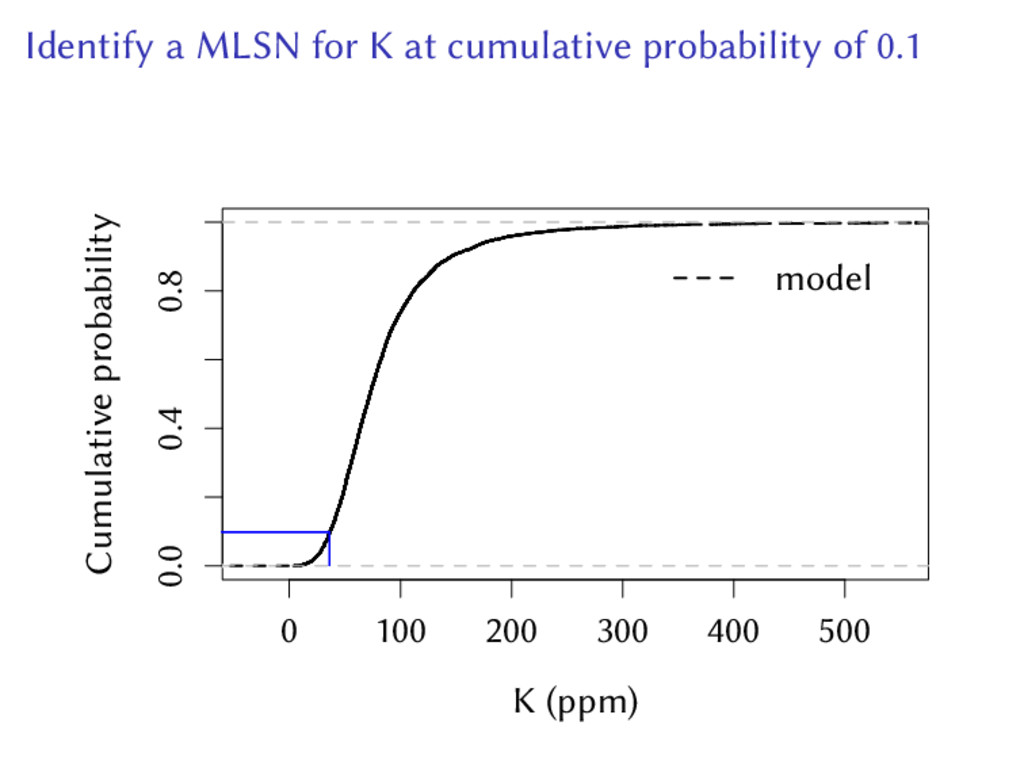
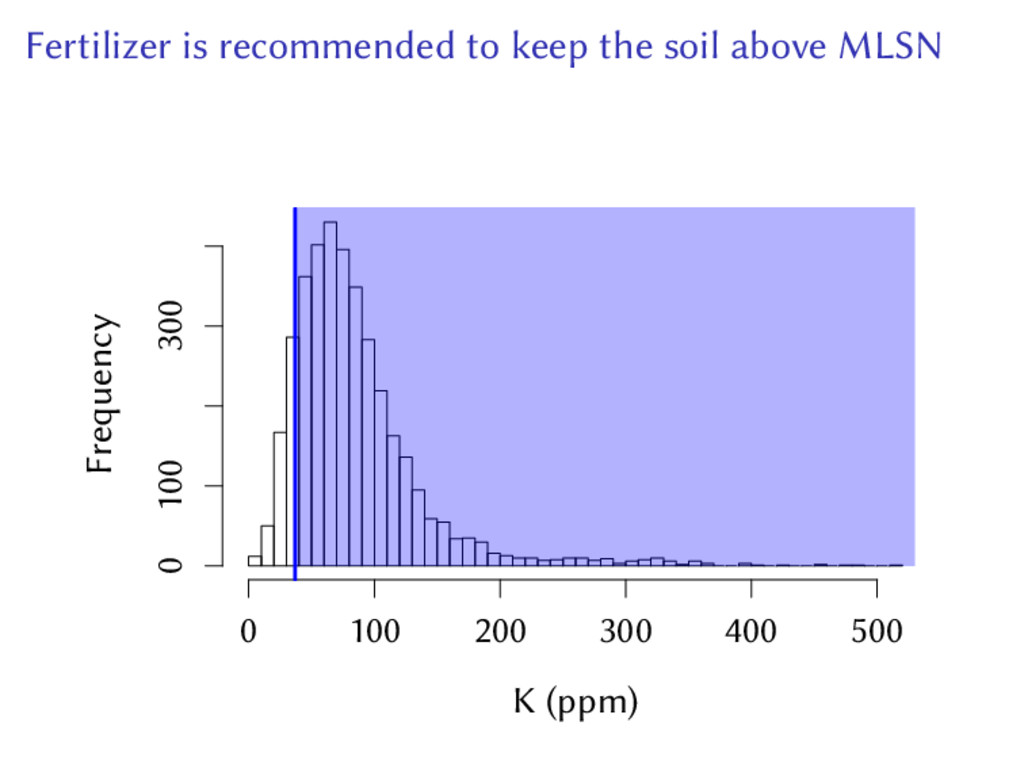
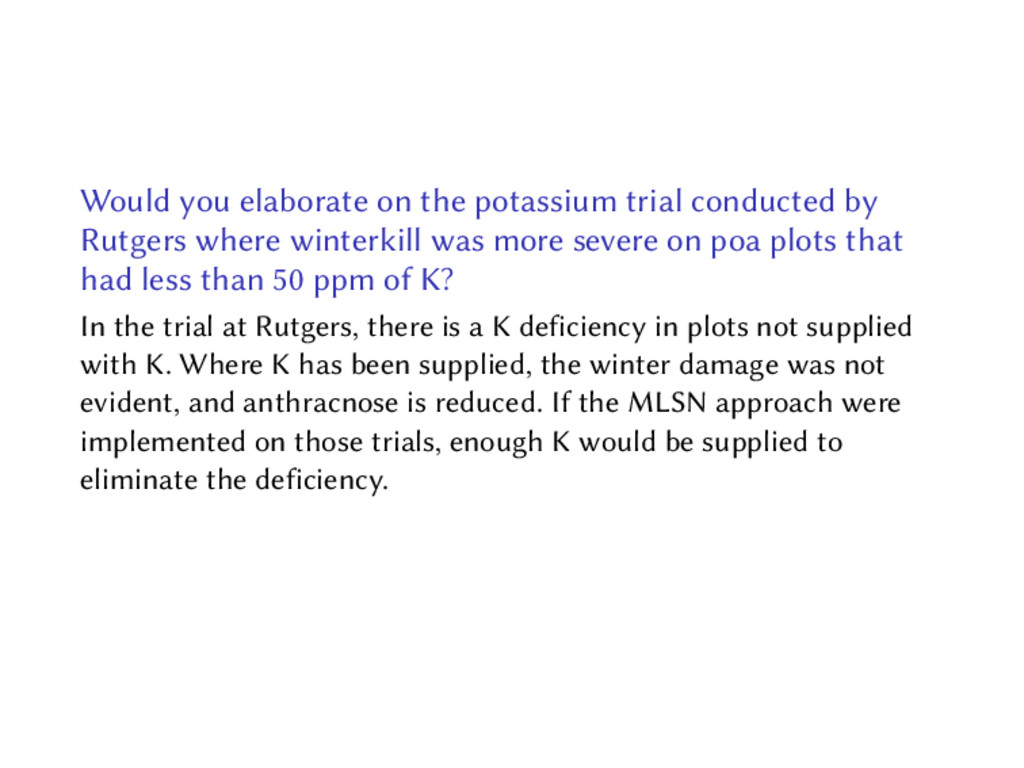
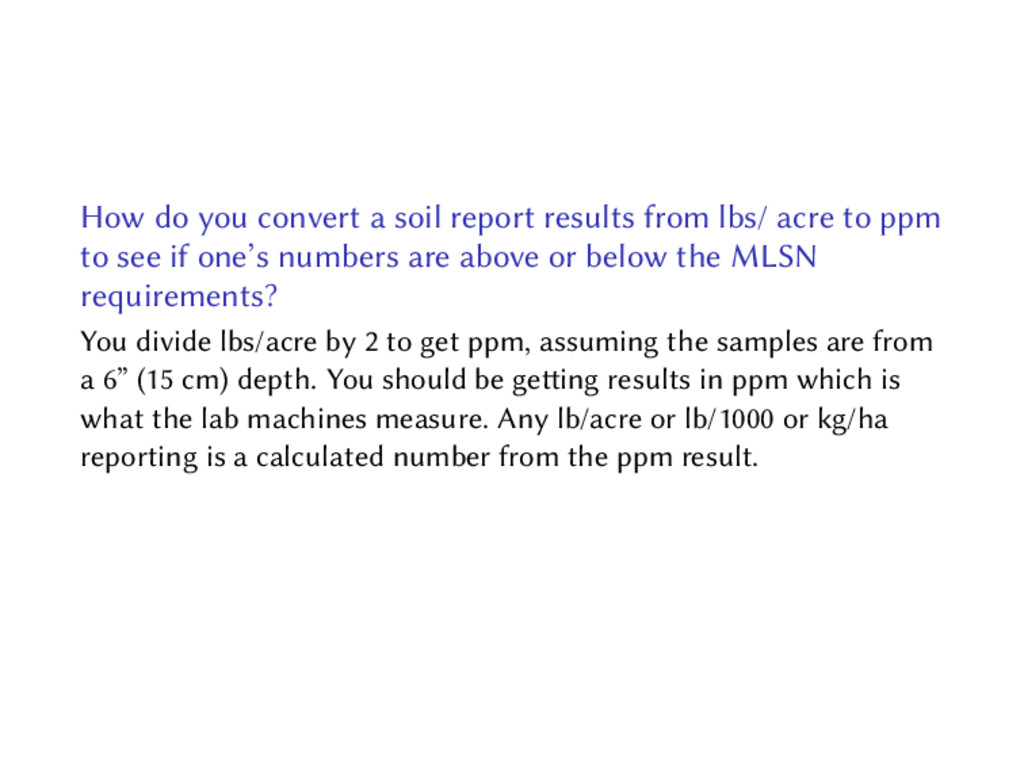
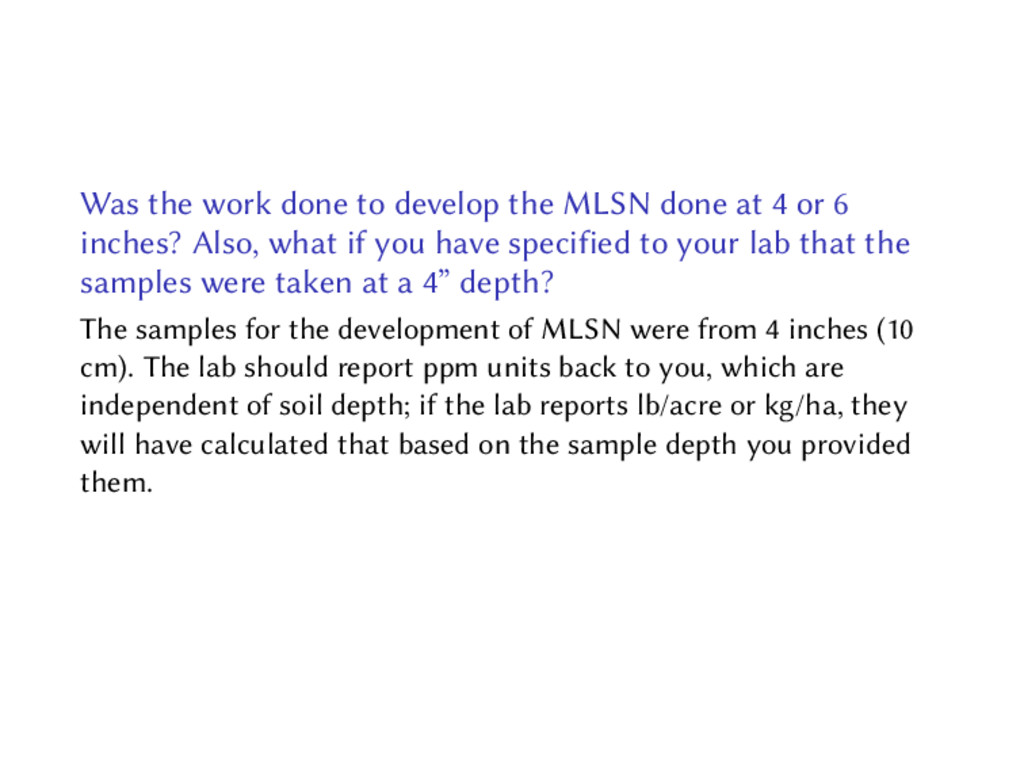
The presentation explains the MLSN guidelines and answers questions about their development and use. The MLSN guidelines work like this.
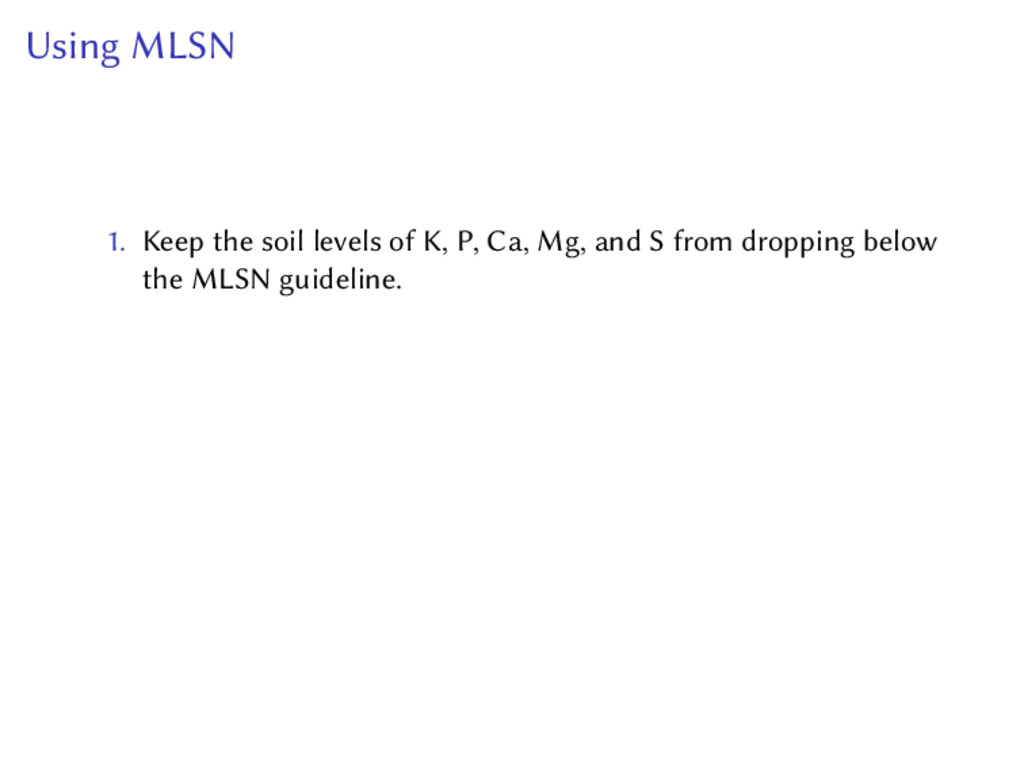
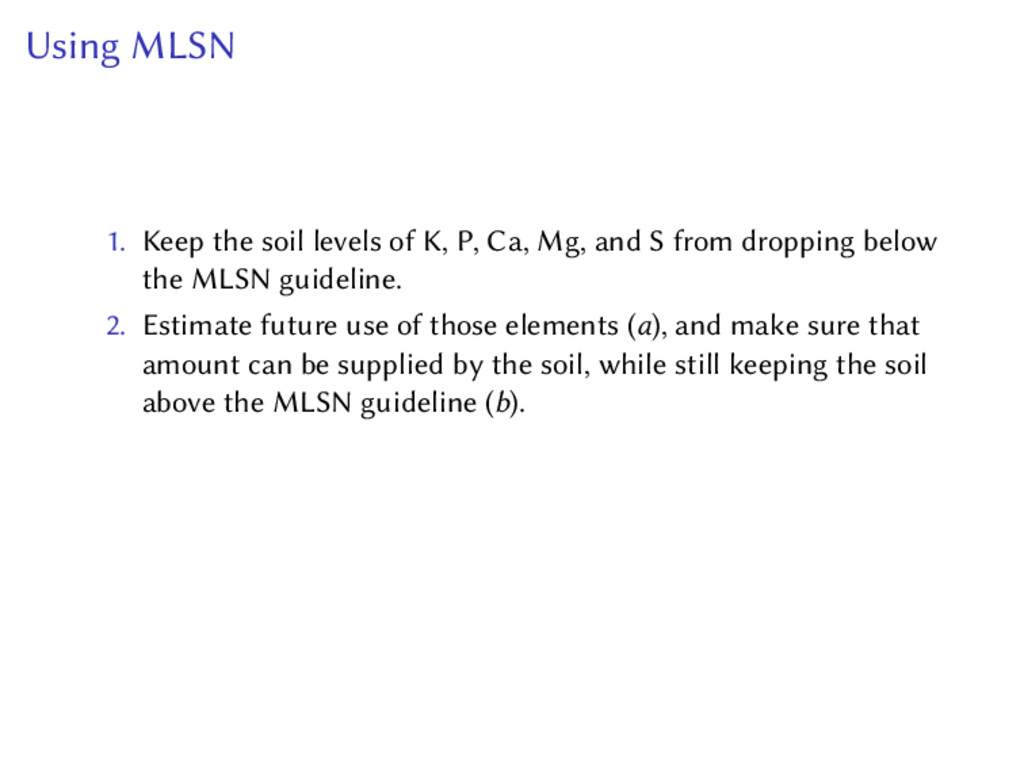
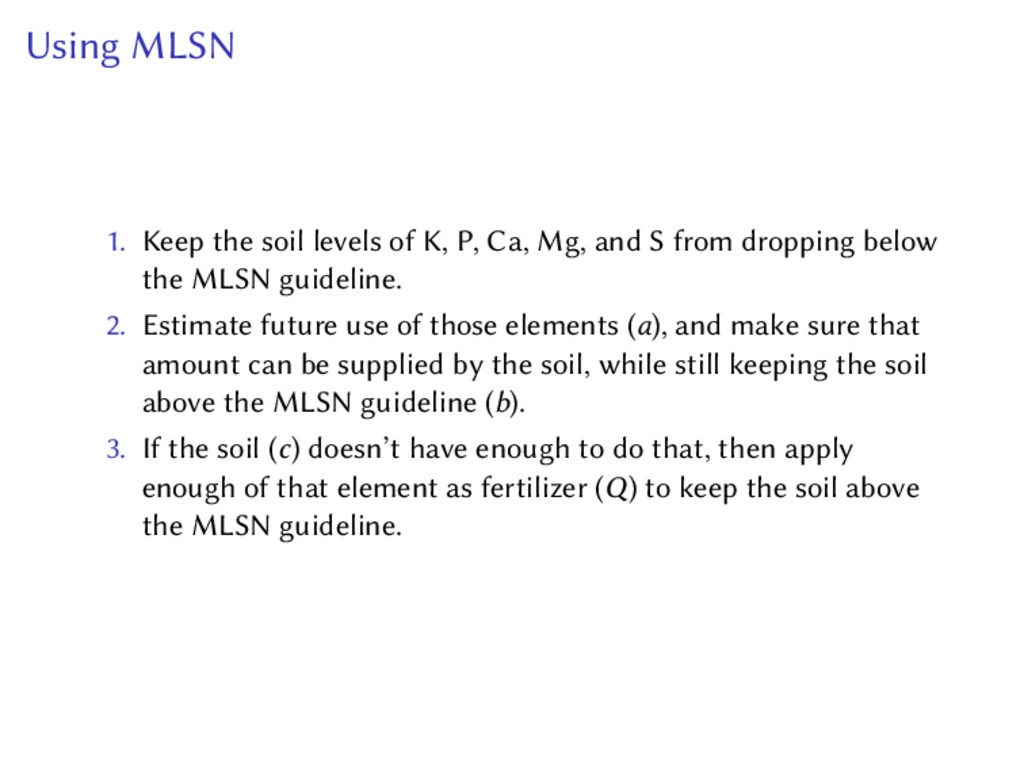
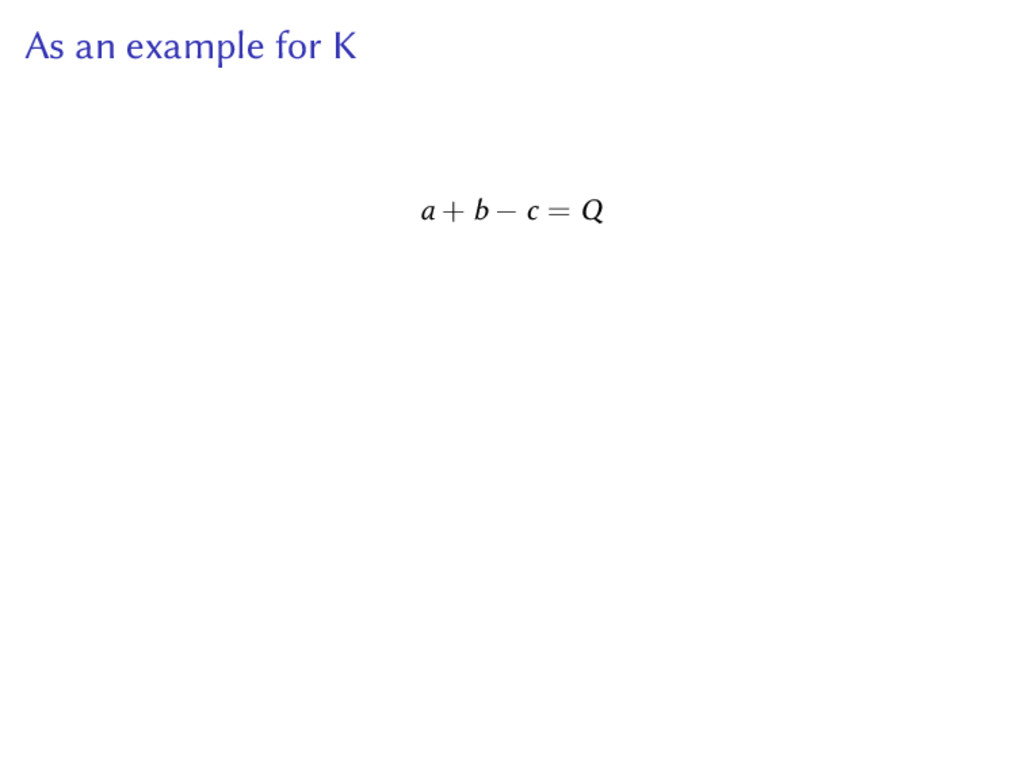
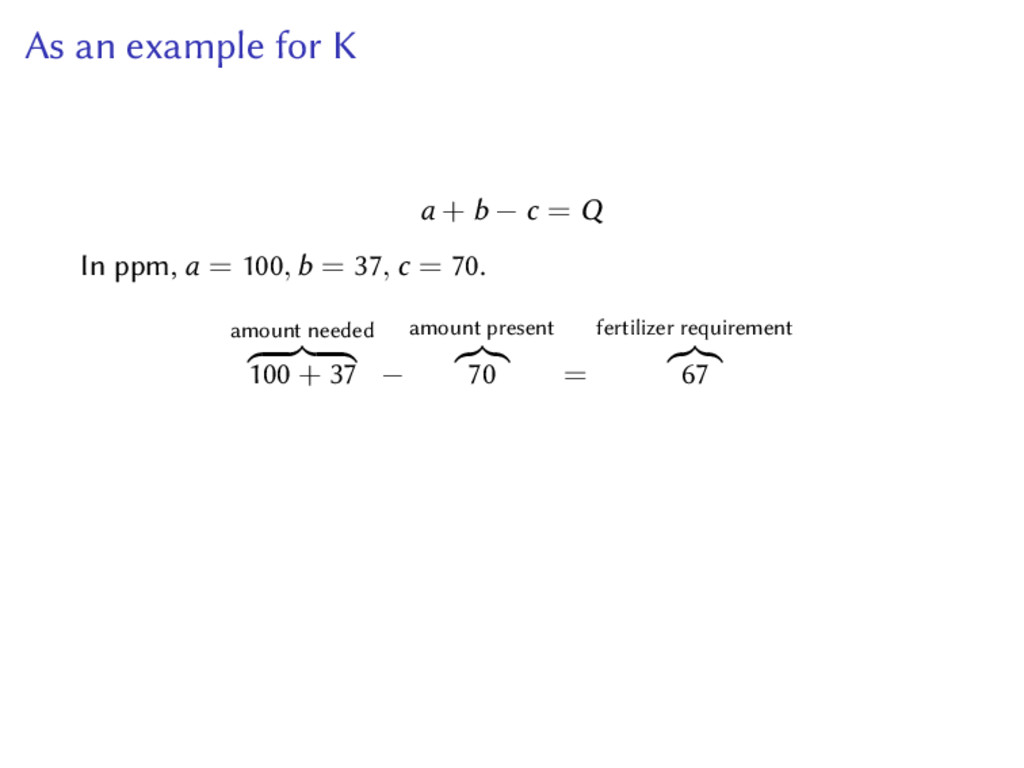
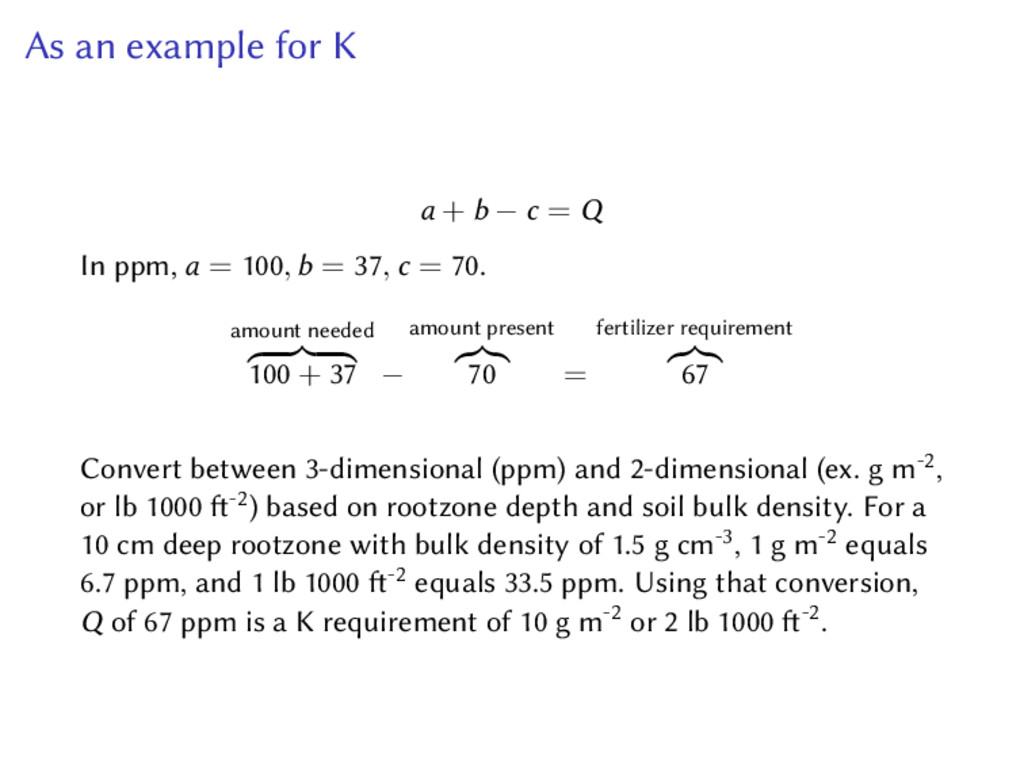
1. Keep the soil levels of K, P, Ca, Mg, and S from dropping below the MLSN guideline.
2. Estimate future use of those elements, and make sure that amount can be supplied by the soil, while still keeping the soil above the MLSN guideline.
3. If the soil doesn't have enough to do that, then apply enough of that element as fertilizer to keep the soil above the MLSN guideline.