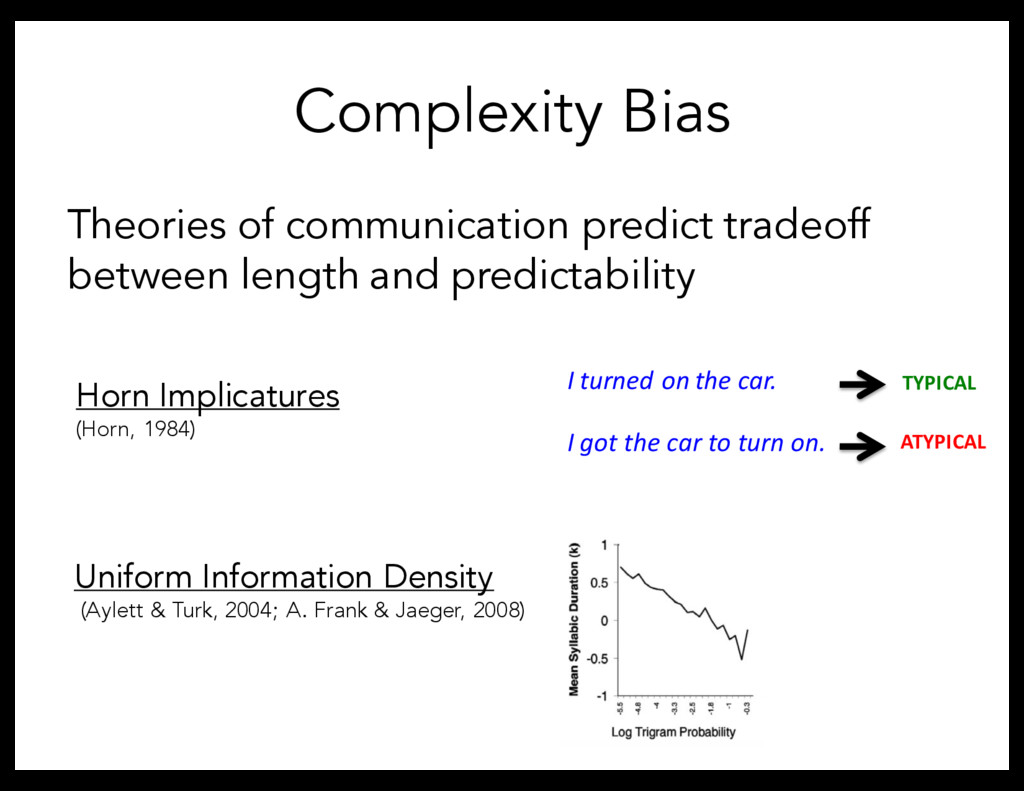
predictability Horn Implicatures (Horn, 1984) I turned on the car. I got the car to turn on. TYPICAL ATYPICAL Uniform Information Density (Aylett & Turk, 2004; A. Frank & Jaeger, 2008)
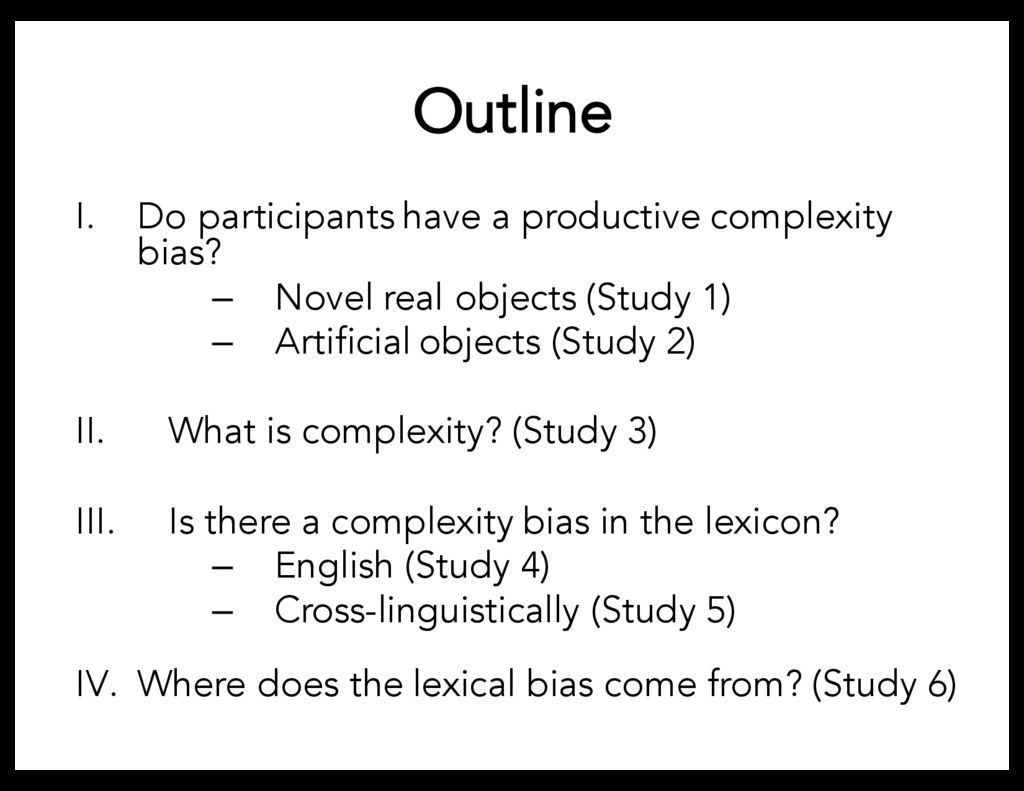
Novel real objects (Study 1) – Artificial objects (Study 2) II. What is complexity? (Study 3) III. Is there a complexity bias in the lexicon? – English (Study 4) – Cross-linguistically (Study 5) IV. Where does the lexical bias come from? (Study 6)
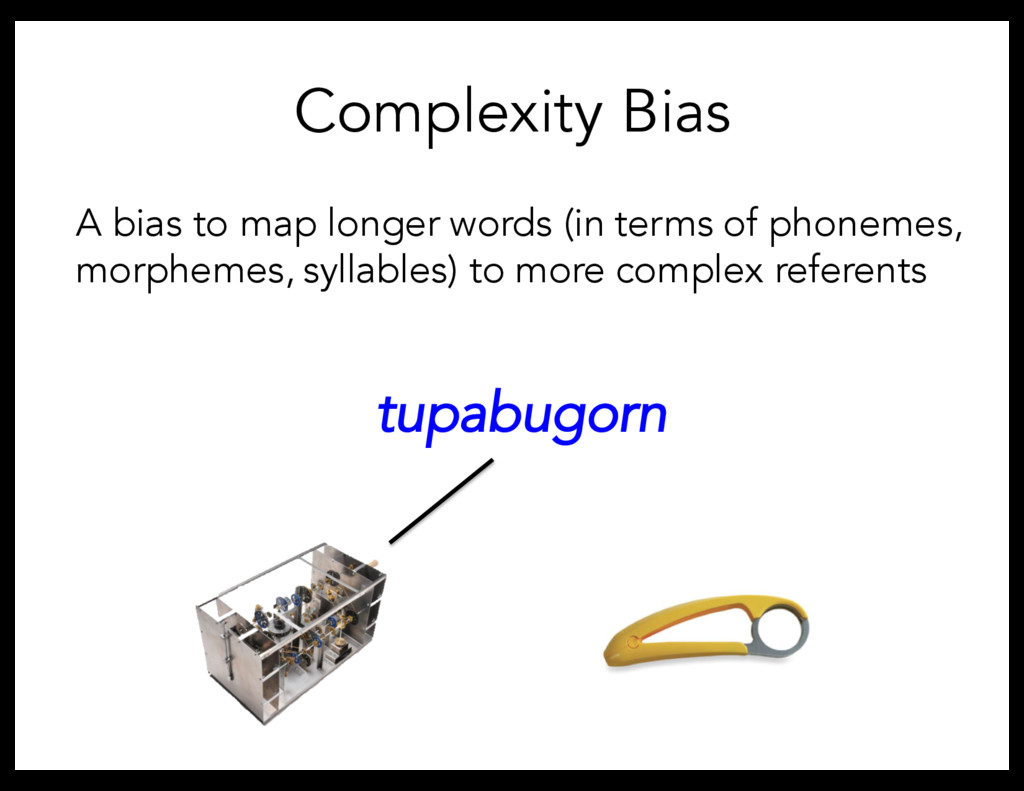
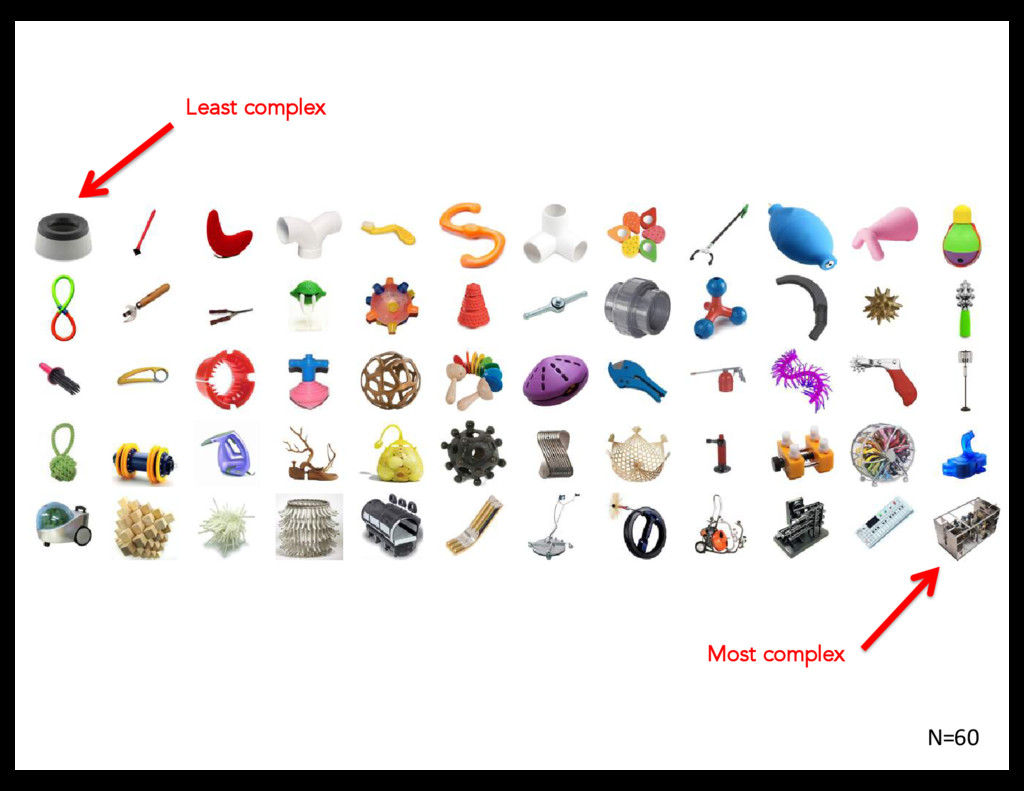
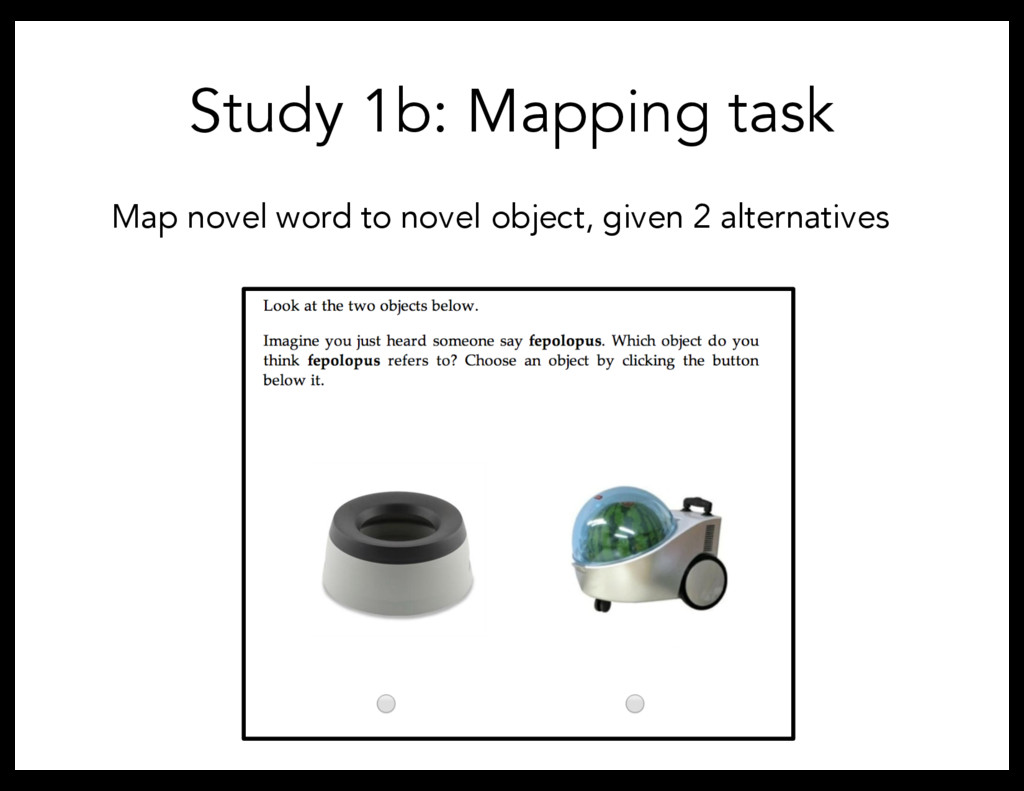
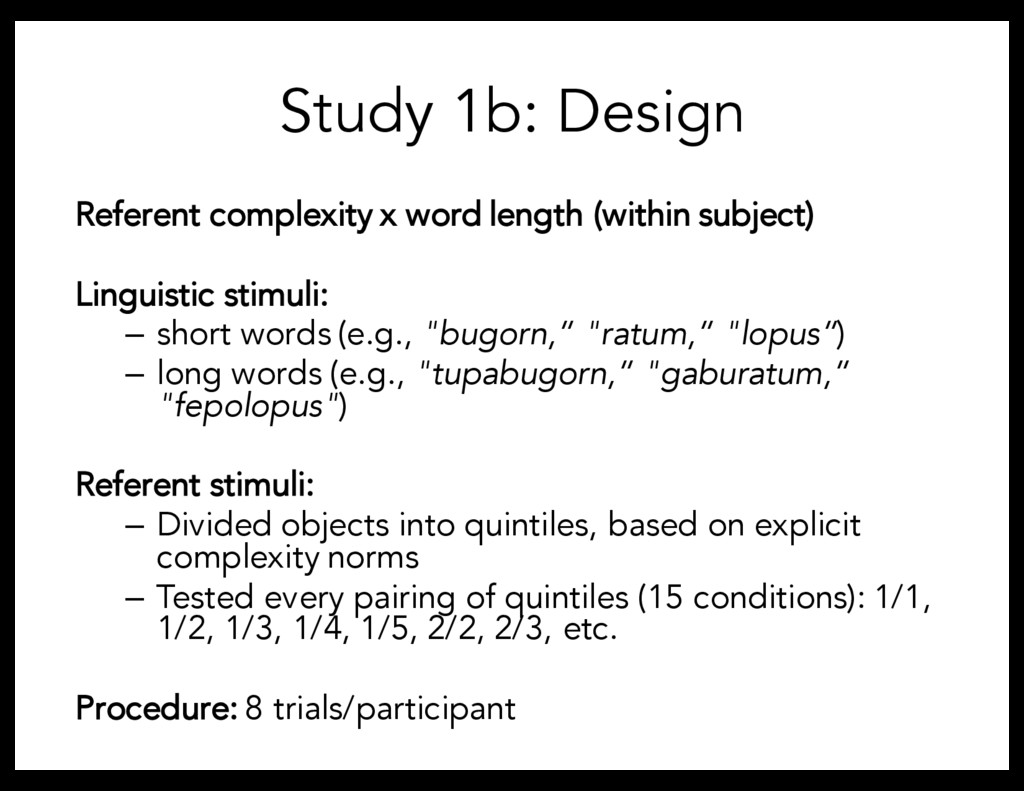
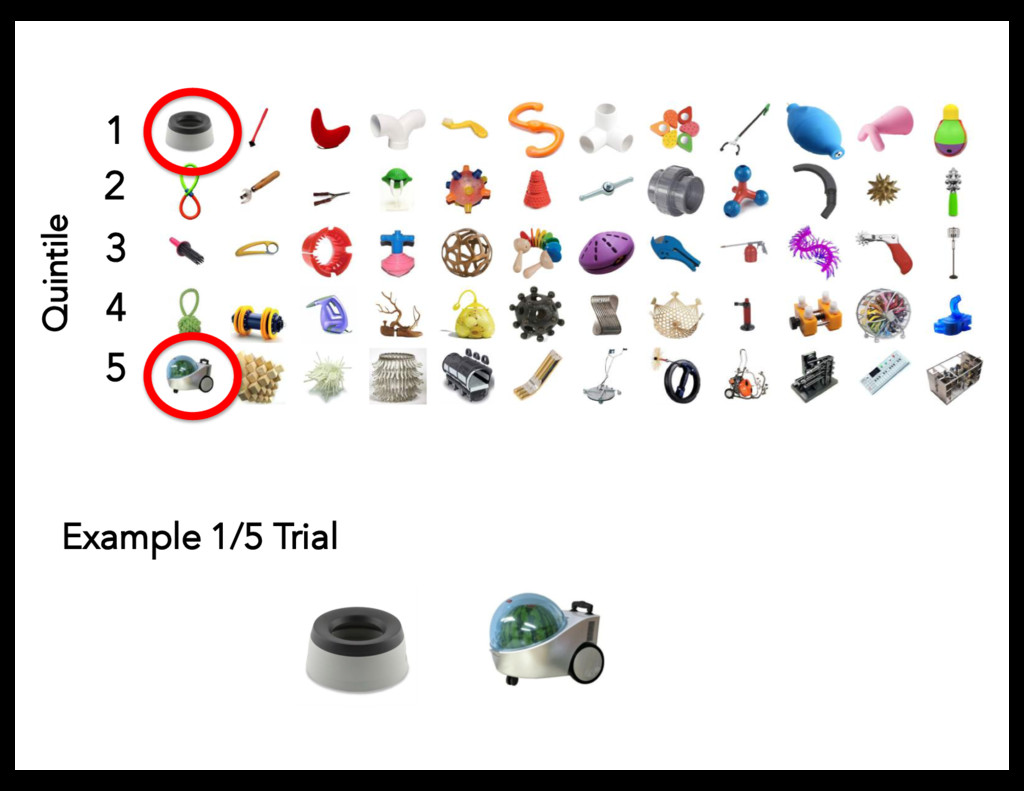
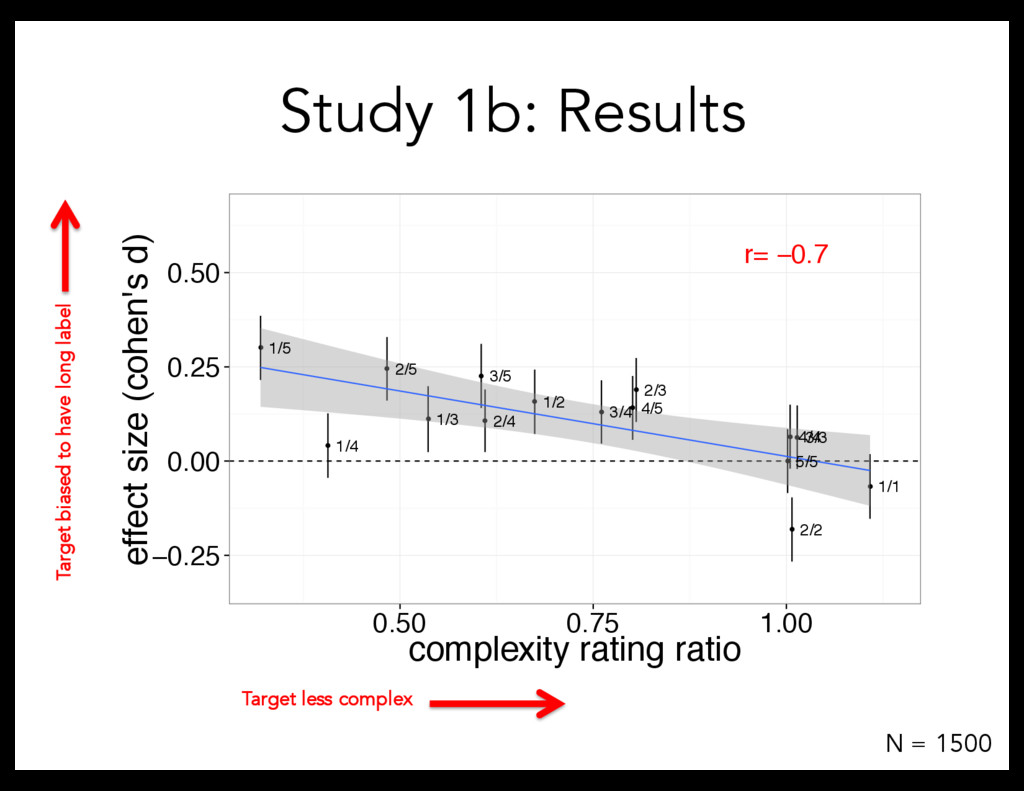
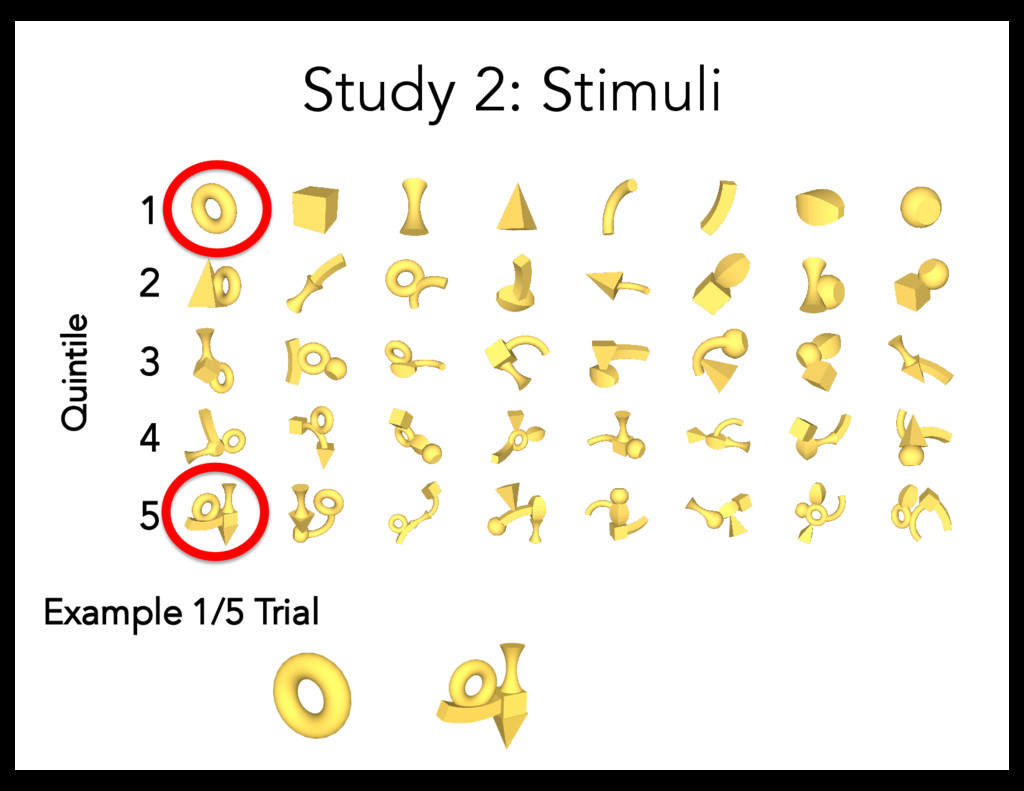
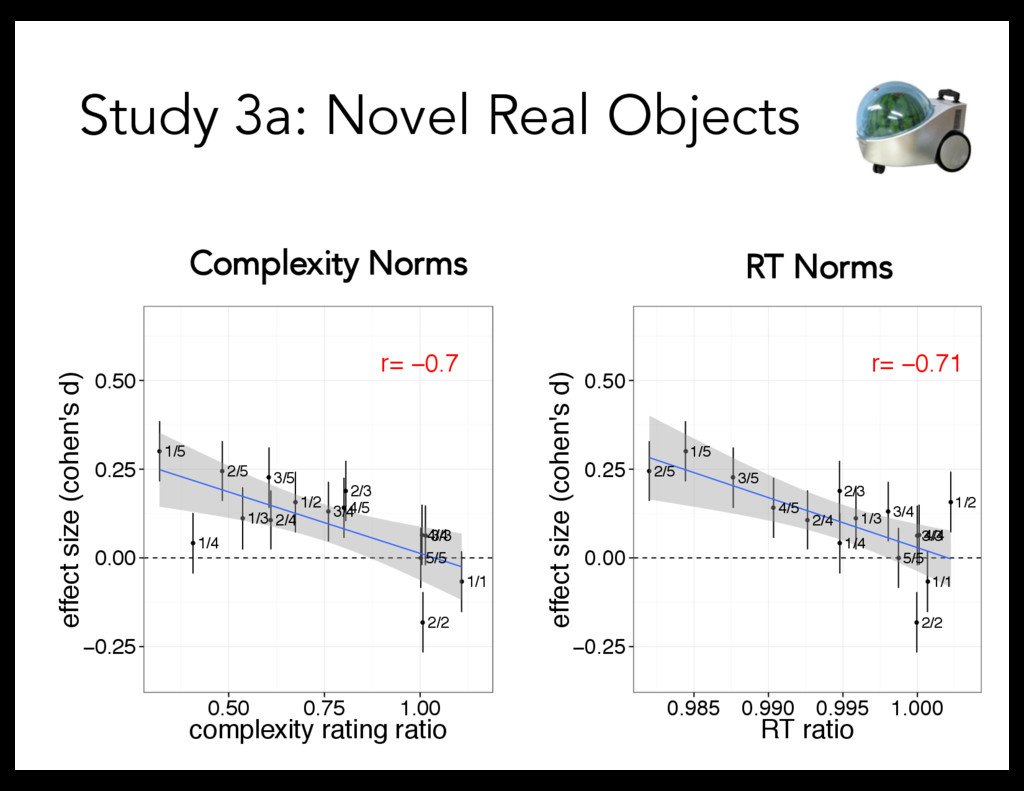
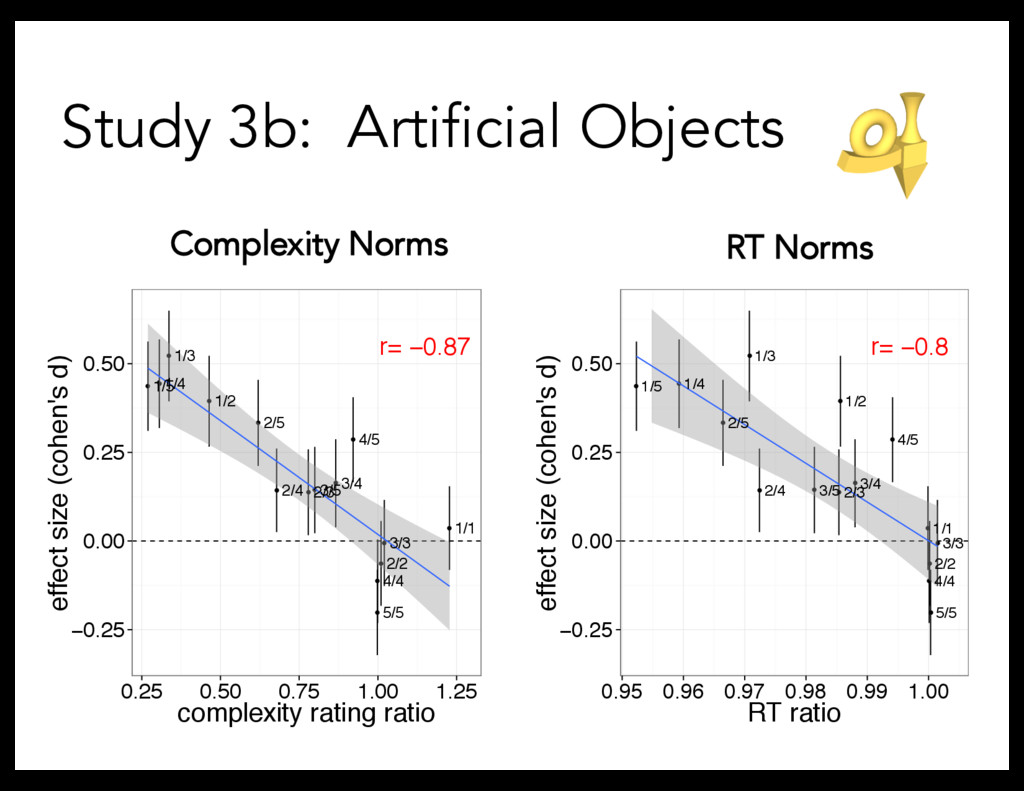
Linguistic stimuli: – short words (e.g., "bugorn,” "ratum,” "lopus”) – long words (e.g., "tupabugorn,” "gaburatum,” "fepolopus") Referent stimuli: – Divided objects into quintiles, based on explicit complexity norms – Tested every pairing of quintiles (15 conditions): 1/1, 1/2, 1/3, 1/4, 1/5, 2/2, 2/3, etc. Procedure: 8 trials/participant
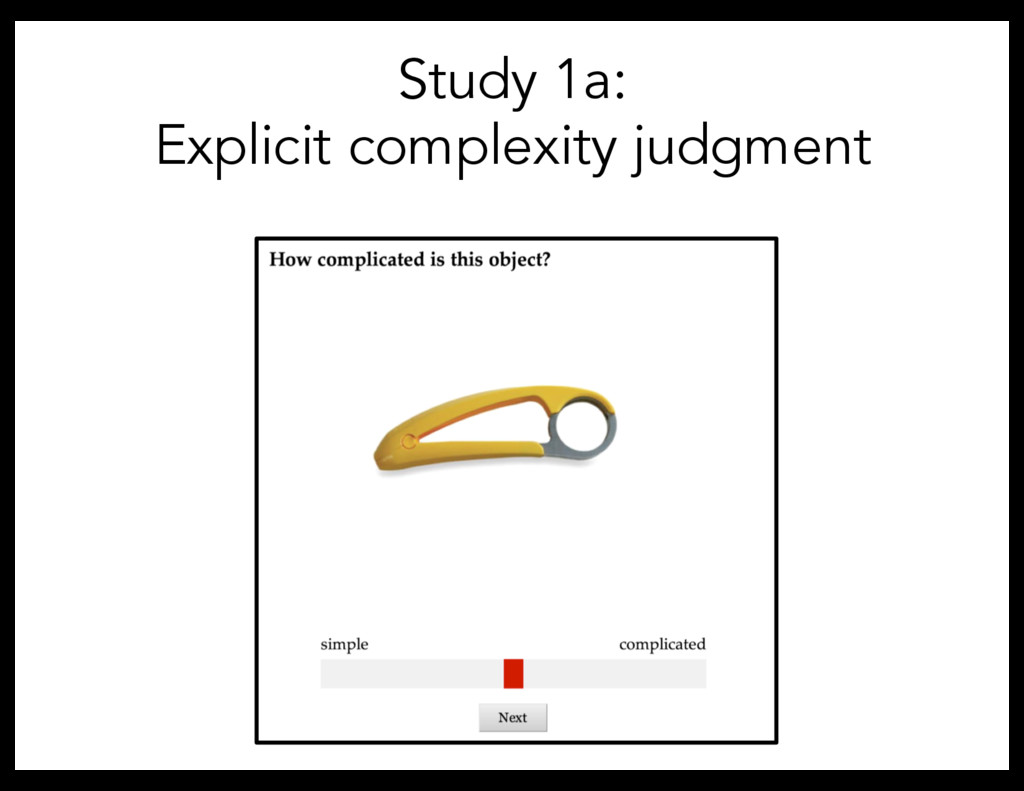
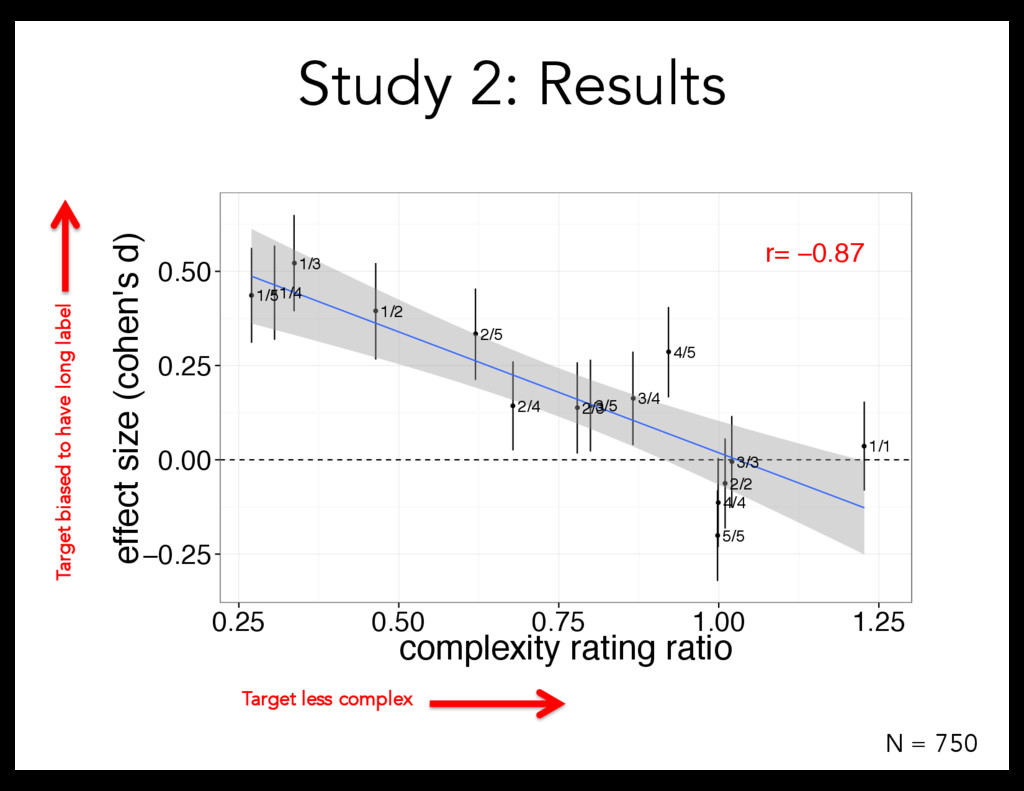
task But: manipulate complexity correlationally (difficult to interpret causation) Study 2: Direct manipulation of complexity Is there a productive complexity bias?
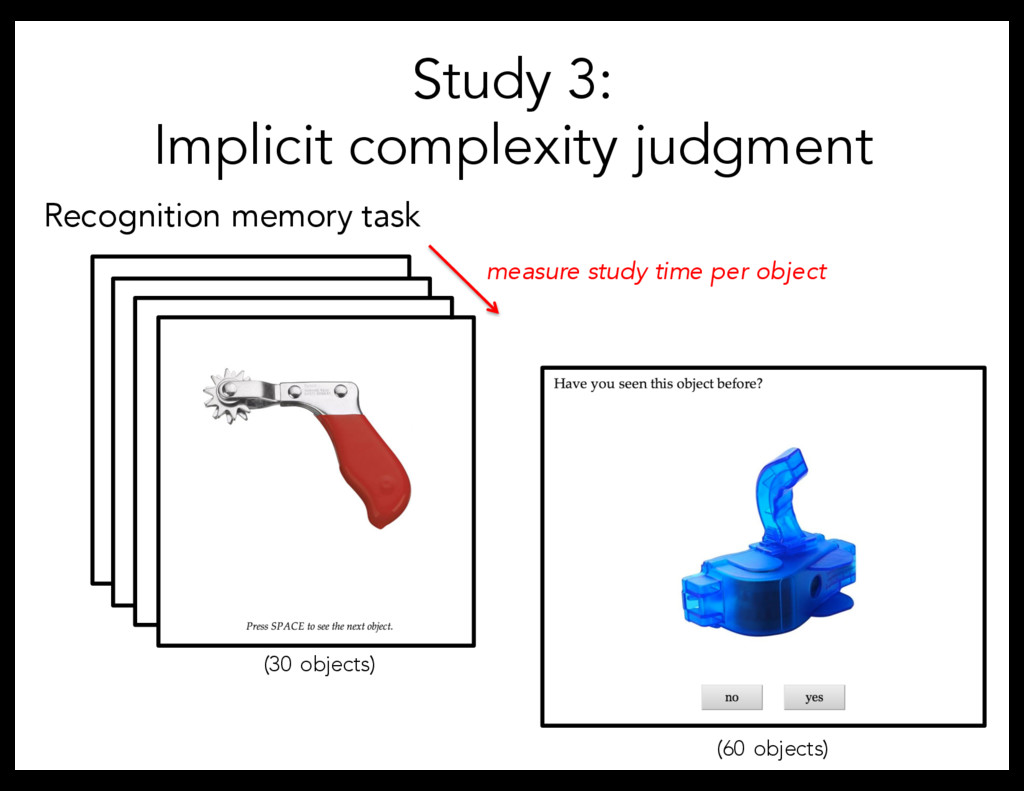
– Manipulating complexity both correlationally and directly Complexity quantified in terms of visual complexity But: What is the underlying complexity construct? What is complexity?
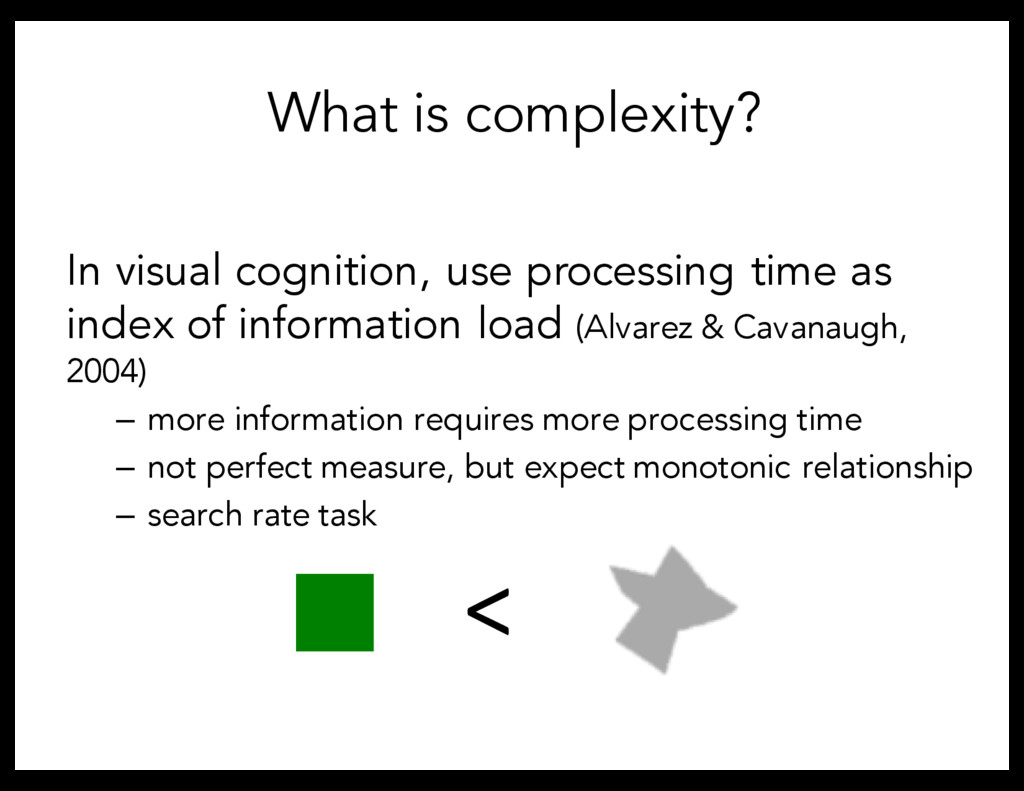
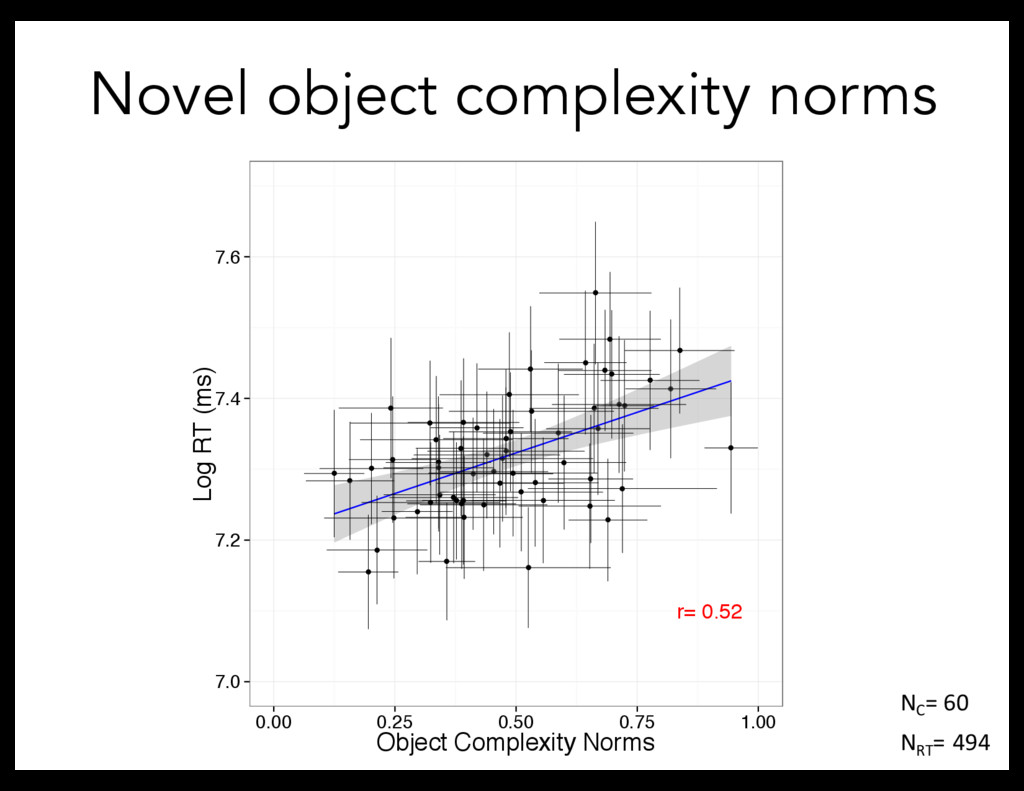
load (Alvarez & Cavanaugh, 2004) – more information requires more processing time – not perfect measure, but expect monotonic relationship – search rate task < What is complexity?
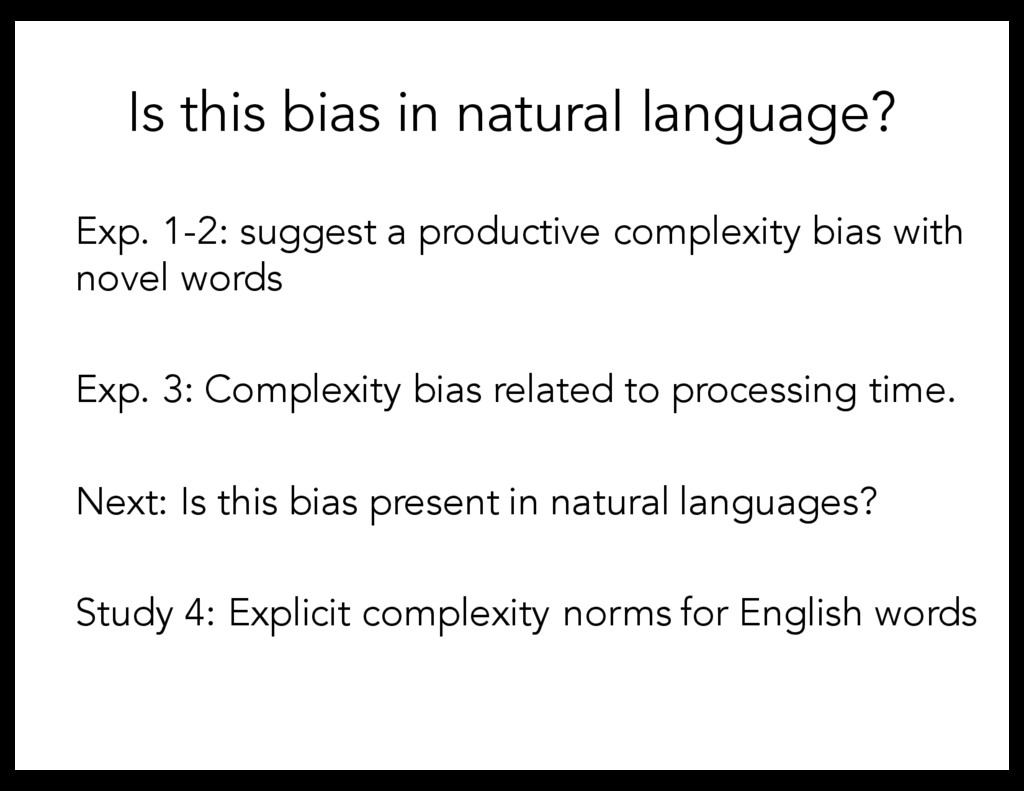
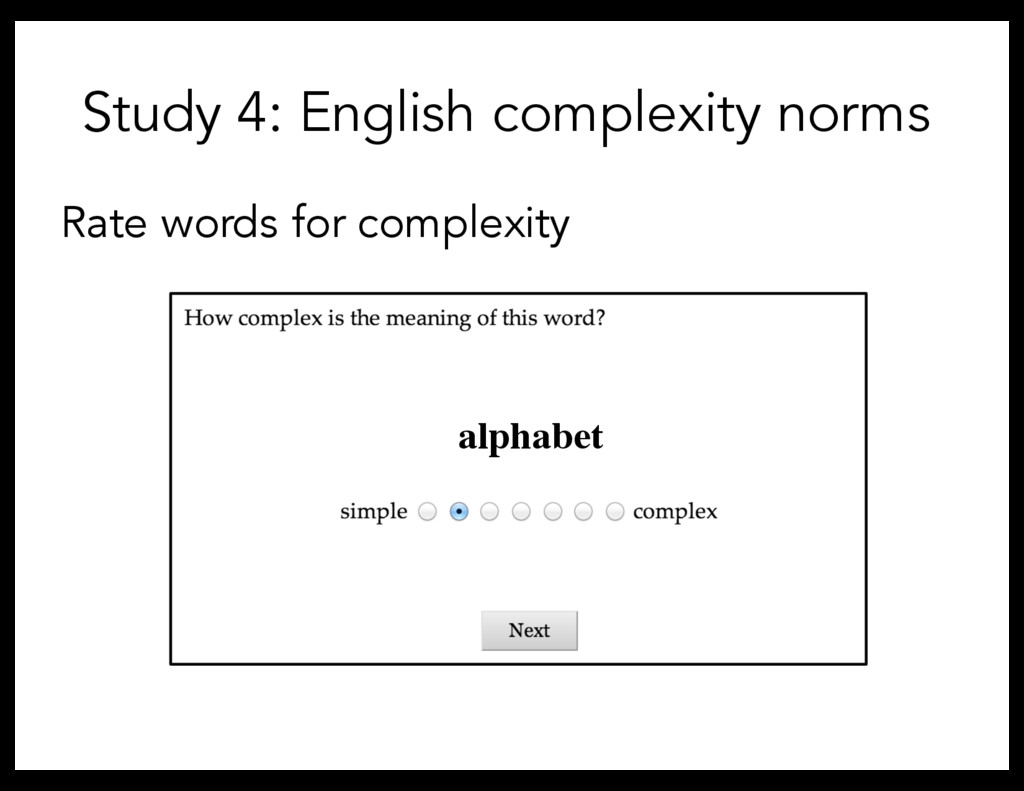
Exp. 3: Complexity bias related to processing time. Next: Is this bias present in natural languages? Study 4: Explicit complexity norms for English words Is this bias in natural language?
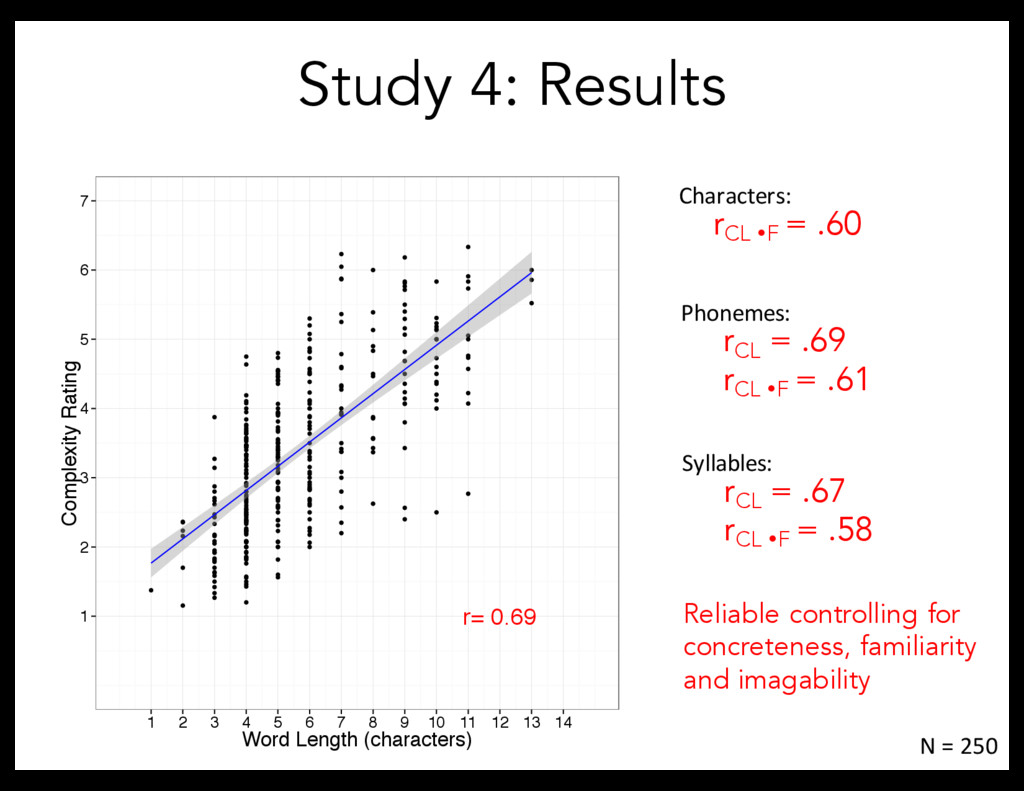
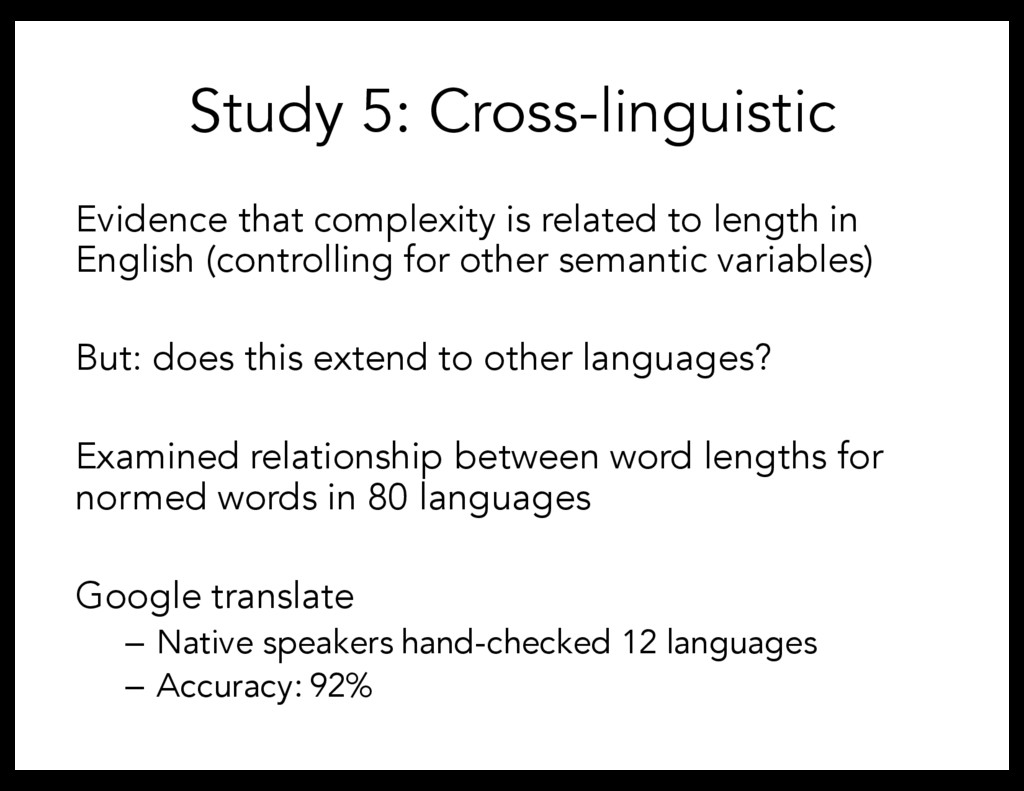
in English (controlling for other semantic variables) But: does this extend to other languages? Examined relationship between word lengths for normed words in 80 languages Google translate – Native speakers hand-checked 12 languages – Accuracy: 92%
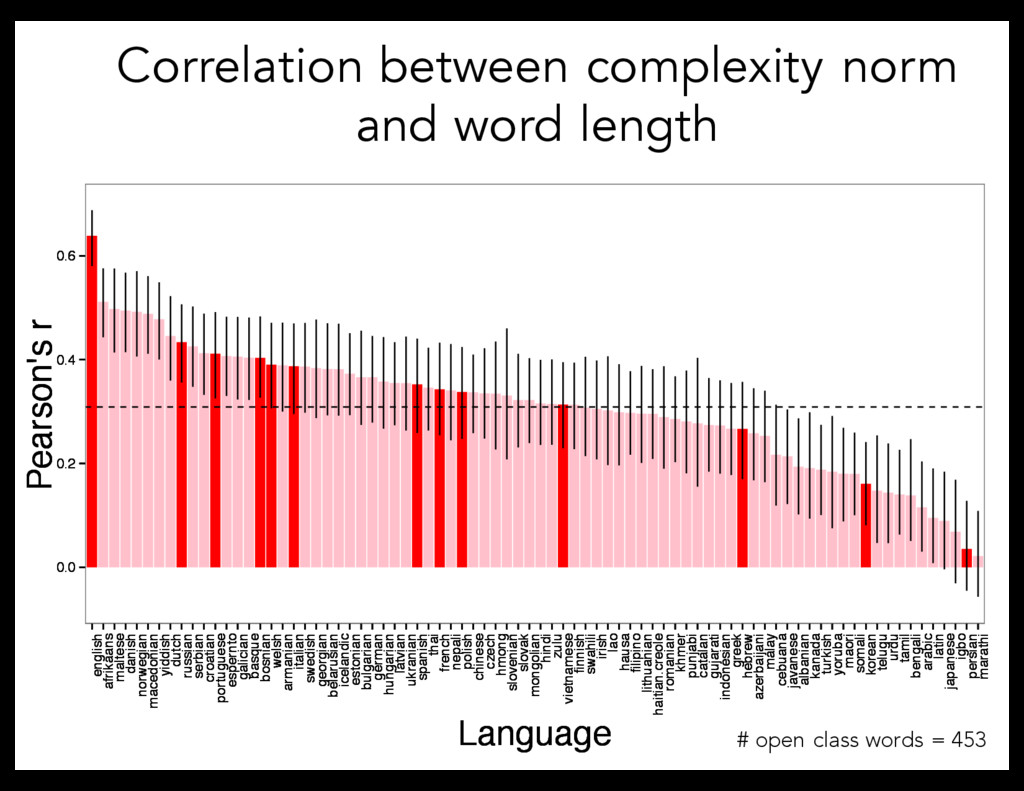
yiddish dutch russian serbian croatian portuguese espernto galician basque bosnian welsh armanian italian swedish georgian belarusian icelandic estonian bulgarian german hungarian latvian ukranian spanish thai french nepali polish chinese czech hmong slovenian slovak mongolian hindi zulu vietnamese finnish swahili irish lao hausa filipino lithuanian haitian.creole romanian khmer punjabi catalan gujarati indonesian greek hebrew azerbaijani malay cebuana javanese albanian kanada turkish yoruba maori somali korean telugu urdu tamil bengali arabic latin japanese igbo persian marathi Language Pearson's r 0.0 0.2 0.4 0.6 english afrikaans maltese danish norwegian macedonian yiddish dutch russian serbian croatian portuguese espernto galician basque bosnian welsh armanian italian swedish georgian belarusian icelandic estonian bulgarian german hungarian latvian ukranian spanish thai french nepali polish chinese czech hmong slovenian slovak mongolian hindi zulu vietnamese finnish swahili irish lao hausa filipino lithuanian haitian.creole romanian khmer punjabi catalan gujarati indonesian greek hebrew azerbaijani malay cebuana javanese albanian kanada turkish yoruba maori somali korean telugu urdu tamil bengali arabic latin japanese igbo persian marathi Language Pearson's r 0.0 0.2 0.4 0.6 english afrikaans maltese danish norwegian macedonian yiddish dutch russian serbian croatian portuguese espernto galician basque bosnian welsh armanian italian swedish georgian belarusian icelandic estonian bulgarian german hungarian latvian ukranian spanish thai french nepali polish chinese czech hmong slovenian slovak mongolian hindi zulu vietnamese finnish swahili irish lao hausa filipino lithuanian haitian.creole romanian khmer punjabi catalan gujarati indonesian greek hebrew azerbaijani malay cebuana javanese albanian kanada turkish yoruba maori somali korean telugu urdu tamil bengali arabic latin japanese igbo persian marathi Language Pearson's r # open class words = 453 Correlation between complexity norm and word length
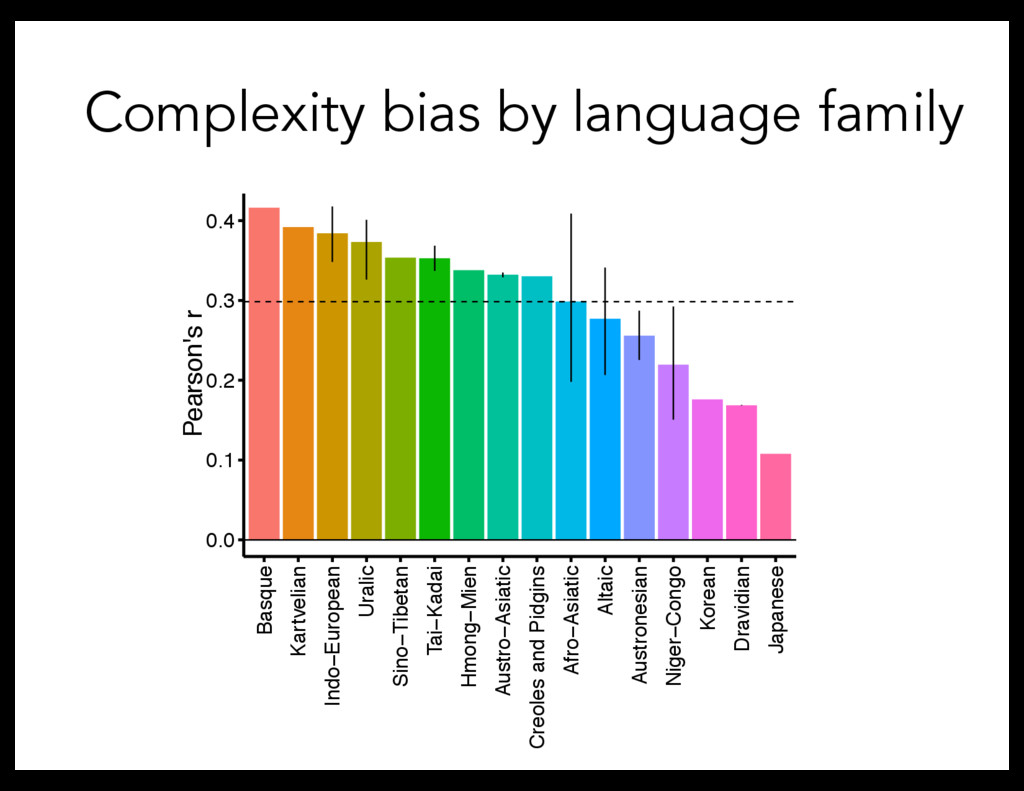
Basque Kartvelian Indo−European Uralic Sino−Tibetan Tai−Kadai Hmong−Mien Austro−Asiatic Creoles and Pidgins Afro−Asiatic Altaic Austronesian Niger−Congo Korean Dravidian Japanese Language Family Pearson's r Complexity bias by language family
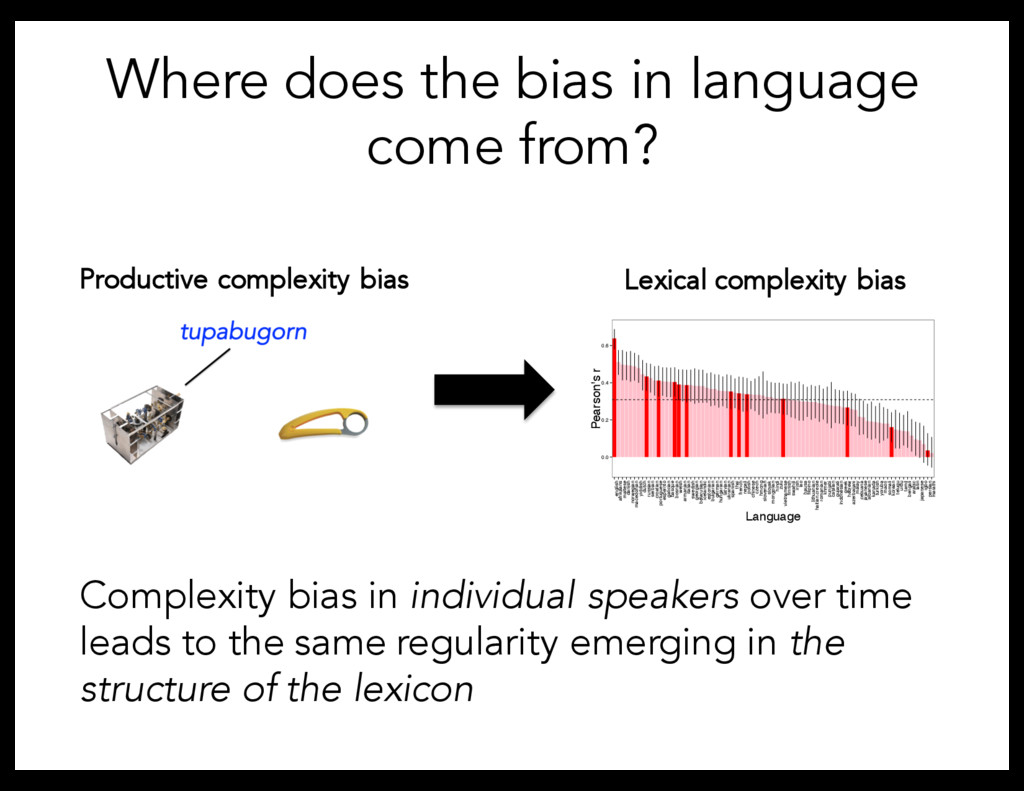
yiddish dutch russian serbian croatian portuguese espernto galician basque bosnian welsh armanian italian swedish georgian belarusian icelandic estonian bulgarian german hungarian latvian ukranian spanish thai french nepali polish chinese czech hmong slovenian slovak mongolian hindi zulu vietnamese finnish swahili irish lao hausa filipino lithuanian haitian.creole romanian khmer punjabi catalan gujarati indonesian greek hebrew azerbaijani malay cebuana javanese albanian kanada turkish yoruba maori somali korean telugu urdu tamil bengali arabic latin japanese igbo persian marathi Language Pearson's r Where does the bias in language come from? Complexity bias in individual speakers over time leads to the same regularity emerging in the structure of the lexicon Productive complexity bias Lexical complexity bias
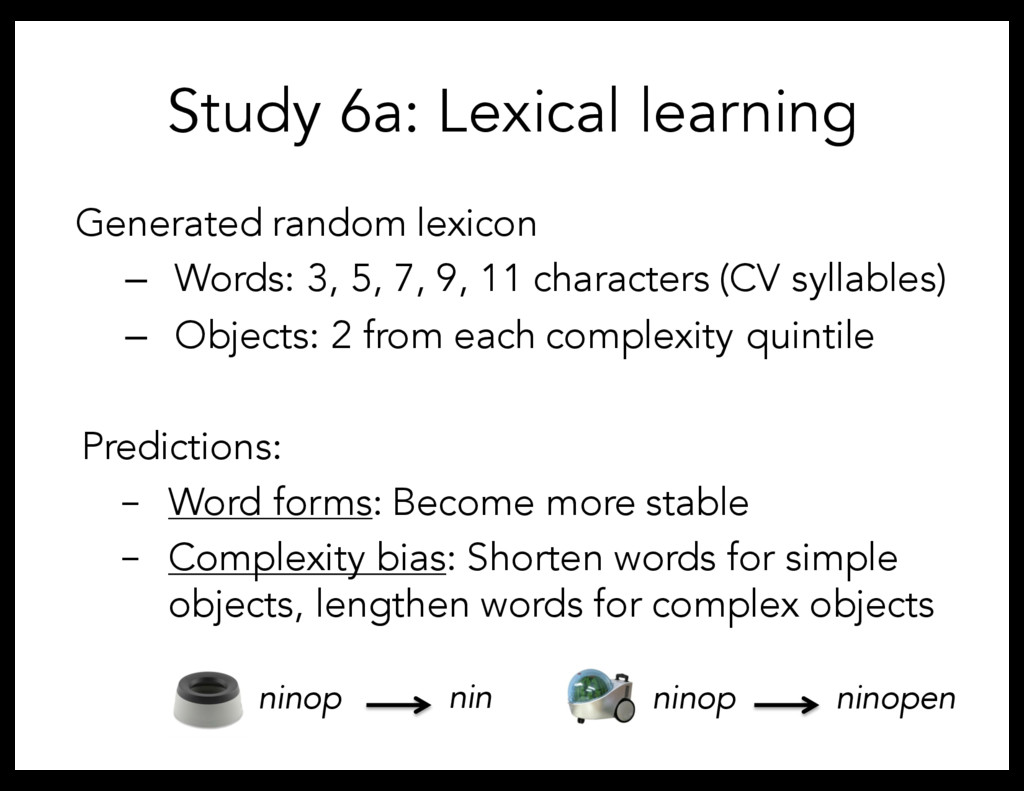
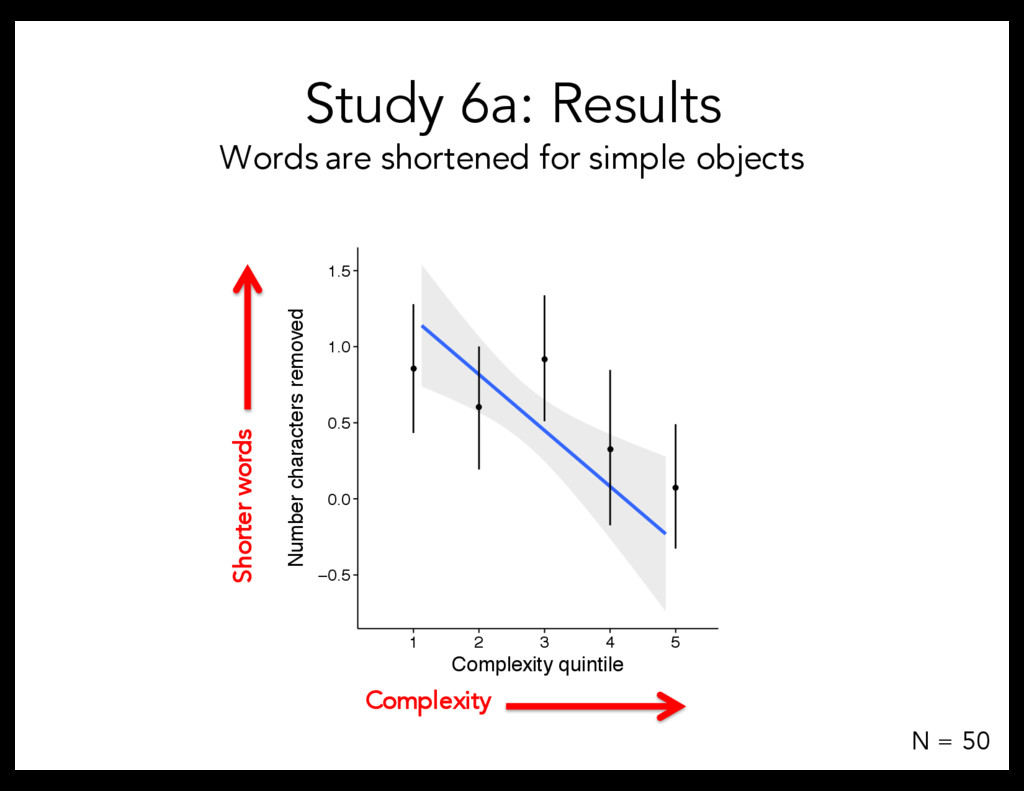
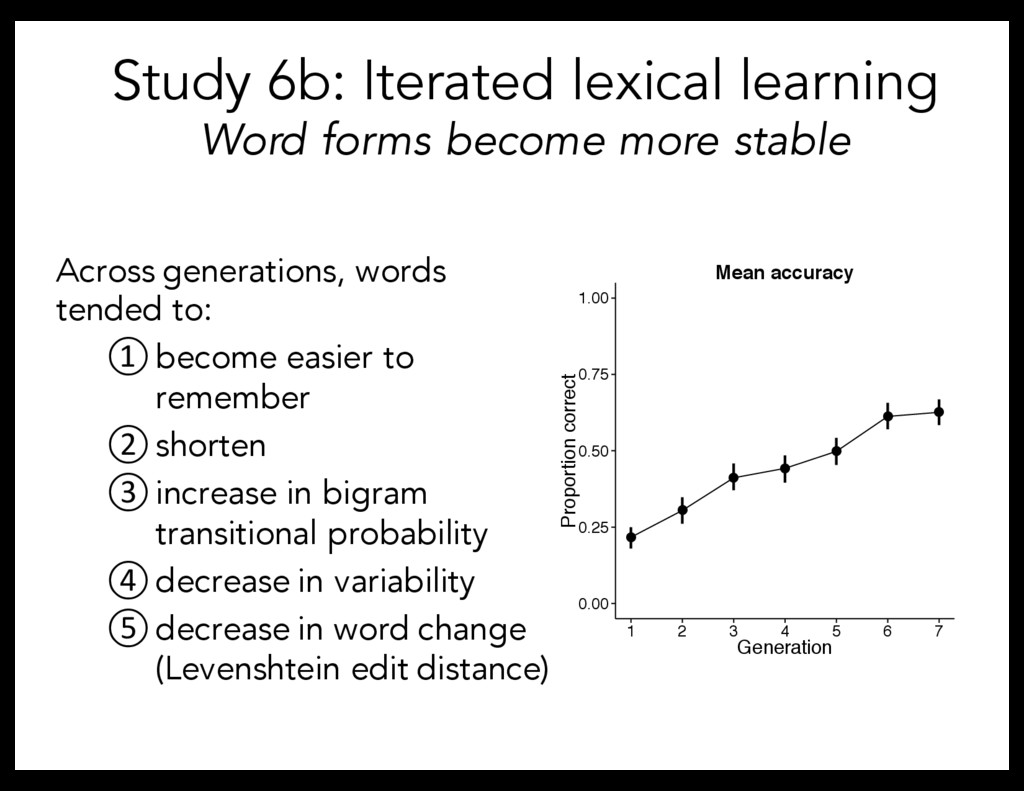
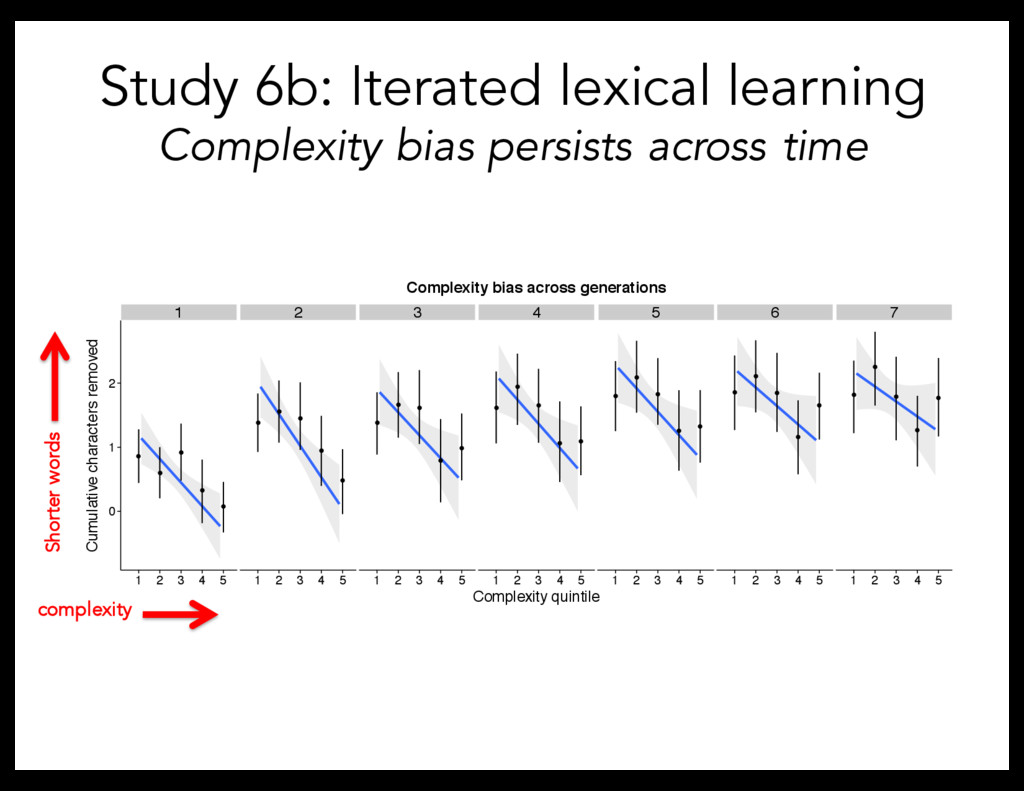
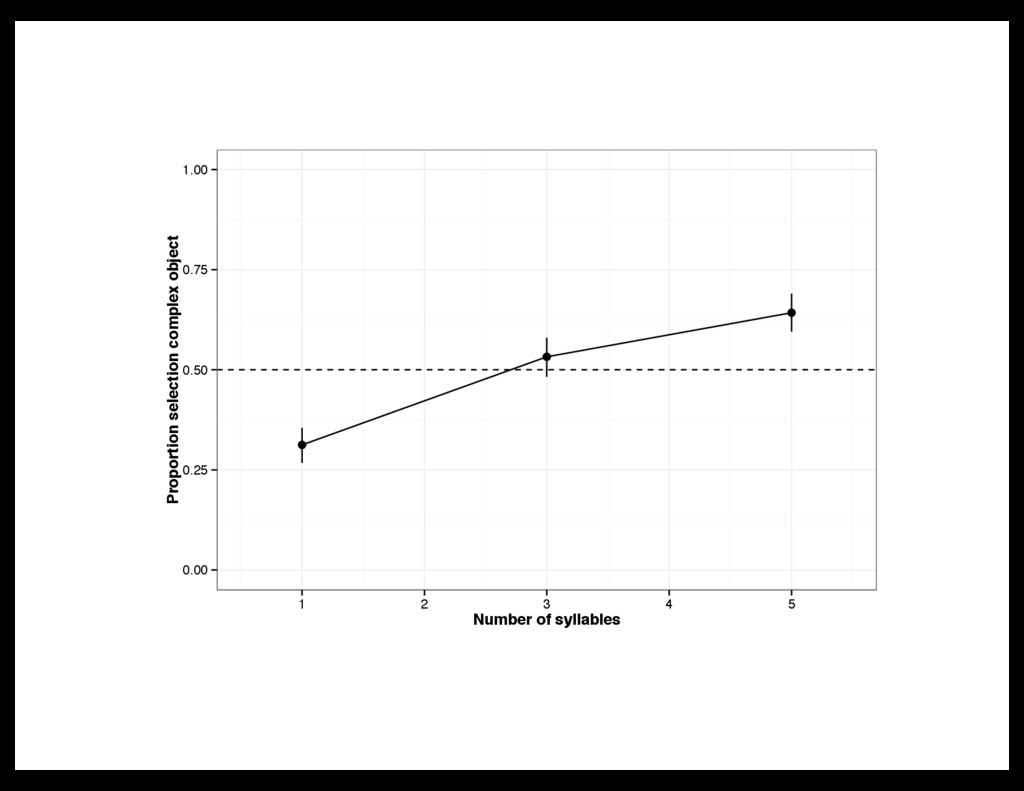
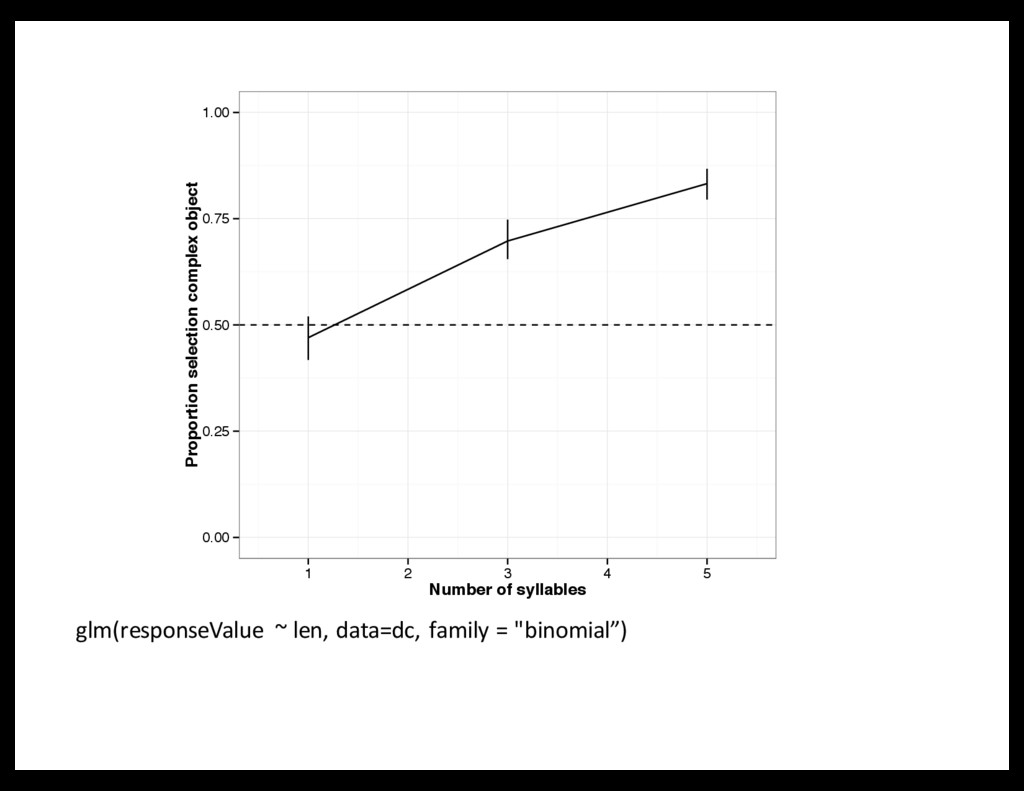
5, 7, 9, 11 characters (CV syllables) – Objects: 2 from each complexity quintile Predictions: - Word forms: Become more stable - Complexity bias: Shorten words for simple objects, lengthen words for complex objects ninop nin ninop ninopen
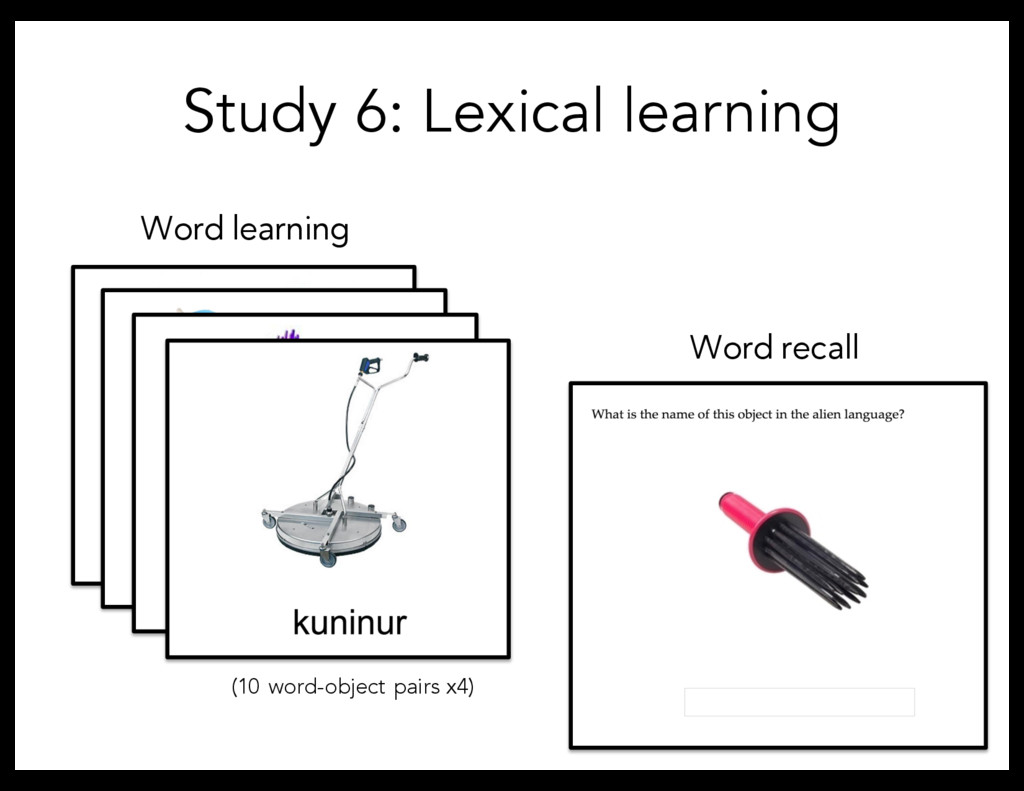
method for simulating language change Gave the labels generated by participants to a new set of participants Iterated for total of 7 generations 50 participants/generation
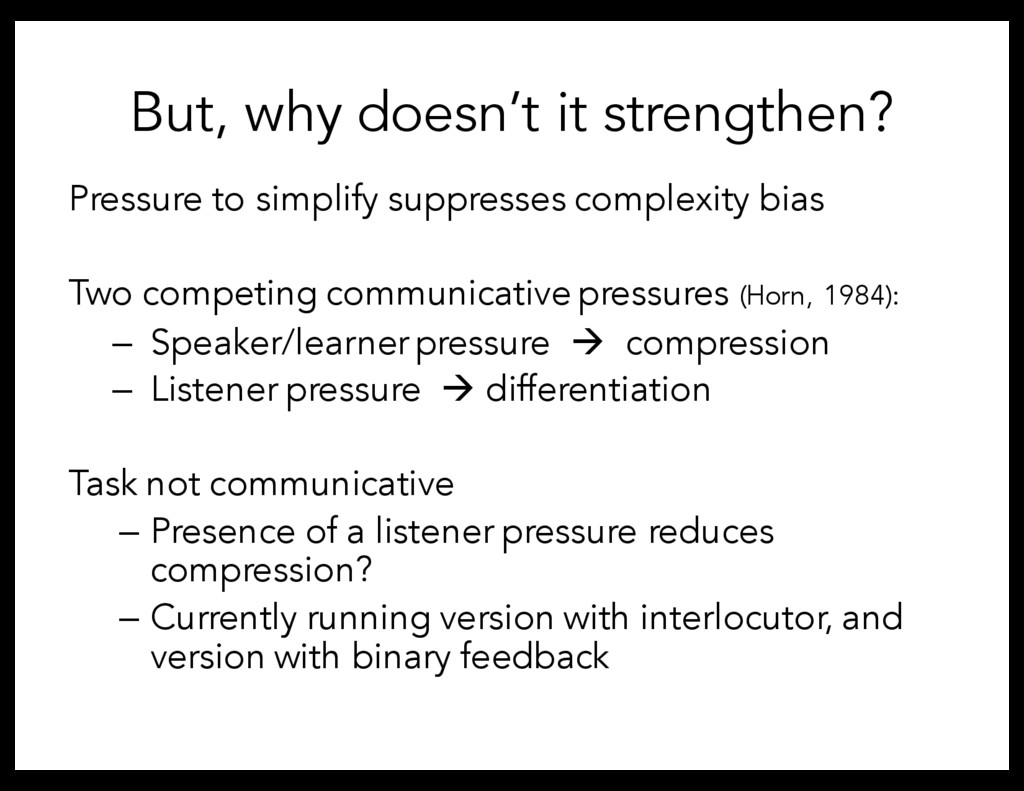
bias Two competing communicative pressures (Horn, 1984): – Speaker/learner pressure à compression – Listener pressure à differentiation Task not communicative – Presence of a listener pressure reduces compression? – Currently running version with interlocutor, and version with binary feedback
– productive – related to a basic cognitive process – can emerge from learning biases Suggests: – complexity as constraint on arbitrariness in language – cognitive biases are reflected in the structure of the lexicon – communicative biases may shape the lexicon
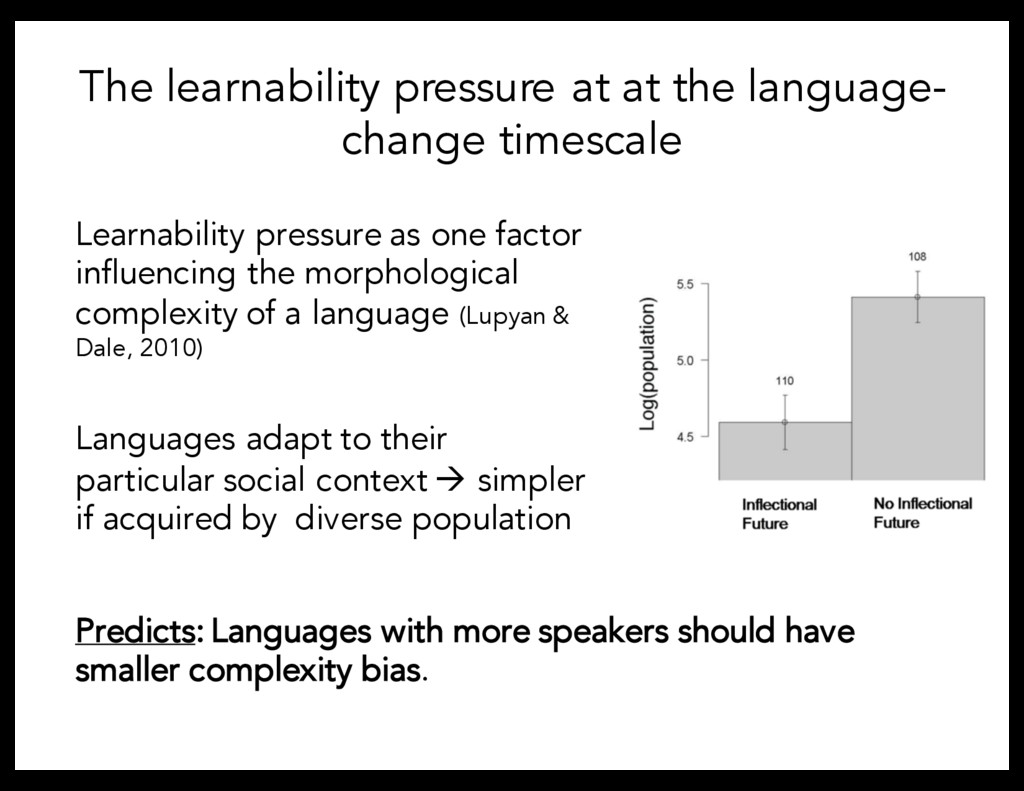
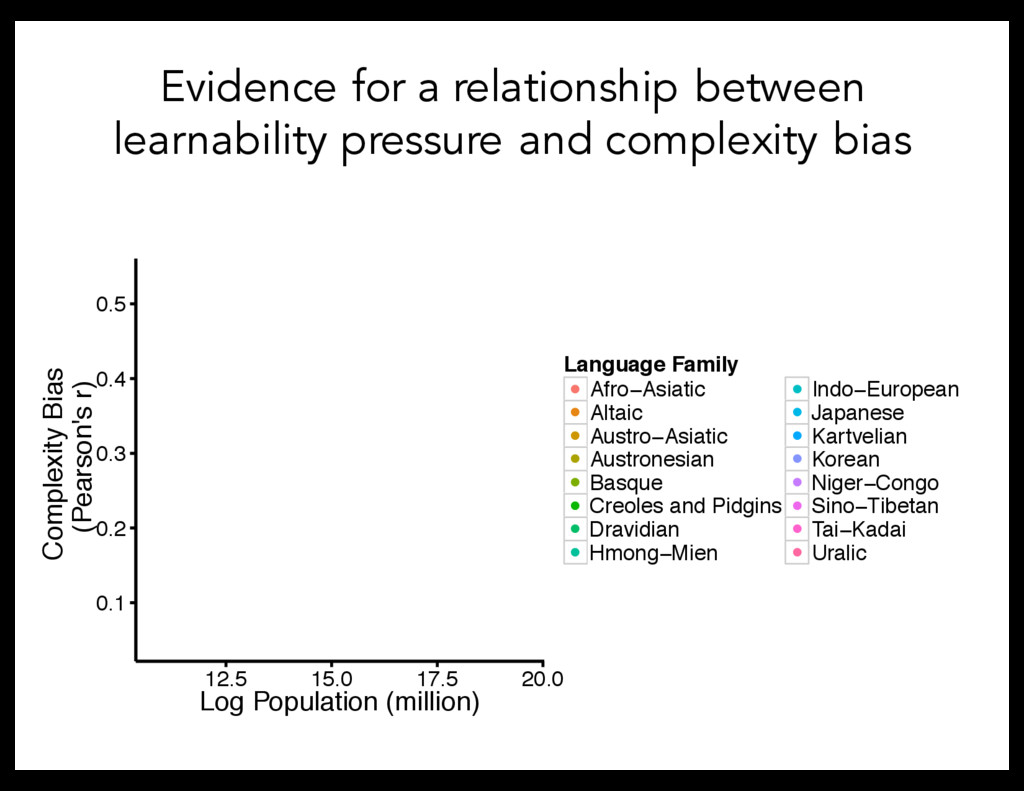
pressure as one factor influencing the morphological complexity of a language (Lupyan & Dale, 2010) Languages adapt to their particular social context à simpler if acquired by diverse population Predicts: Languages with more speakers should have smaller complexity bias.