Upgrade to Pro
— share decks privately, control downloads, hide ads and more …
Speaker Deck
Features
Speaker Deck
PRO
Sign in
Sign up for free
Search
Search
Berlin 2013 - Session - Abe Stanway
Search
Monitorama
September 19, 2013
390
3
Share
Berlin 2013 - Session - Abe Stanway
Monitorama
September 19, 2013
More Decks by Monitorama
See All by Monitorama
Monitorama PDX 2017 - Ian Bennett
monitorama
1
630
PDX 2017 - Pedro Andrade
monitorama
0
830
PDX 2017 - Roy Rapoport
monitorama
4
990
PDX 2017 - Julia Evans
monitorama
0
520
Berlin 2013 - Session - Brad Lhotsky
monitorama
5
770
Berlin 2013 - Session - Alex Petrov
monitorama
6
730
Berlin 2013 - Session - Jeff Weinstein
monitorama
2
670
Berlin 2013 - Session - Oliver Hankeln
monitorama
1
590
Berlin 2013 - Session - David Goodlad
monitorama
0
510
Featured
See All Featured
Done Done
chrislema
186
16k
We Have a Design System, Now What?
morganepeng
55
8.2k
Ten Tips & Tricks for a 🌱 transition
stuffmc
0
130
Optimizing for Happiness
mojombo
378
71k
Darren the Foodie - Storyboard
khoart
PRO
3
3.4k
Applied NLP in the Age of Generative AI
inesmontani
PRO
4
2.3k
How to make the Groovebox
asonas
2
2.2k
Unlocking the hidden potential of vector embeddings in international SEO
frankvandijk
0
830
The Cost Of JavaScript in 2023
addyosmani
55
10k
Connecting the Dots Between Site Speed, User Experience & Your Business [WebExpo 2025]
tammyeverts
11
940
Avoiding the “Bad Training, Faster” Trap in the Age of AI
tmiket
0
170
From Legacy to Launchpad: Building Startup-Ready Communities
dugsong
0
220
Transcript
@abestanway MOM! my algorithms SUCK
i know how to fix monitoring once and for all.
a real human physically staring at a single metric 24/7
that human will then alert a sleeping engineer when her
metric does something weird
Boom. Perfect Monitoring™.
this works because humans are excellent visual pattern matchers* *there
are, of course, many advanced statistical applications where signal cannot be determined from noise just by looking at the data.
can we teach software to be as good at simple
anomaly detection as humans are?
let’s explore.
anomalies = not “normal”
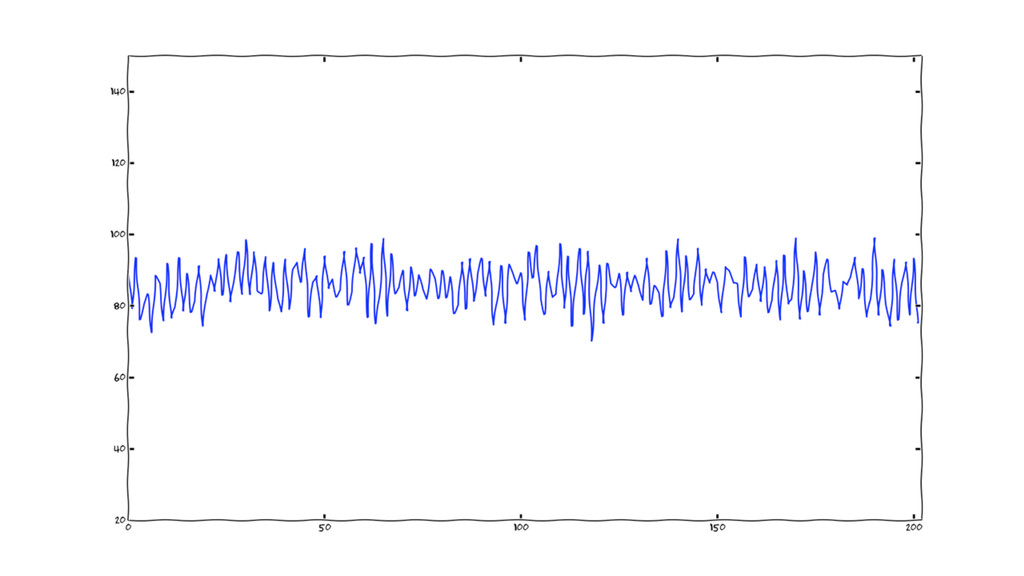
humans can tell what “normal” is by just looking at
a timeseries.
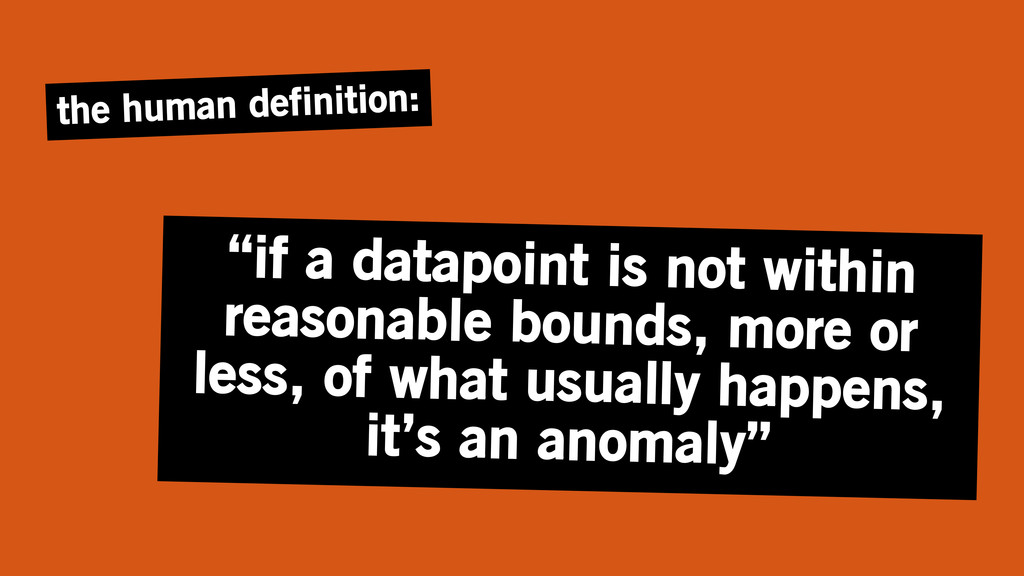
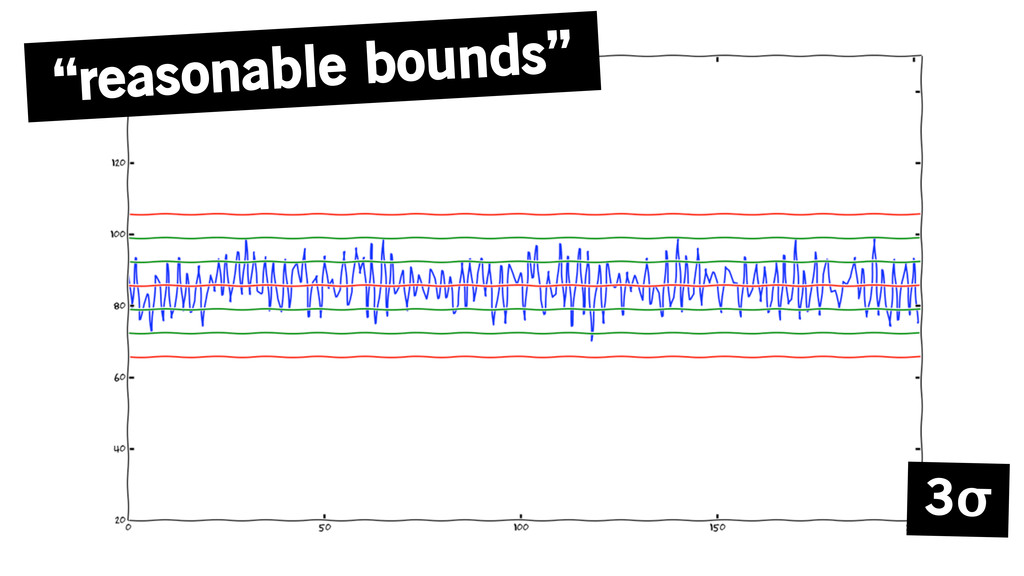
“if a datapoint is not within reasonable bounds, more or
less, of what usually happens, it’s an anomaly” the human definition:
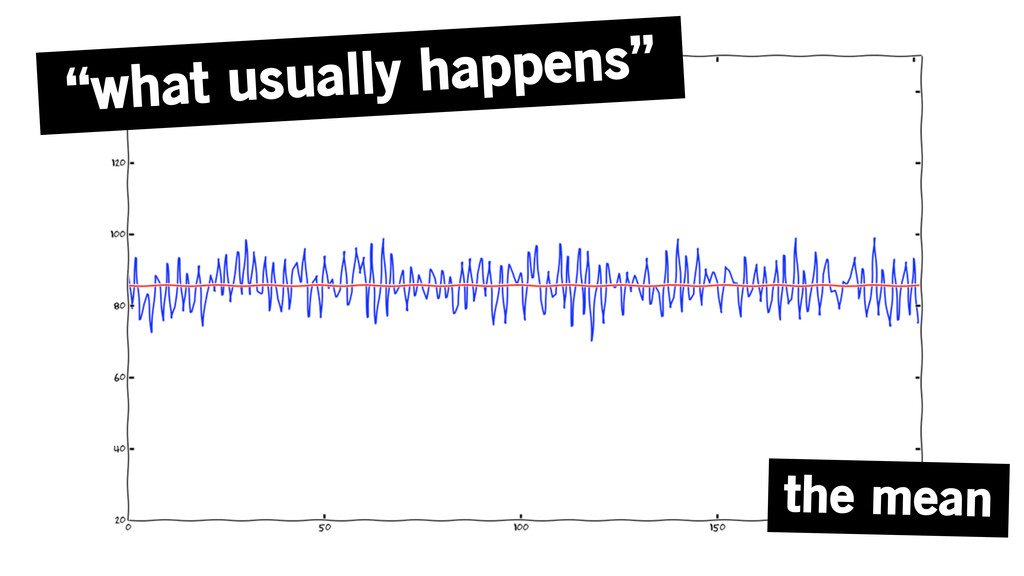
there are real statistics that describe what we mentally approximate
None
“what usually happens” the mean
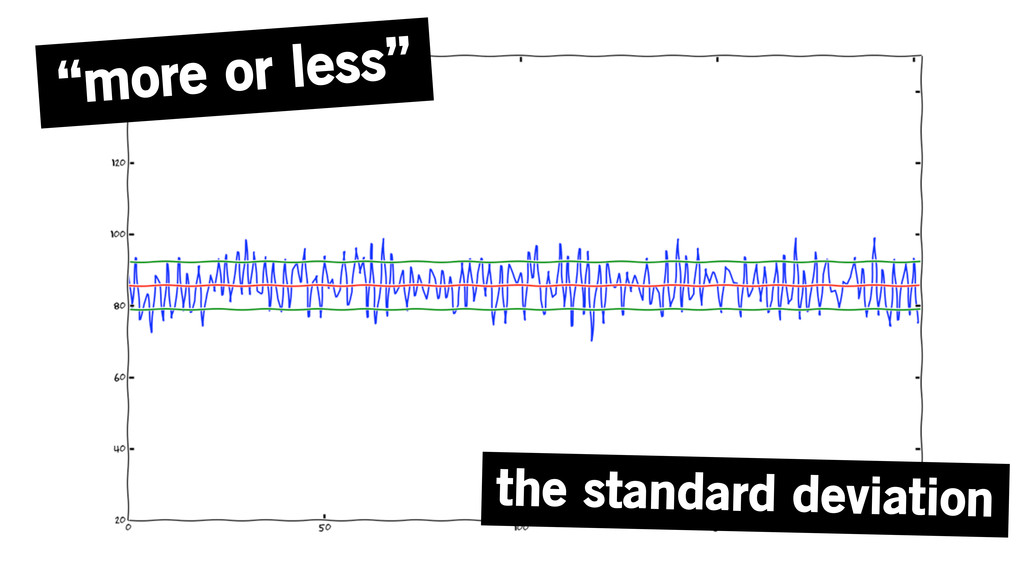
“more or less” the standard deviation
“reasonable bounds” 3σ
so, in math speak, a metric is anomalous if the
absolute value of latest datapoint is over three standard deviations above the mean
we have essentially derived statistical process control.
pioneered in the 1920s. heavily used in industrial engineering for
quality control on assembly lines.
traditional control charts specification limits
grounded in exchangeability past = future
needs to be stationary
produced by independent random variables, with well- defined expected values
this allows for statistical inference
in other words, you need good lookin’ timeseries for this
to work.
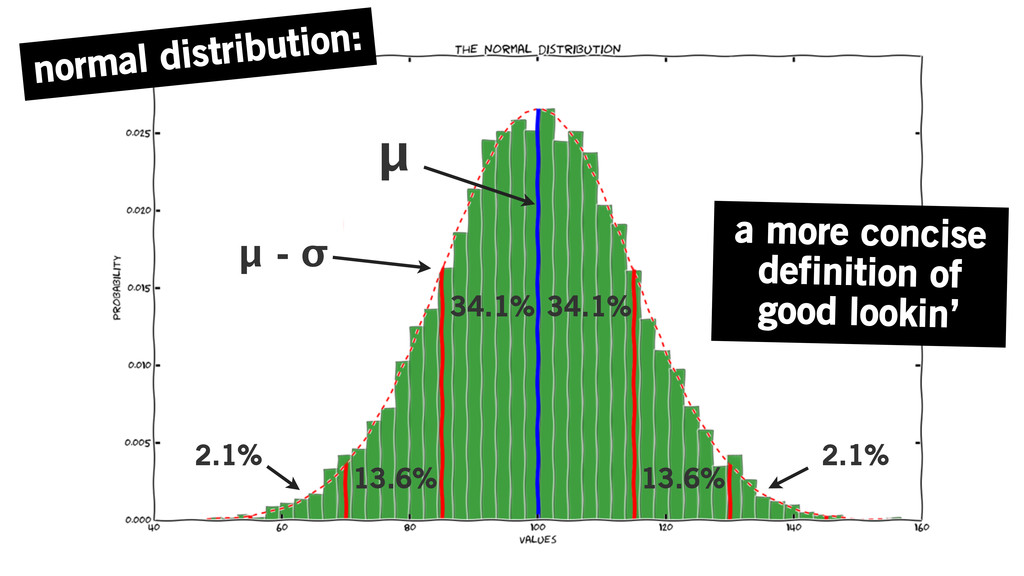
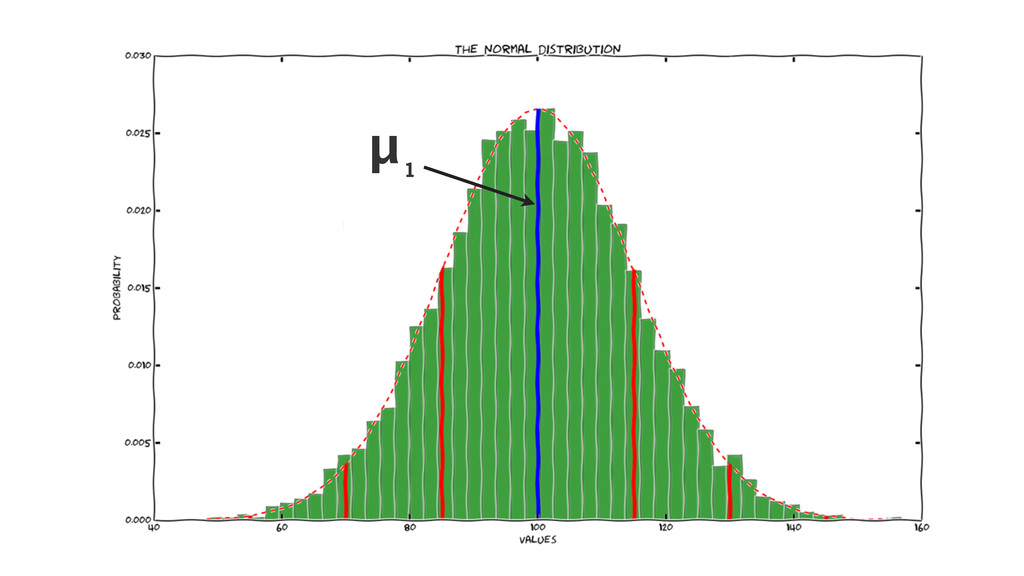
normal distribution: a more concise definition of good lookin’ μ
34.1% 13.6% 2.1% 34.1% 13.6% μ - σ 2.1%
if you’ve got a normal distribution, chances are you’ve got
an exchangeable, stationary series produced by independent random variables
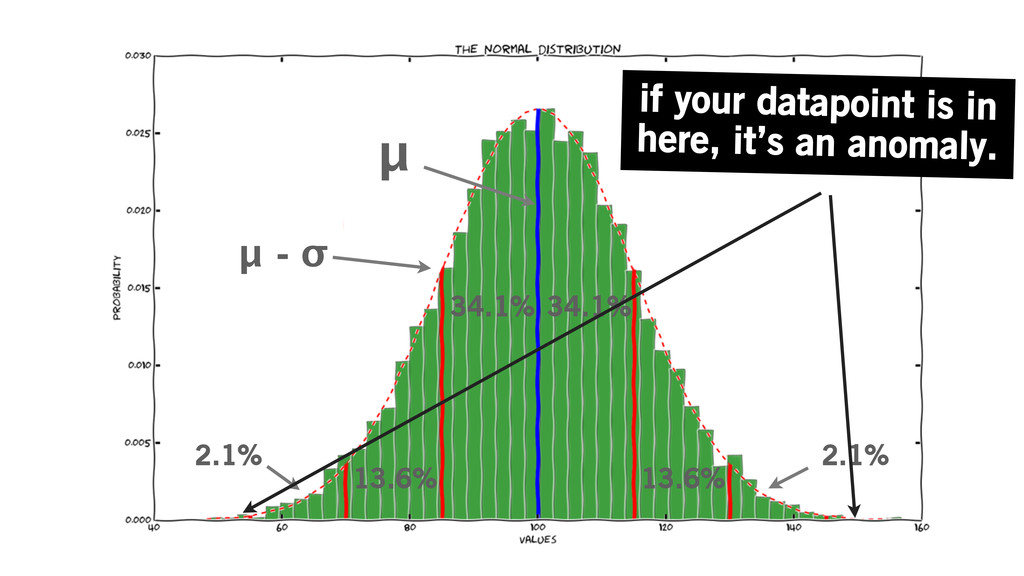
99.7% fall under 3σ
μ 34.1% 13.6% 2.1% 34.1% 13.6% 2.1% μ - σ
if your datapoint is in here, it’s an anomaly.
when only .3% lie above 3σ...
...you get a high signal to noise ratio...
...where “signal” indicates a fundmental state change, as opposed to
a random, improbable variation.
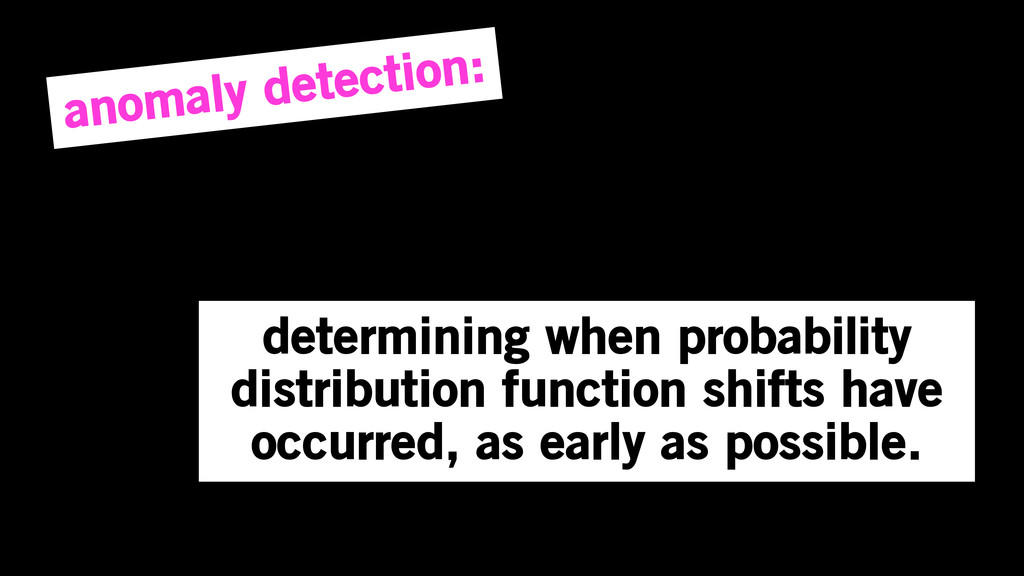
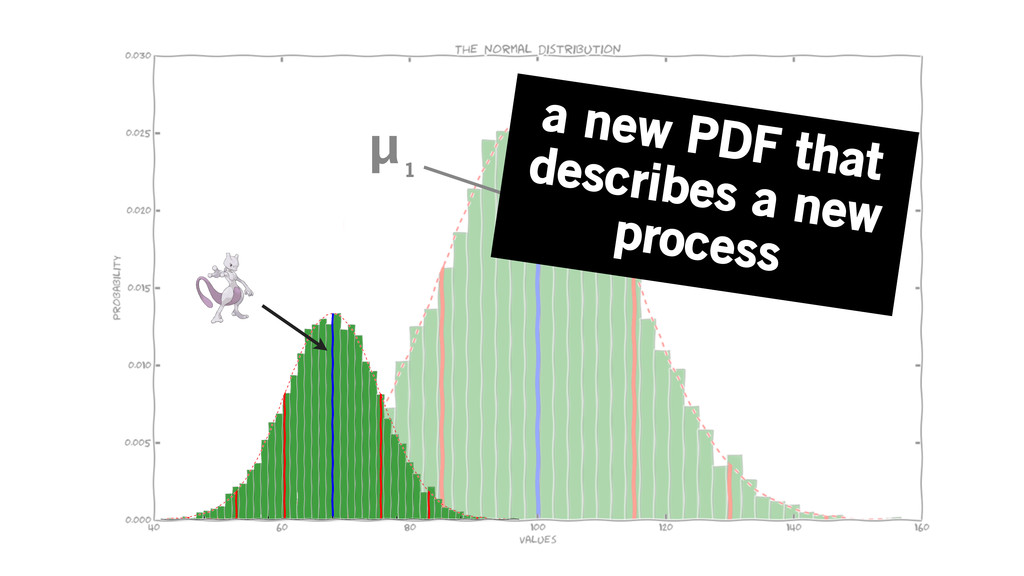
a fundamental state change in the process means a different
probability distribution function that describes the process
determining when probability distribution function shifts have occurred, as early
as possible. anomaly detection:
μ 1
μ 1 a new PDF that describes a new process
drilling holes sawing boards forging steel
snapped drill bit teeth missing on table saw steel, like,
melted
processes with well planned expected values that only suffer small,
random deviances when working properly...
...and massive “deviances”, aka, probability function shifts, when working improperly.
the bad news:
server infrastructures aren’t like assembly lines
systems are active participants in their own design
processes don’t have well defined expected values
they aren’t produced by genuinely independent random variables.
large variance does not necessarily indicate poor quality
they have seasonality
skewed distributions! less than 99.73% of all values lie within
3σ, so breaching 3σ is not necessarily bad 3σ possibly normal range
the dirty secret: using SPC-based algorithms results in lots and
lots of false positives, and probably lots of false negatives as well
no way to retroactively find the false negatives short of
combing with human eyes!
how do we combat this?* *warning! ideas!
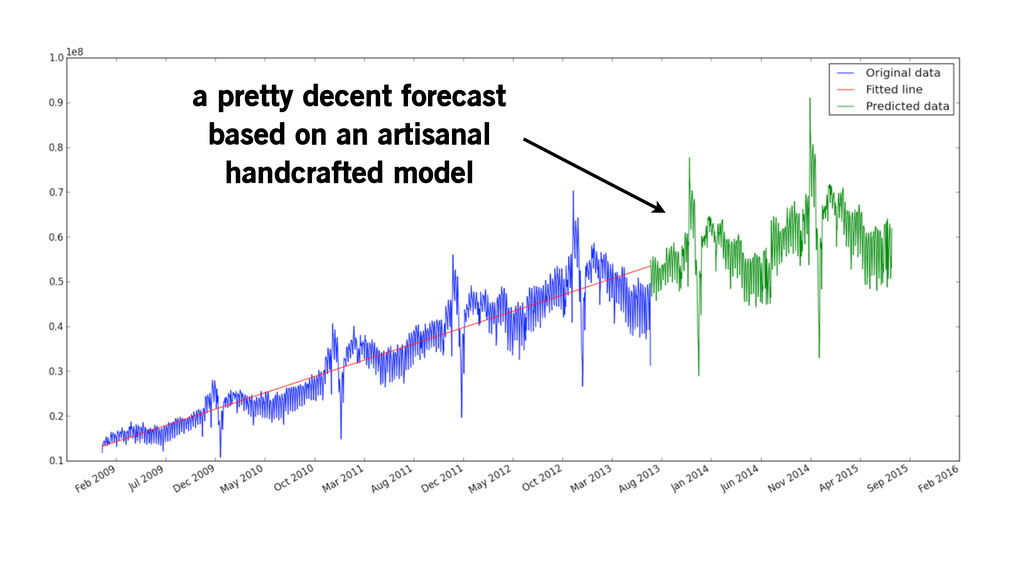
we could always use custom fit models...
...after all, as long as the *errors* from the model
are normally distributed, we can use 3σ
Parameters are cool! a pretty decent forecast based on an
artisanal handcrafted model
but fitting models is hard, even by hand.
possible to implement a class of ML algorithms that determine
models based on distribution of errors, using Q-Q plots
Q-Q plots can also be used to determine if the
PDF has changed, although hard to do with limited sample size
consenus: throw lots of different models at a series, hope
it all shakes out.
[yes] [yes] [no] [no] [yes] [yes] = anomaly!
of course, if your models are all SPC-based, this doesn’t
really get you anywhere
use exponentially weighted moving averages to adapt faster
fourier transforms to detect seasonality
second order anomalies: is the series “anomalously anomalous”?
...this is all very hard.
so, we can either change what we expect of monitoring...
...and treat it as a way of building noisy situational
awareness, not absolute directives (alerts)...
...or we can change what we expect out of engineering...
...and construct strict specifications and expected values of all metrics.
neither are going to happen.
so we have to crack this algorithm nut.
...ugh. @abestanway
![[yes] [yes] [no] [no] [yes] [yes] = anomaly!](https://files.speakerdeck.com/presentations/15fecff007b001317dbd6229406390f2/slide_58.jpg)