Upgrade to Pro
— share decks privately, control downloads, hide ads and more …
Speaker Deck
Features
Speaker Deck
PRO
Sign in
Sign up for free
Search
Search
Berlin 2013 - Session - Daniele de Matteis & Ha...
Search
Monitorama
September 19, 2013
490
3
Share
Embed
Copy iframe code
Copy JS code
Copy link
Start on current slide
Berlin 2013 - Session - Daniele de Matteis & Harry Wincup
Monitorama
September 19, 2013
More Decks by Monitorama
See All by Monitorama
Monitorama PDX 2017 - Ian Bennett
monitorama
1
630
PDX 2017 - Pedro Andrade
monitorama
0
830
PDX 2017 - Roy Rapoport
monitorama
4
1k
PDX 2017 - Julia Evans
monitorama
0
520
Berlin 2013 - Session - Brad Lhotsky
monitorama
5
770
Berlin 2013 - Session - Alex Petrov
monitorama
6
730
Berlin 2013 - Session - Jeff Weinstein
monitorama
2
670
Berlin 2013 - Session - Oliver Hankeln
monitorama
1
600
Berlin 2013 - Session - David Goodlad
monitorama
0
520
Featured
See All Featured
Building a A Zero-Code AI SEO Workflow
portentint
PRO
0
650
Neural Spatial Audio Processing for Sound Field Analysis and Control
skoyamalab
0
390
Building AI with AI
inesmontani
PRO
1
1.1k
The agentic SEO stack - context over prompts
schlessera
0
860
Fight the Zombie Pattern Library - RWD Summit 2016
marcelosomers
234
17k
Mozcon NYC 2025: Stop Losing SEO Traffic
samtorres
1
450
Ten Tips & Tricks for a 🌱 transition
stuffmc
0
160
How to Ace a Technical Interview
jacobian
281
24k
Large-scale JavaScript Application Architecture
addyosmani
515
110k
Art, The Web, and Tiny UX
lynnandtonic
304
22k
How to train your dragon (web standard)
notwaldorf
97
6.7k
Future Trends and Review - Lecture 12 - Web Technologies (1019888BNR)
signer
PRO
0
3.7k
Transcript
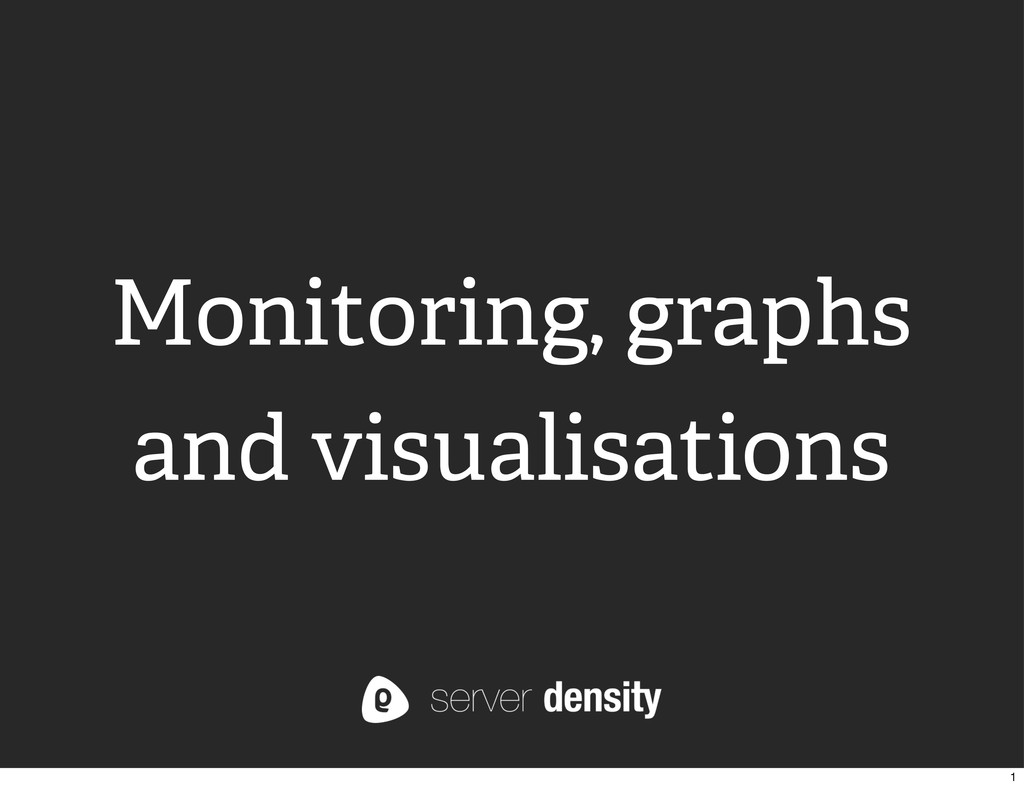
Monitoring, graphs and visualisations 1
Graphs are crucial 2
✦ What is good graphing? ✦ How do you achieve
it? Graphs are crucial 2
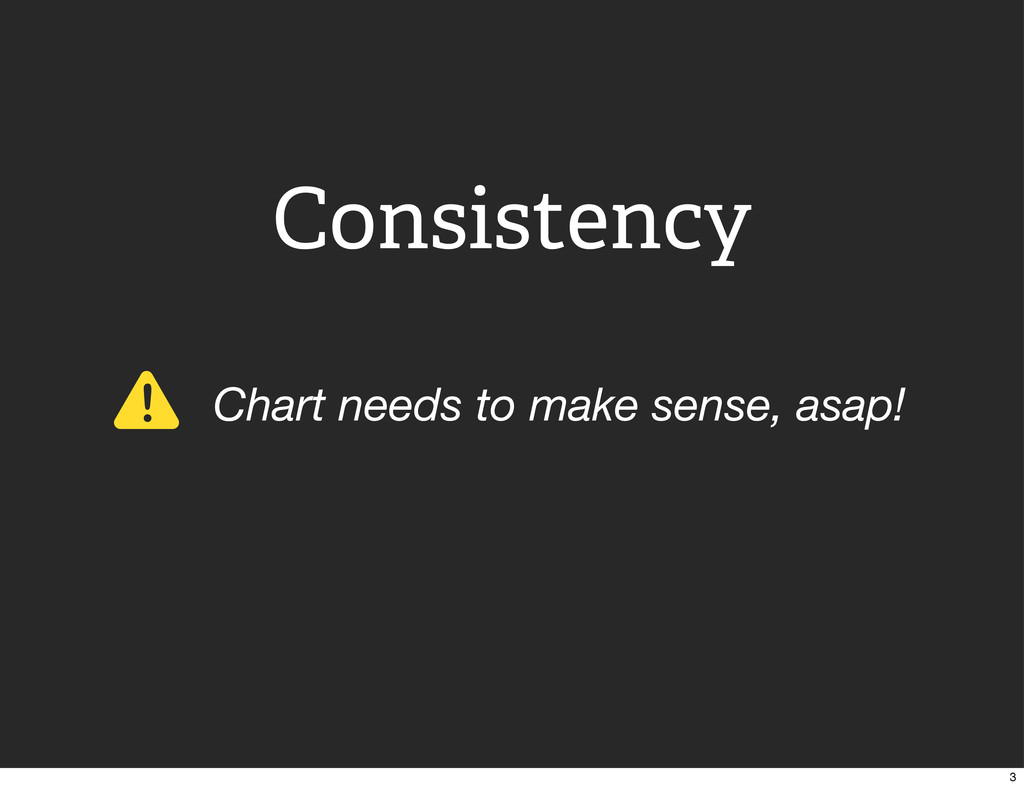
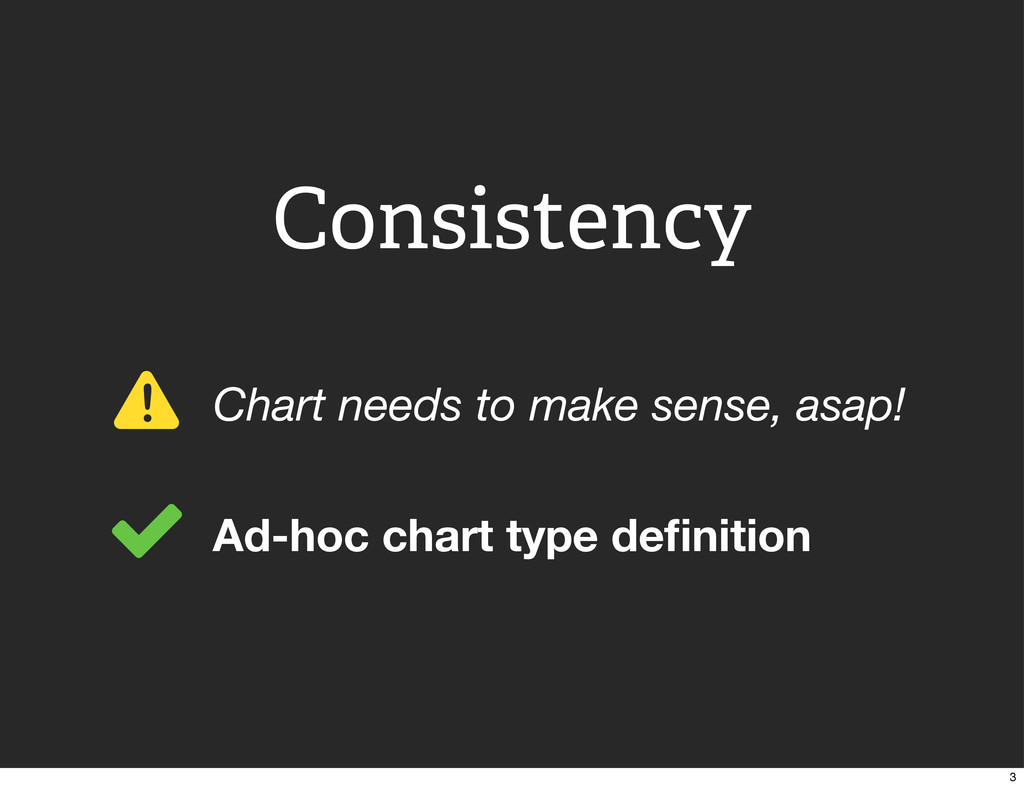
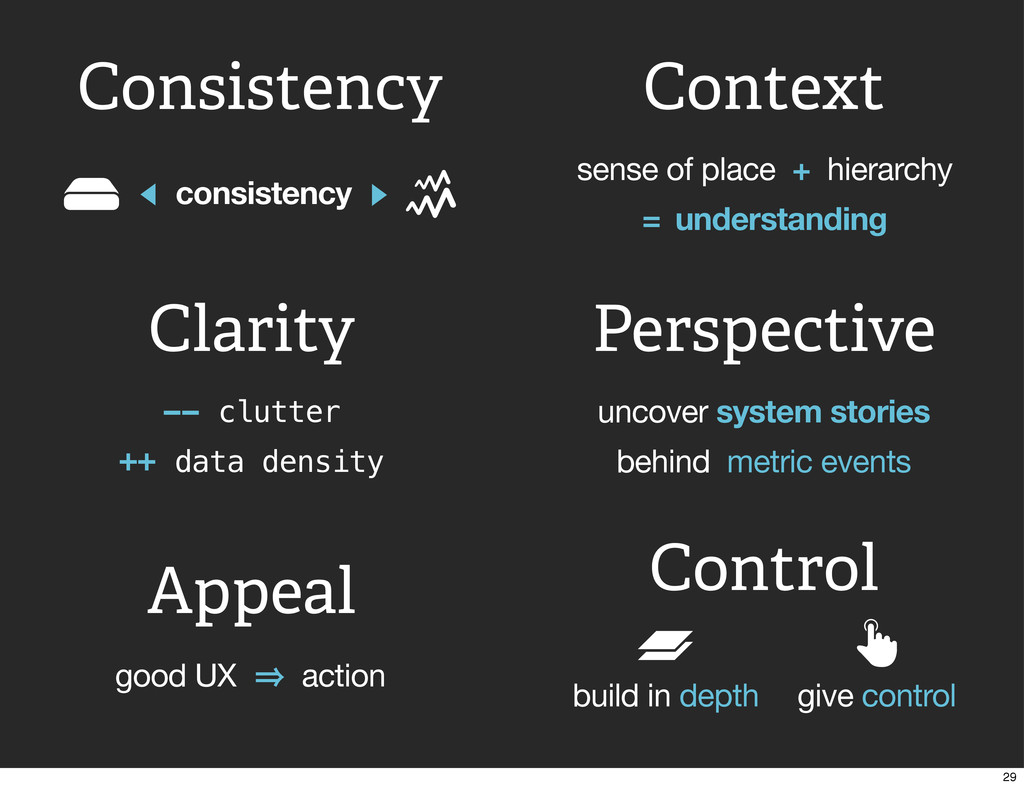
Consistency 3
! Chart needs to make sense, asap! Consistency 3
! Chart needs to make sense, asap! Ad-hoc chart type
definition Consistency 3
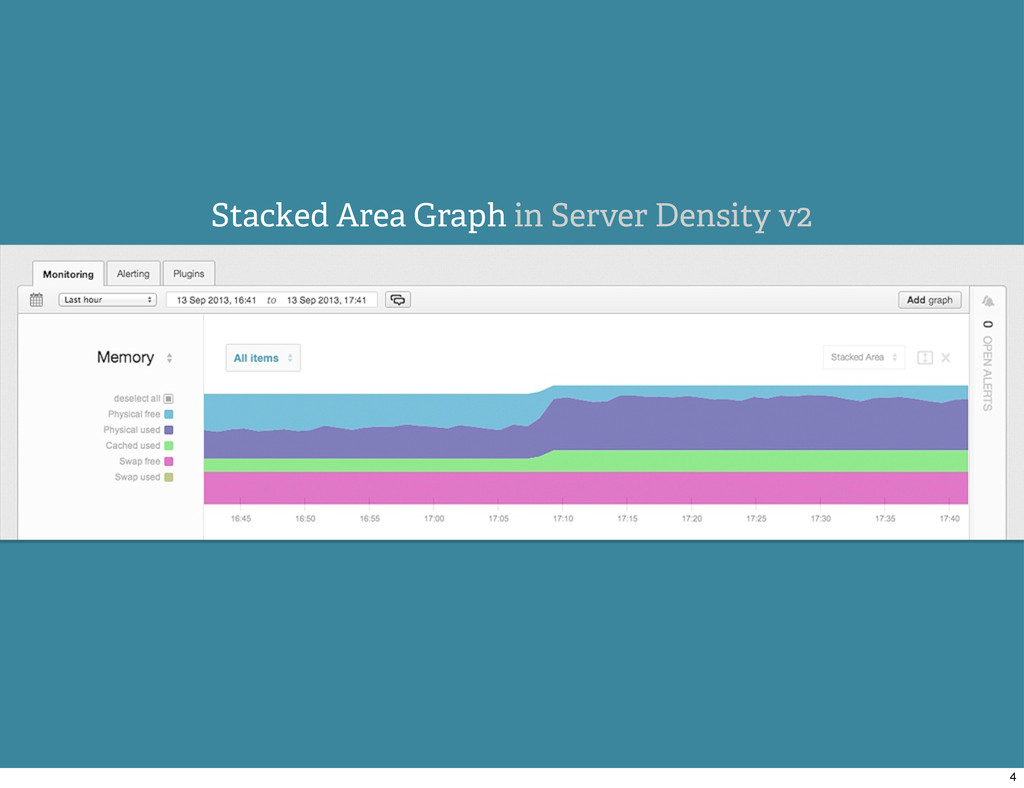
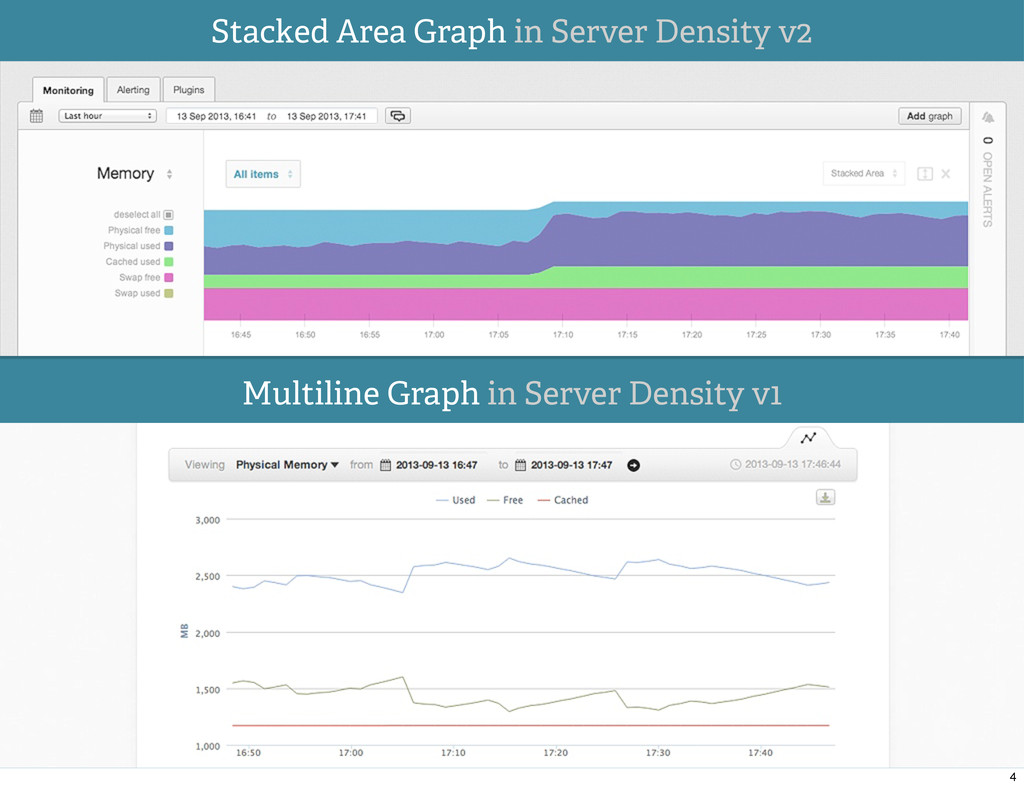
Stacked Area Graph in Server Density v2 4
Stacked Area Graph in Server Density v2 Multiline Graph in
Server Density v1 4
Context 5
! Where am I, what am I looking at? Context
5
! Where am I, what am I looking at? Display
data hierarchy Context 5
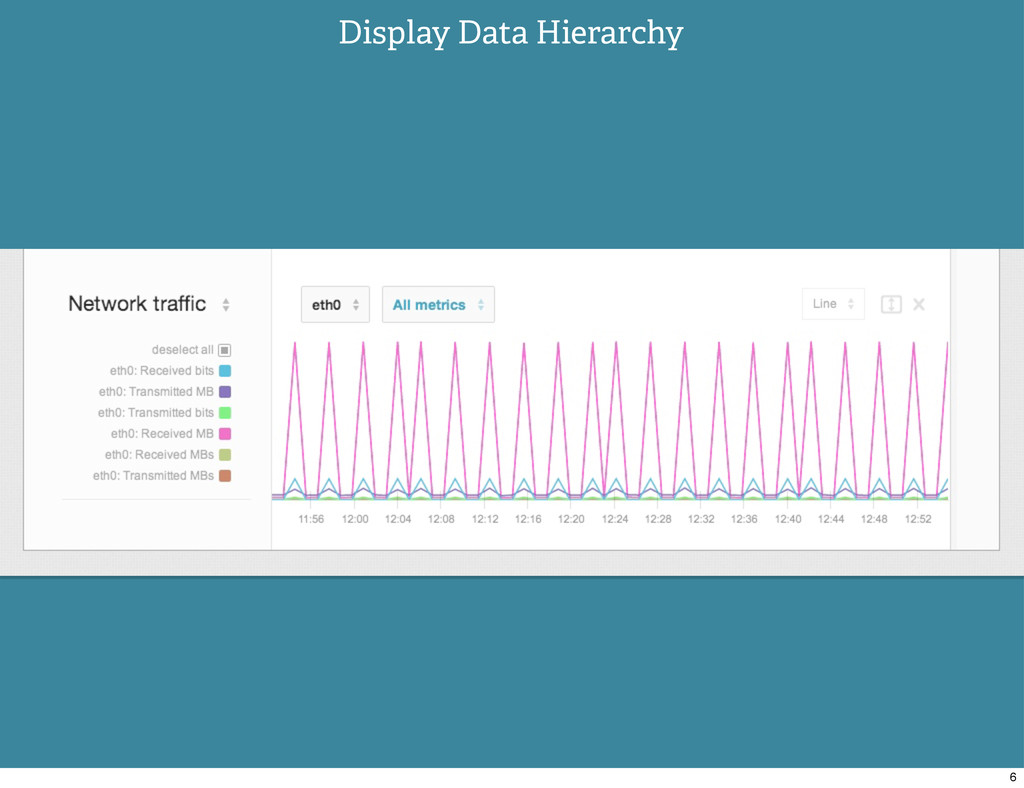
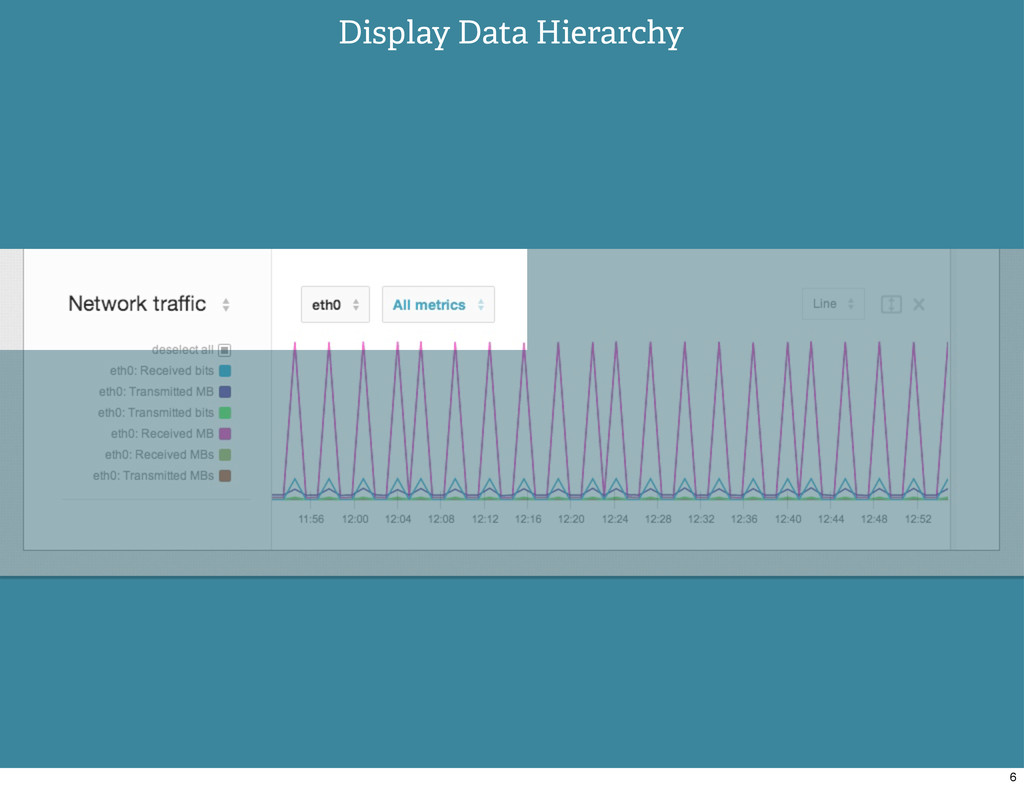
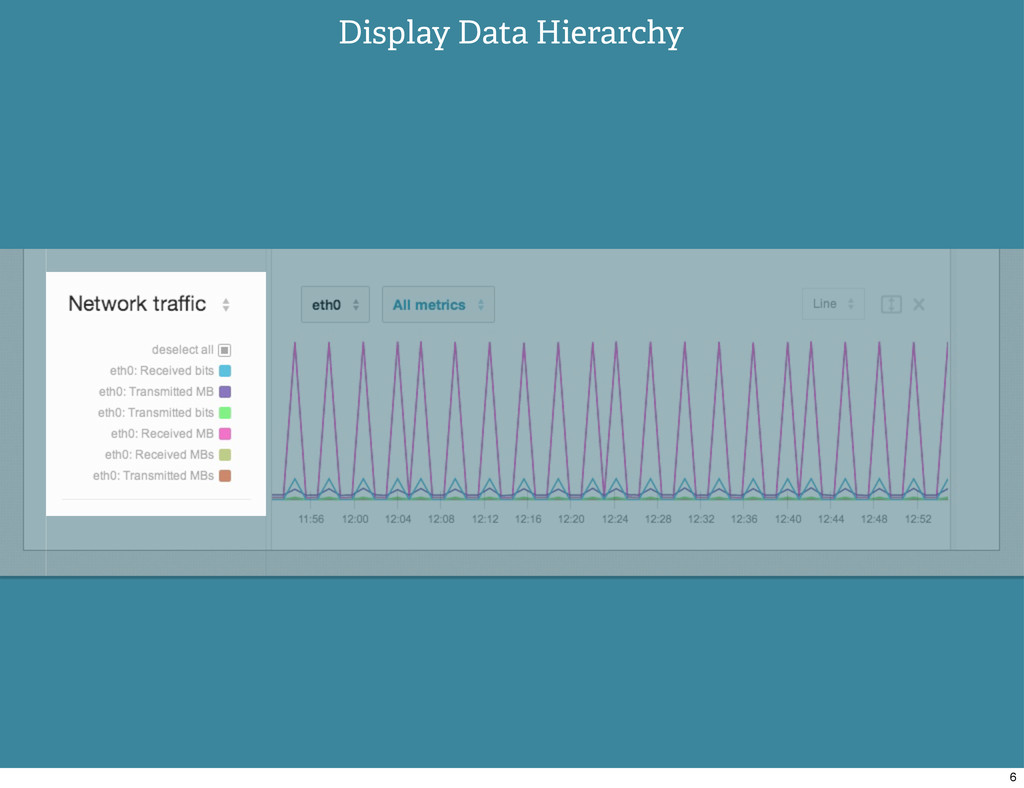
Display Data Hierarchy 6
Display Data Hierarchy 6
Display Data Hierarchy 6
! Where am I, what am I looking at? Display
data hierarchy Display as much ‘as possible’ Context 7
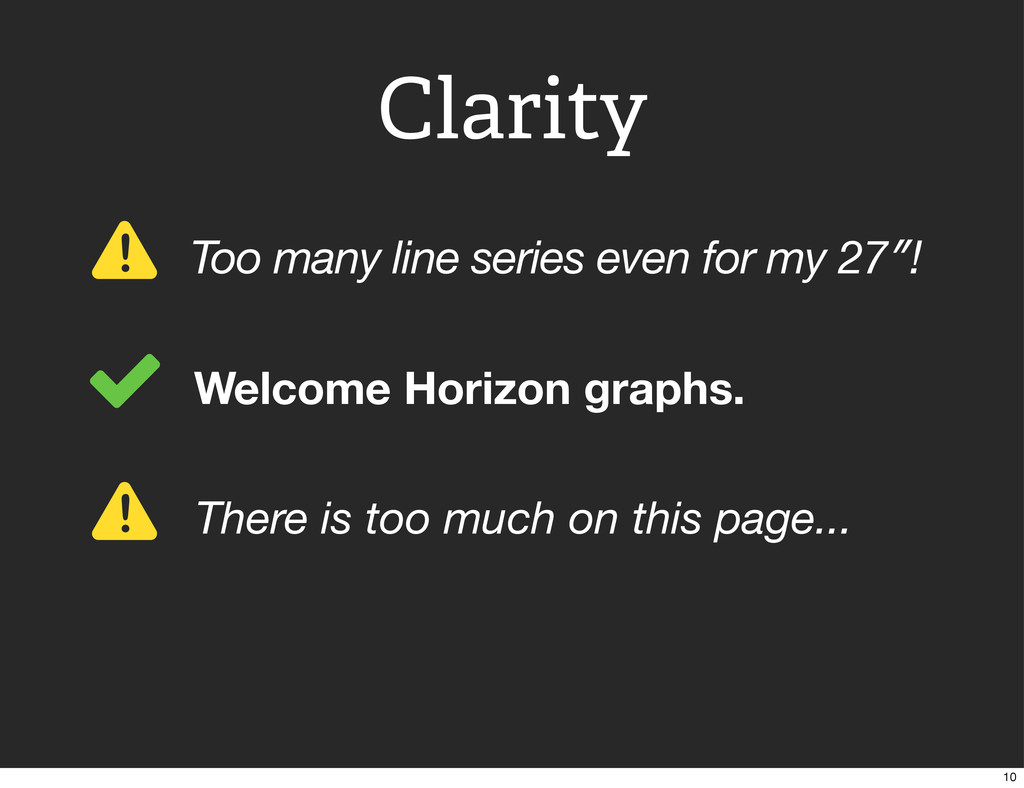
Clarity 8
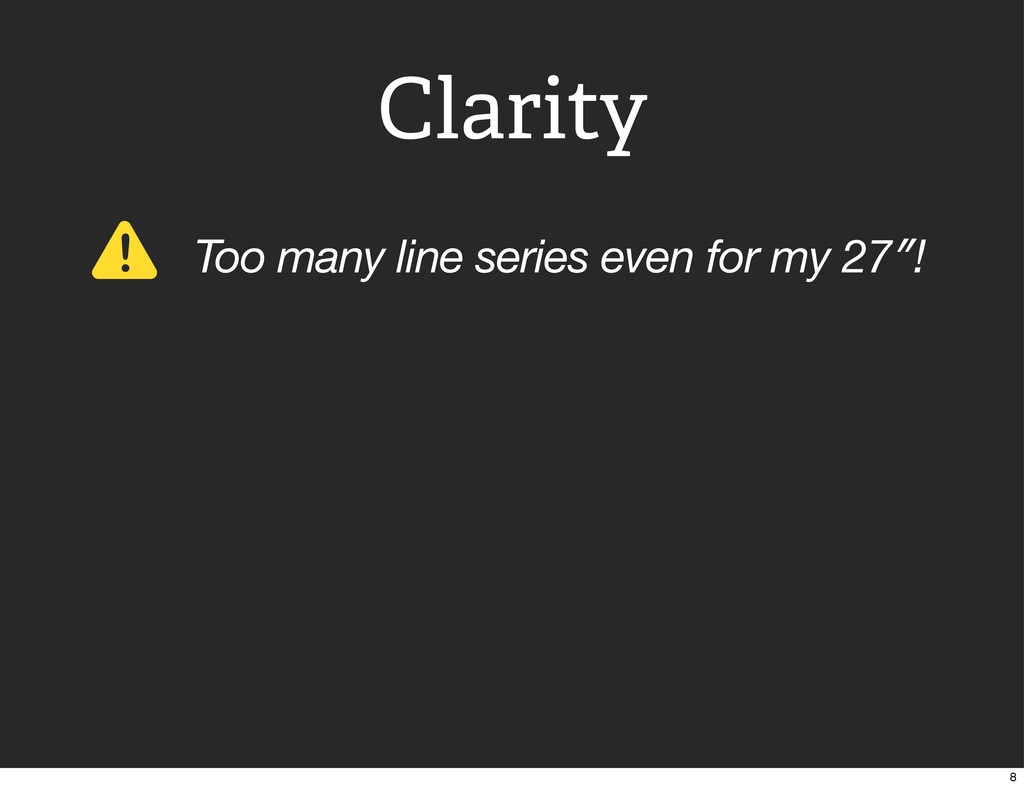
! Too many line series even for my 27″! Clarity
8
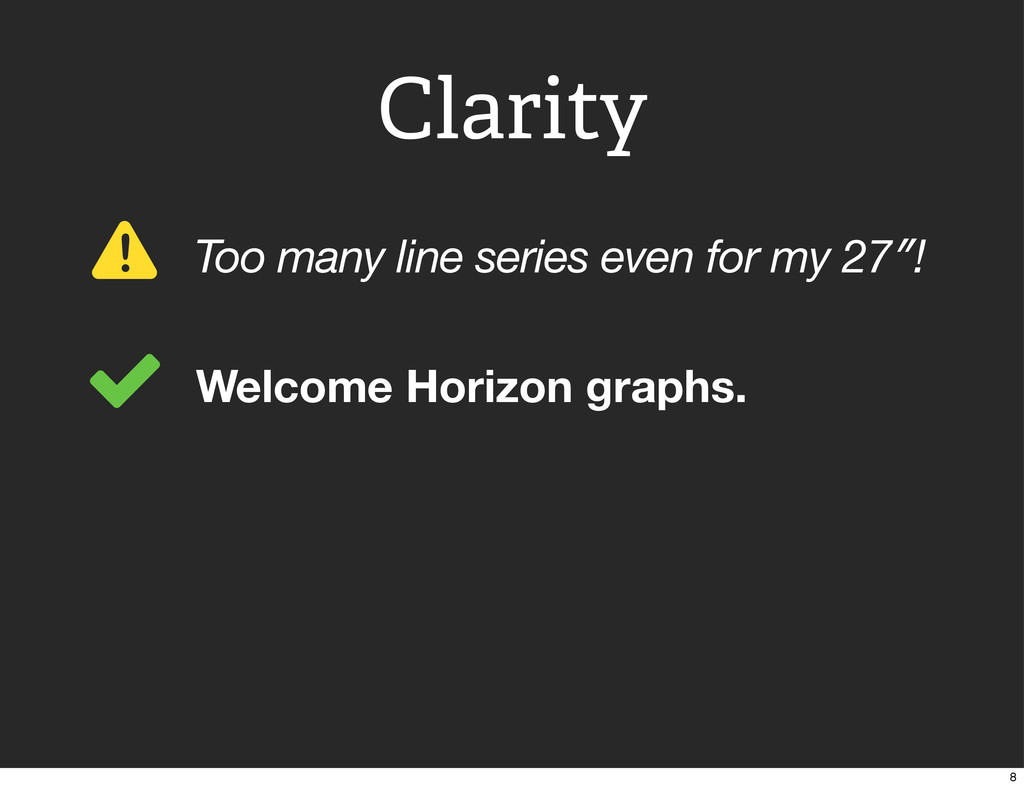
! Too many line series even for my 27″! Welcome
Horizon graphs. Clarity 8
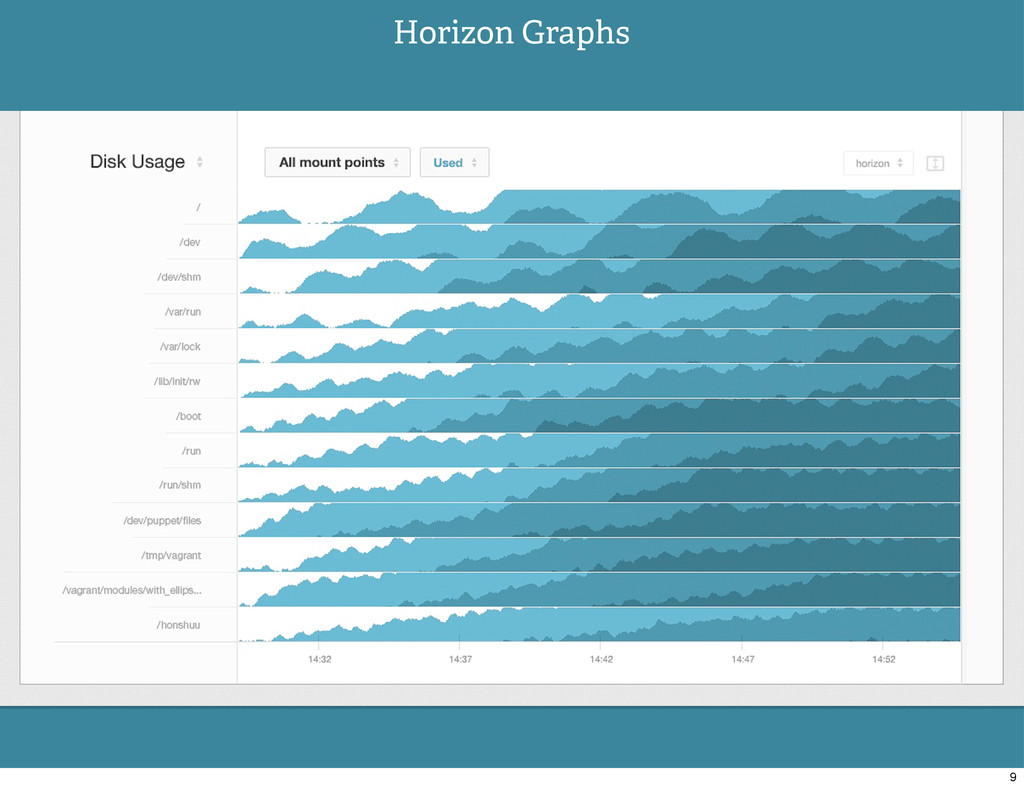
Horizon Graphs 9
! Too many line series even for my 27″! Welcome
Horizon graphs. ! There is too much on this page... Clarity 10
! Too many line series even for my 27″! Welcome
Horizon graphs. When in doubt, less ink! ! There is too much on this page... Clarity 10
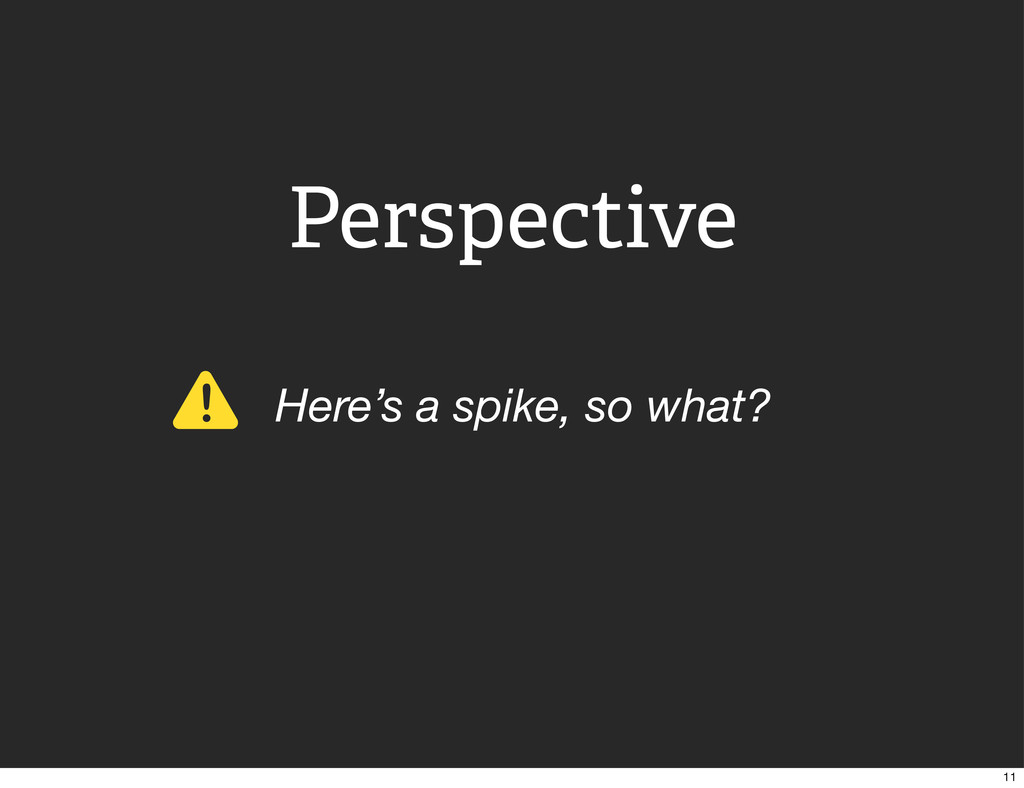
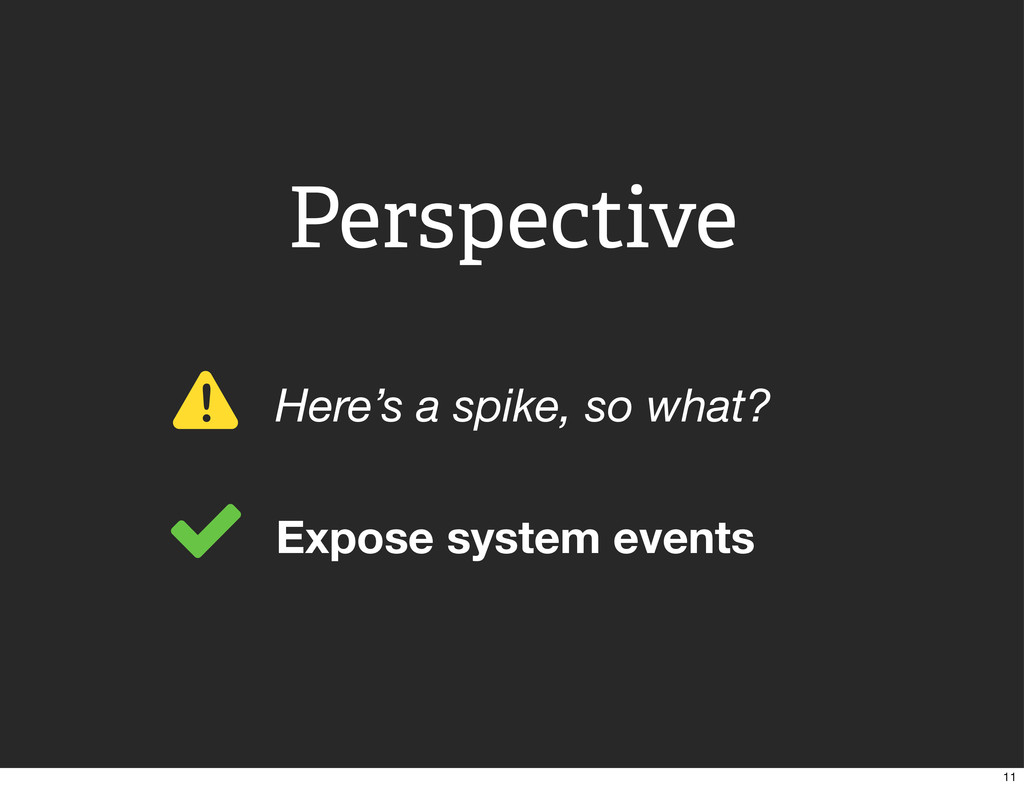
Perspective 11
! Here’s a spike, so what? Perspective 11
! Here’s a spike, so what? Expose system events Perspective
11
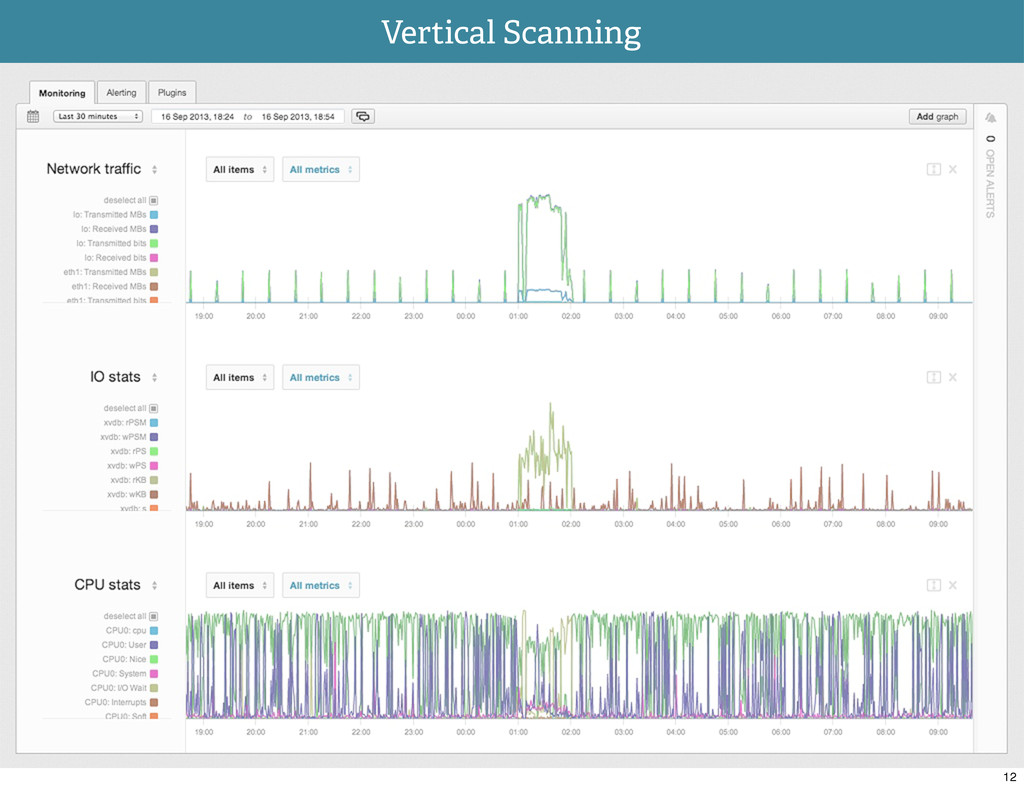
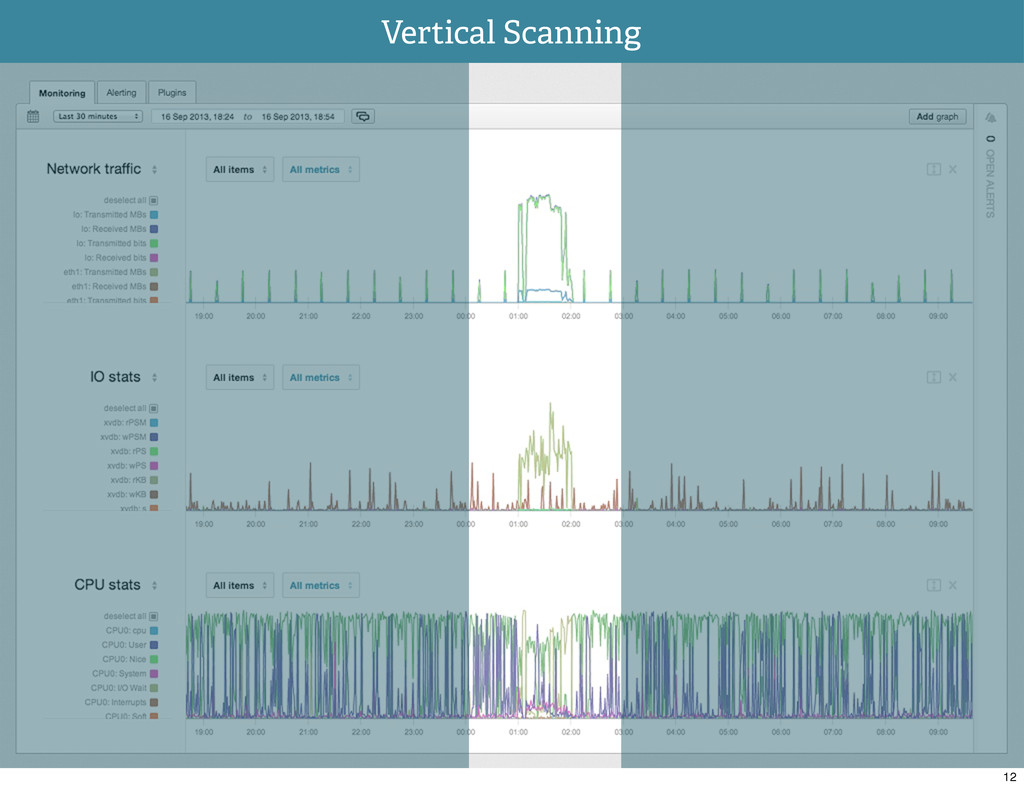
Vertical Scanning 12
Vertical Scanning 12
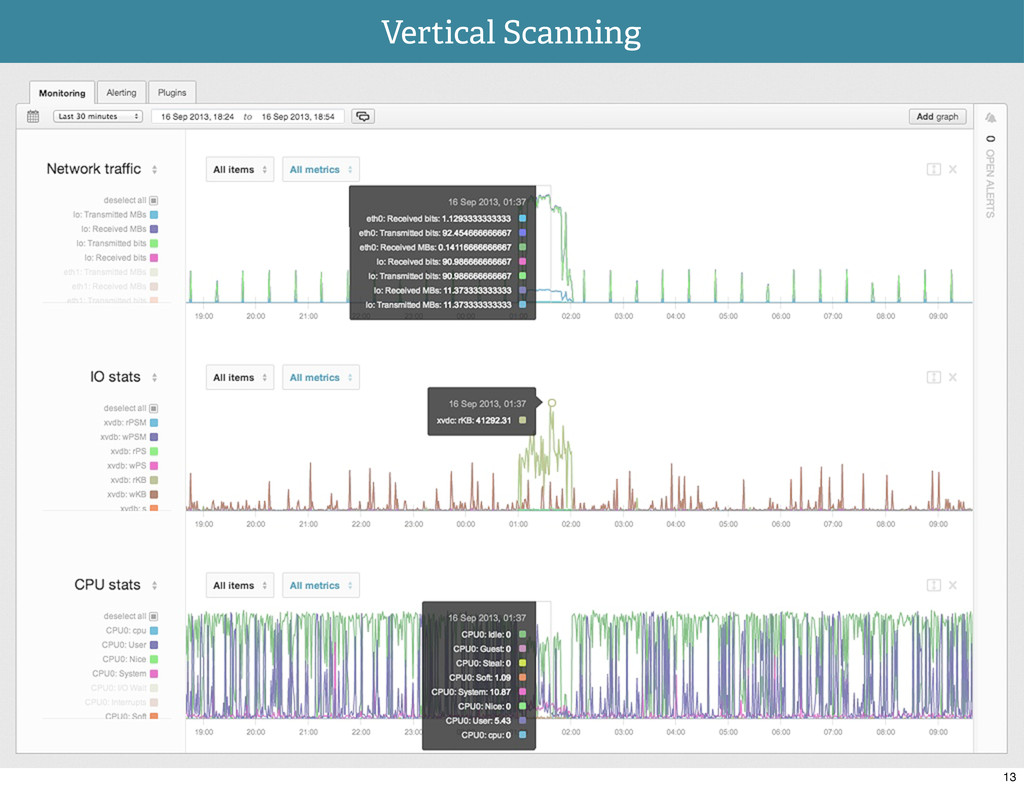
Vertical Scanning 13
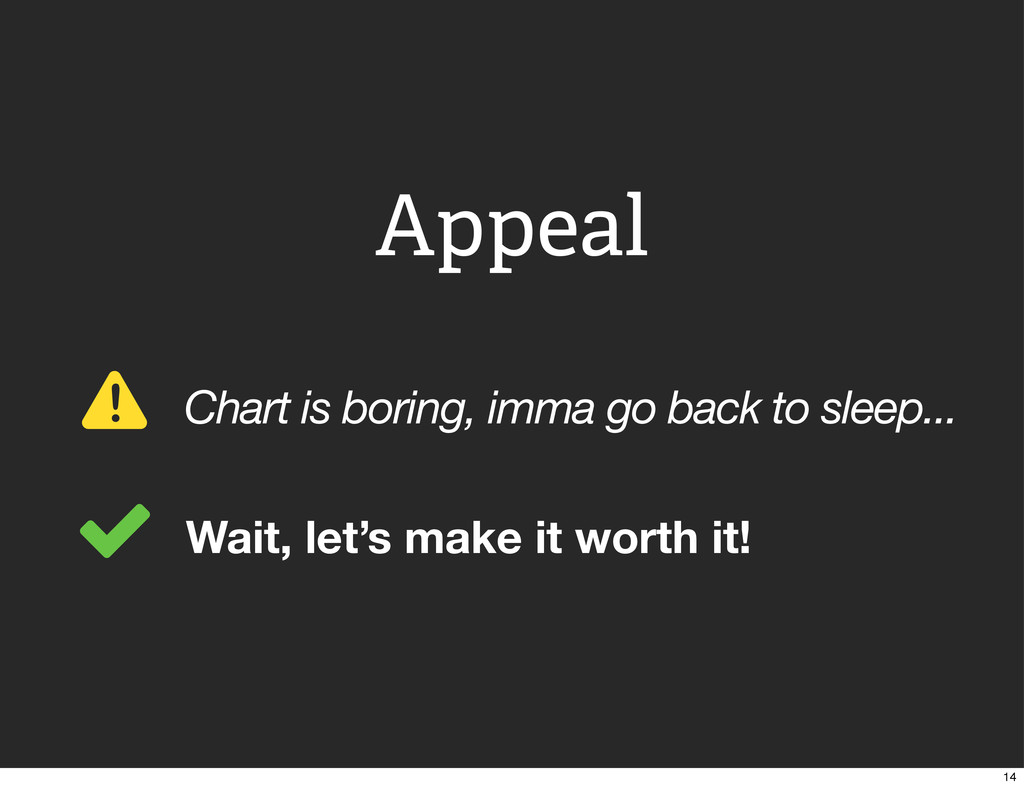
Appeal 14
! Chart is boring, imma go back to sleep... Appeal
14
! Chart is boring, imma go back to sleep... Wait,
let’s make it worth it! Appeal 14
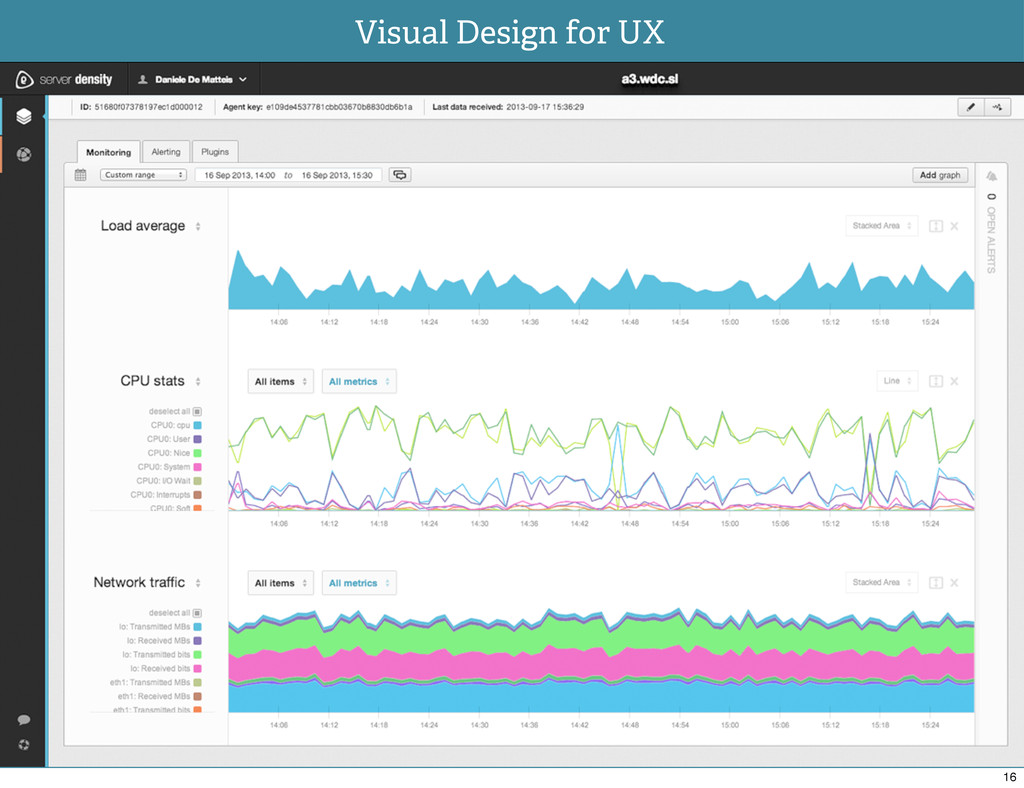
Visual Design for UX 16
Visual Design for UX 16
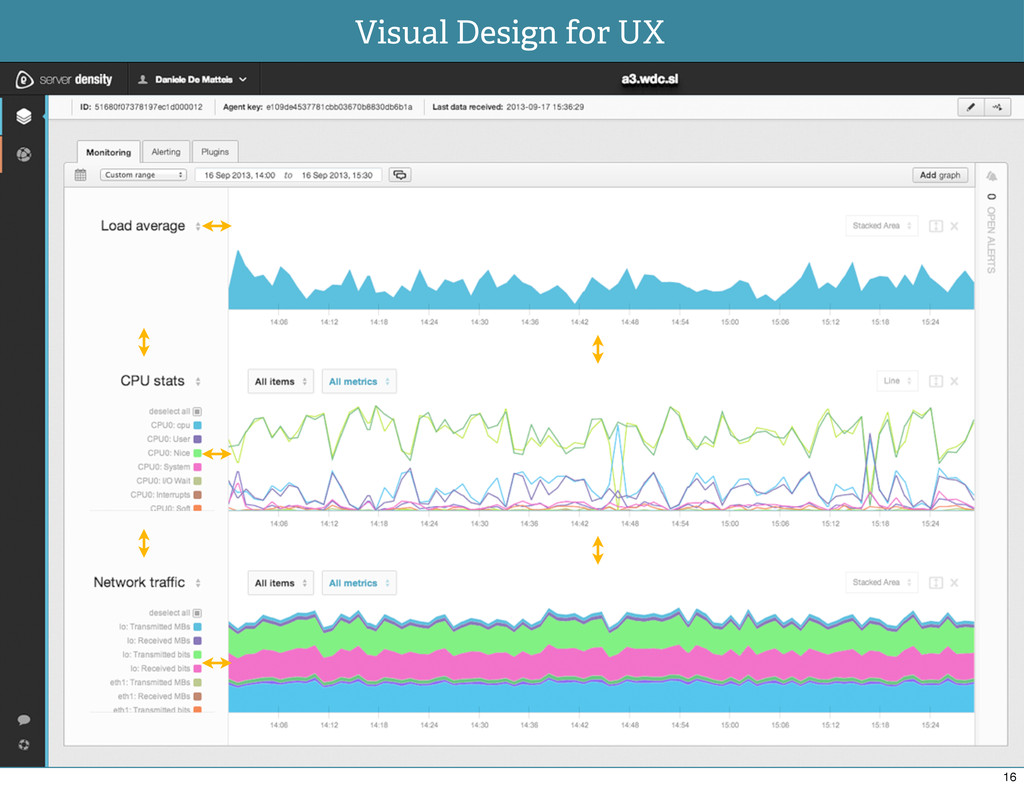
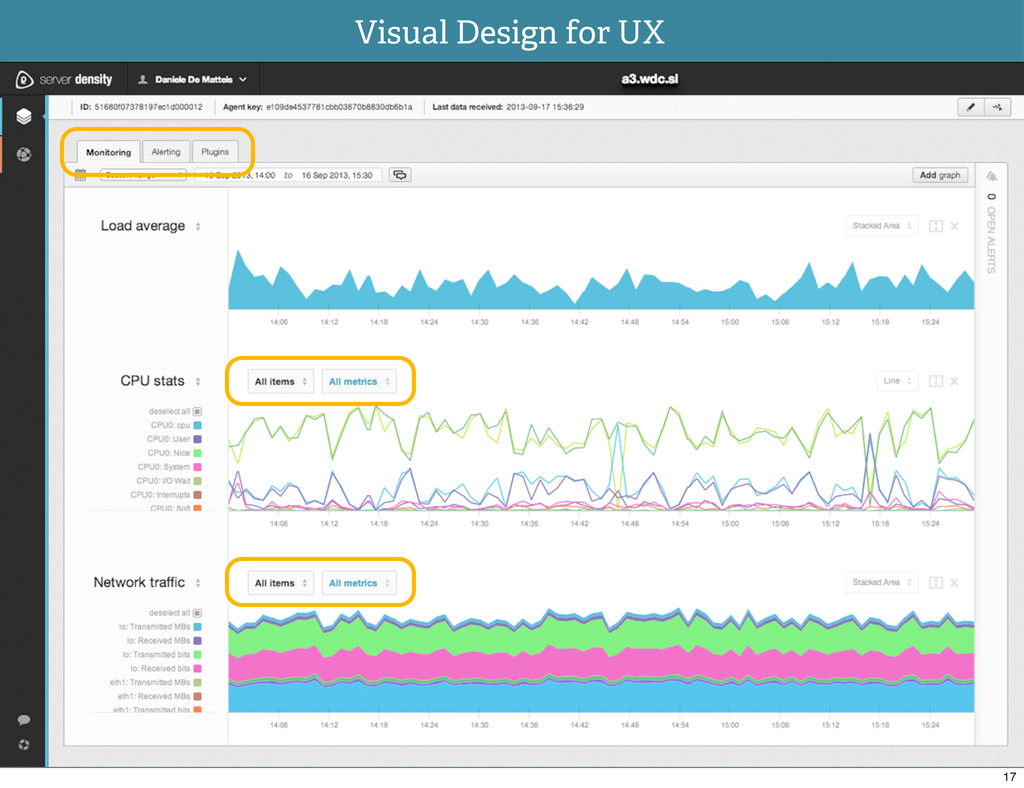
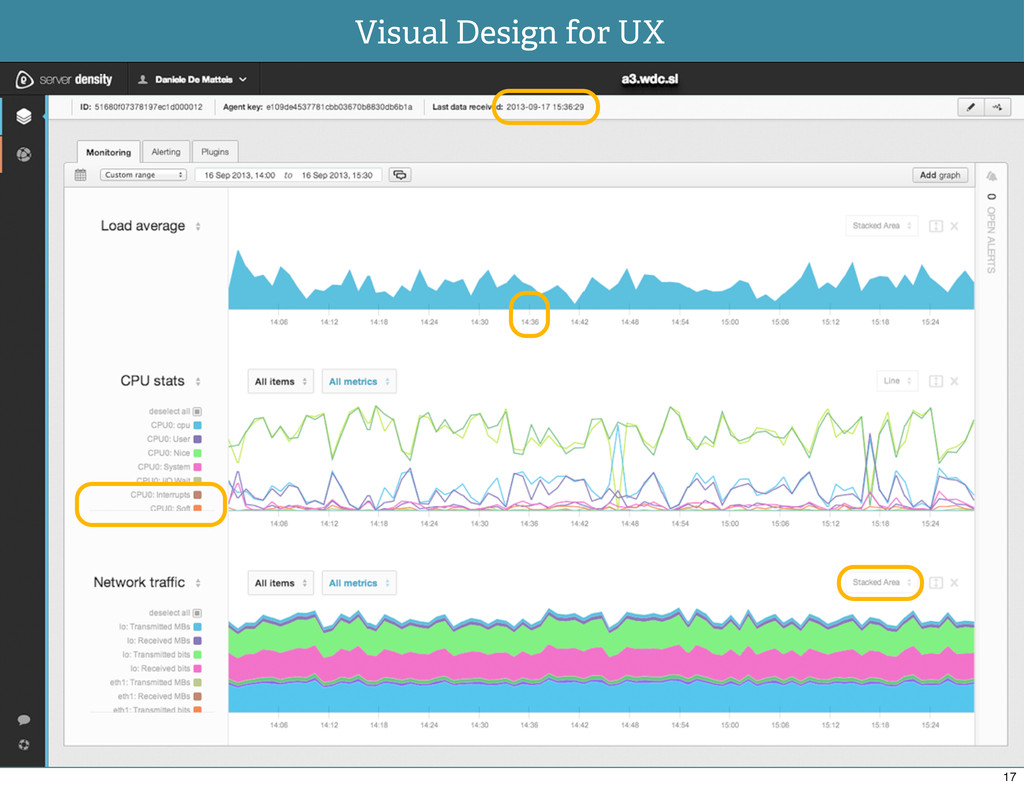
Visual Design for UX 17
Visual Design for UX 17
Visual Design for UX 17
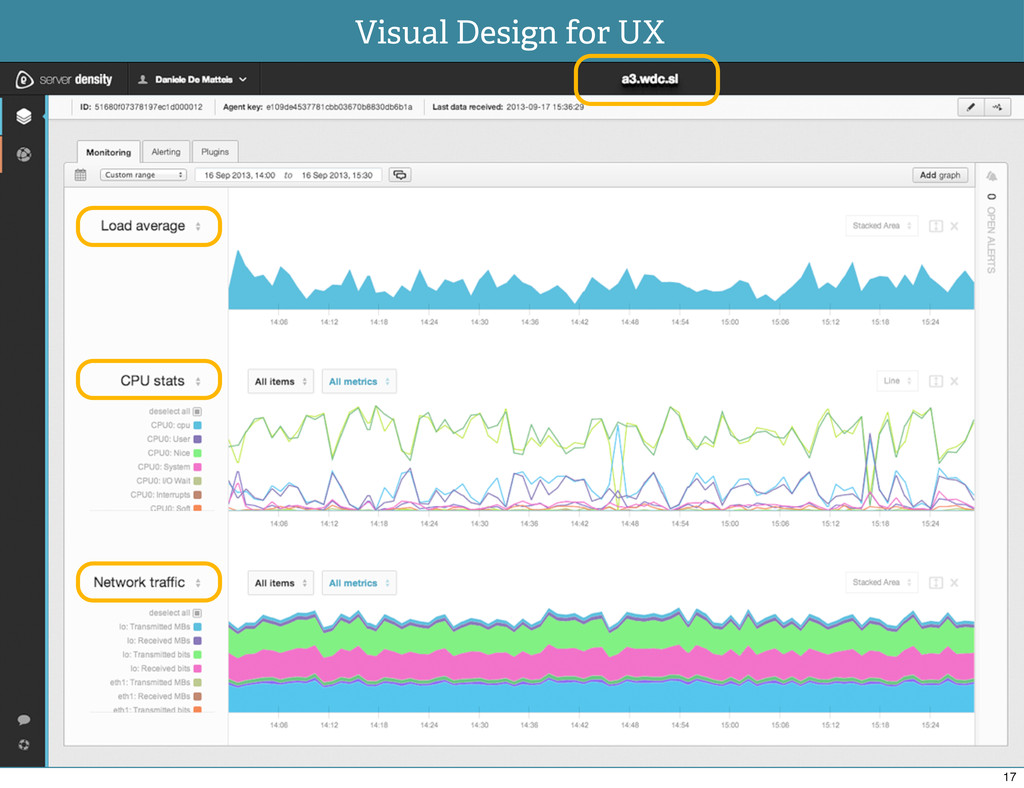
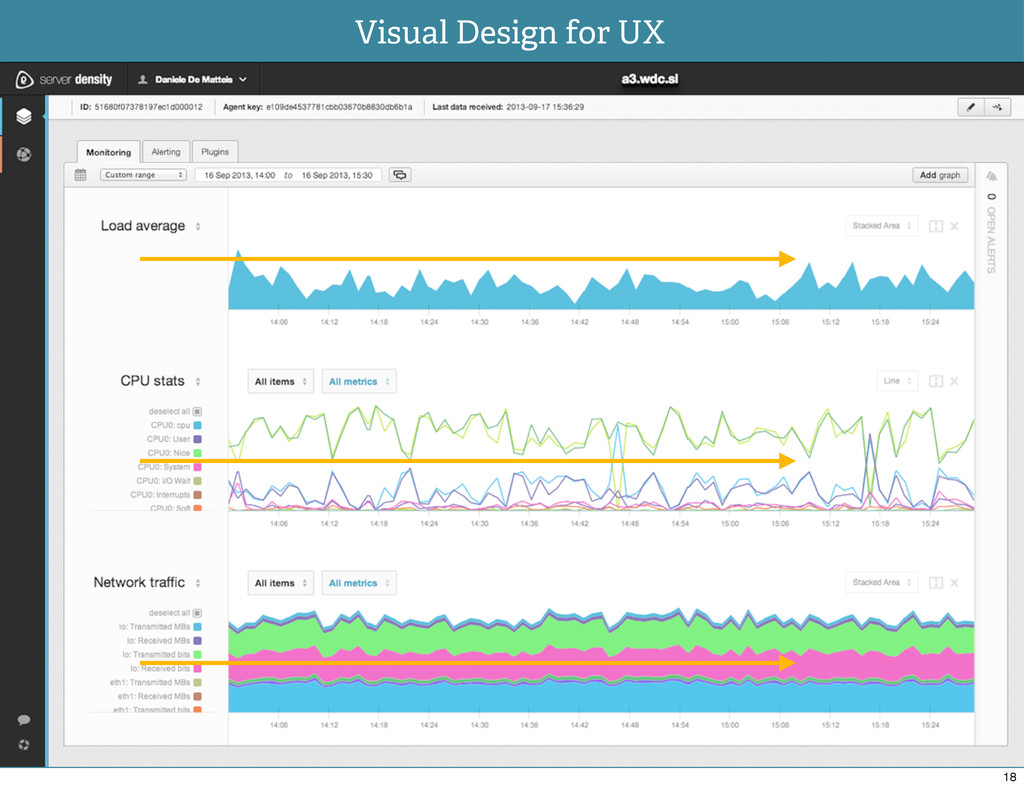
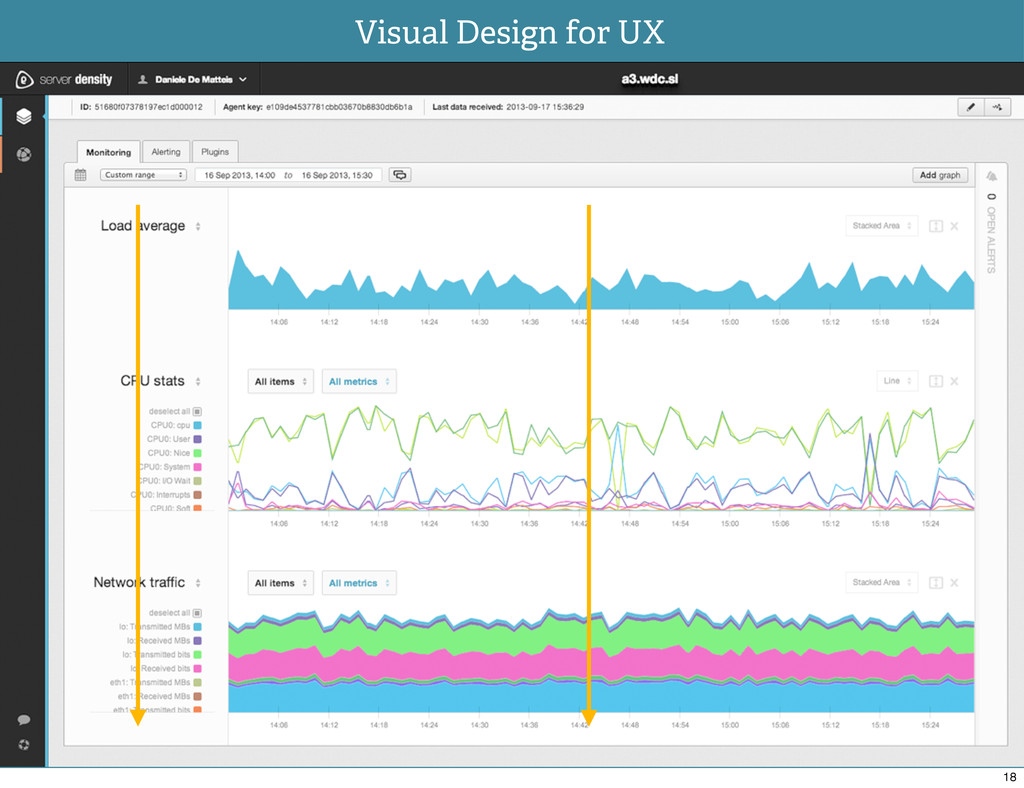
Visual Design for UX 18
Visual Design for UX 18
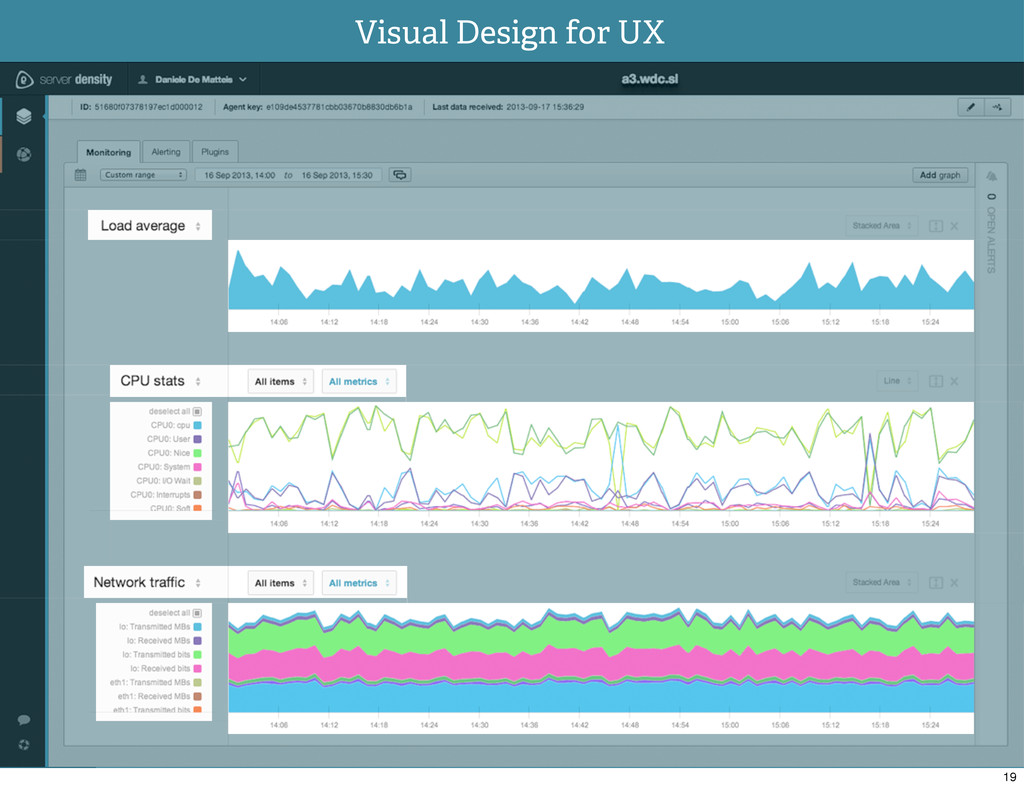
Visual Design for UX 19
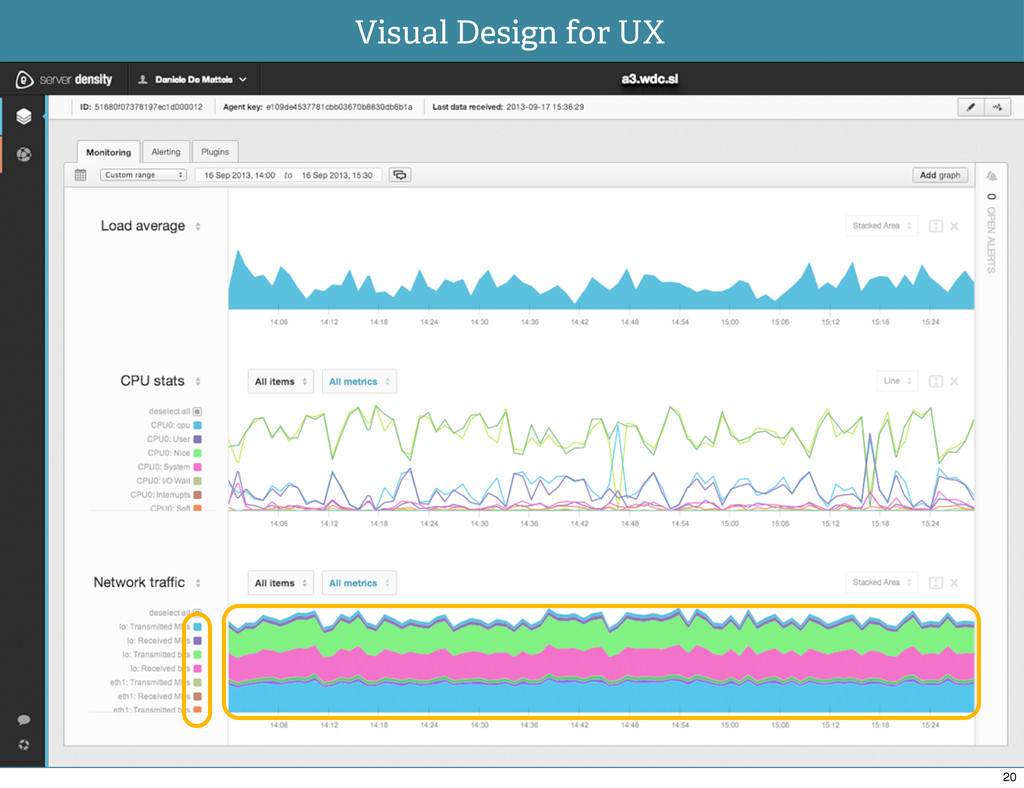
Visual Design for UX 20
Visual Design for UX 20
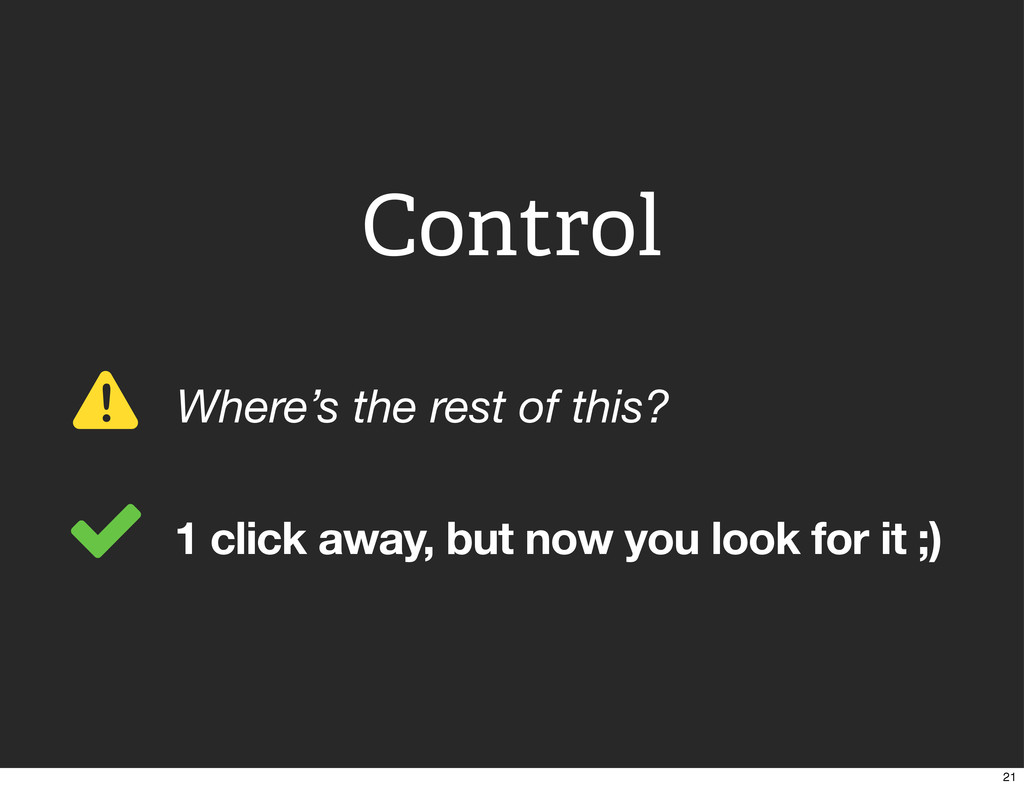
Control 21
! Where’s the rest of this? Control 21
! Where’s the rest of this? 1 click away, but
now you look for it ;) Control 21
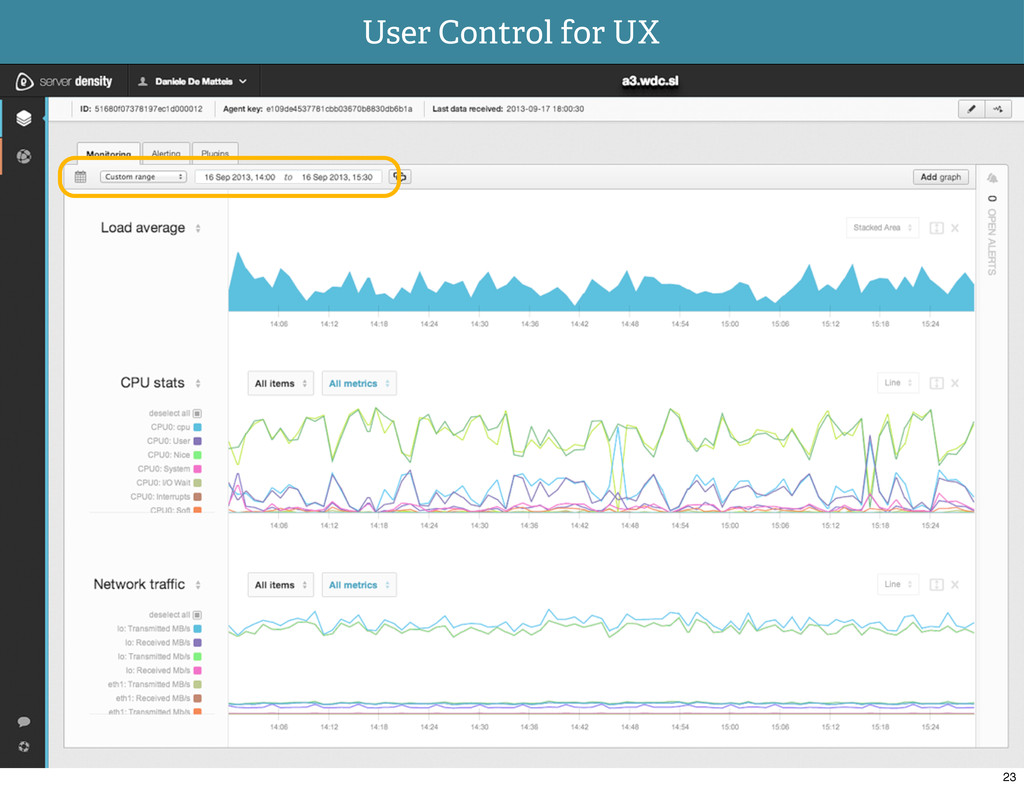
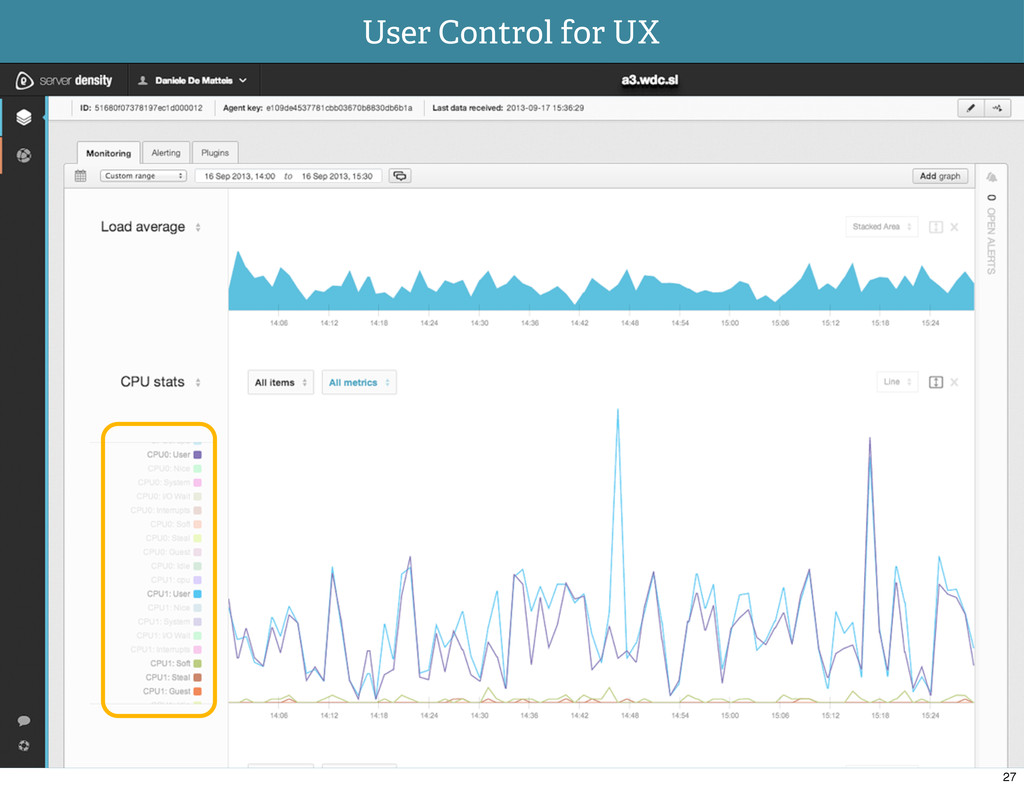
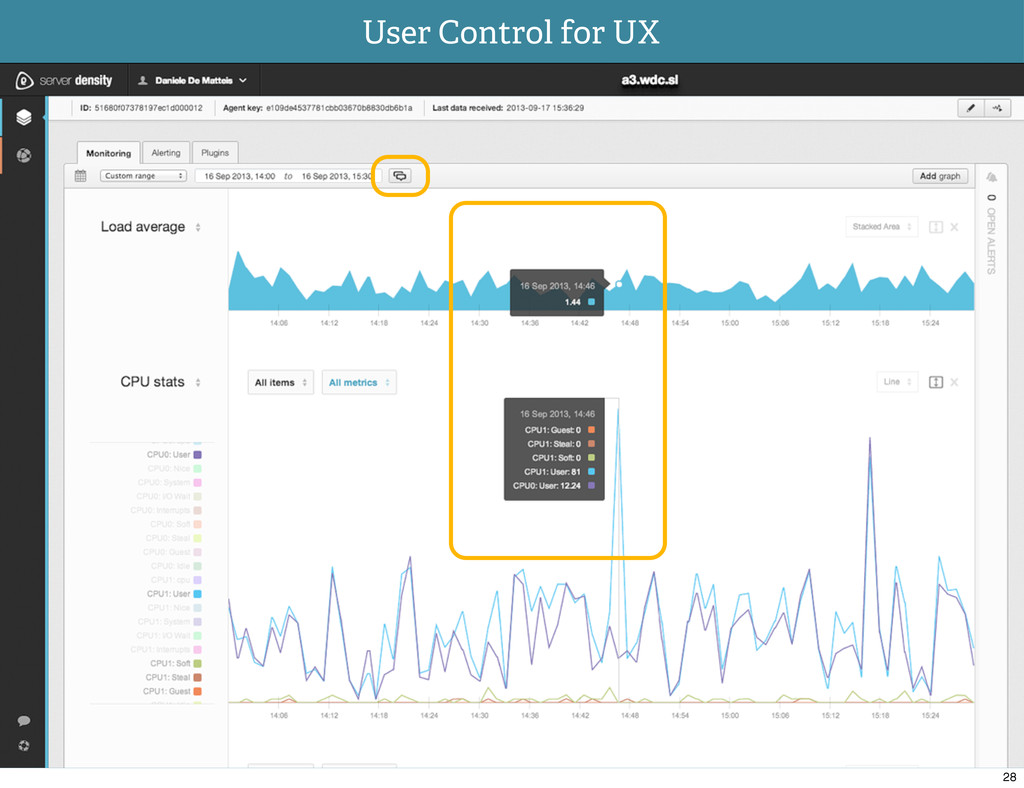
User Control for UX 23
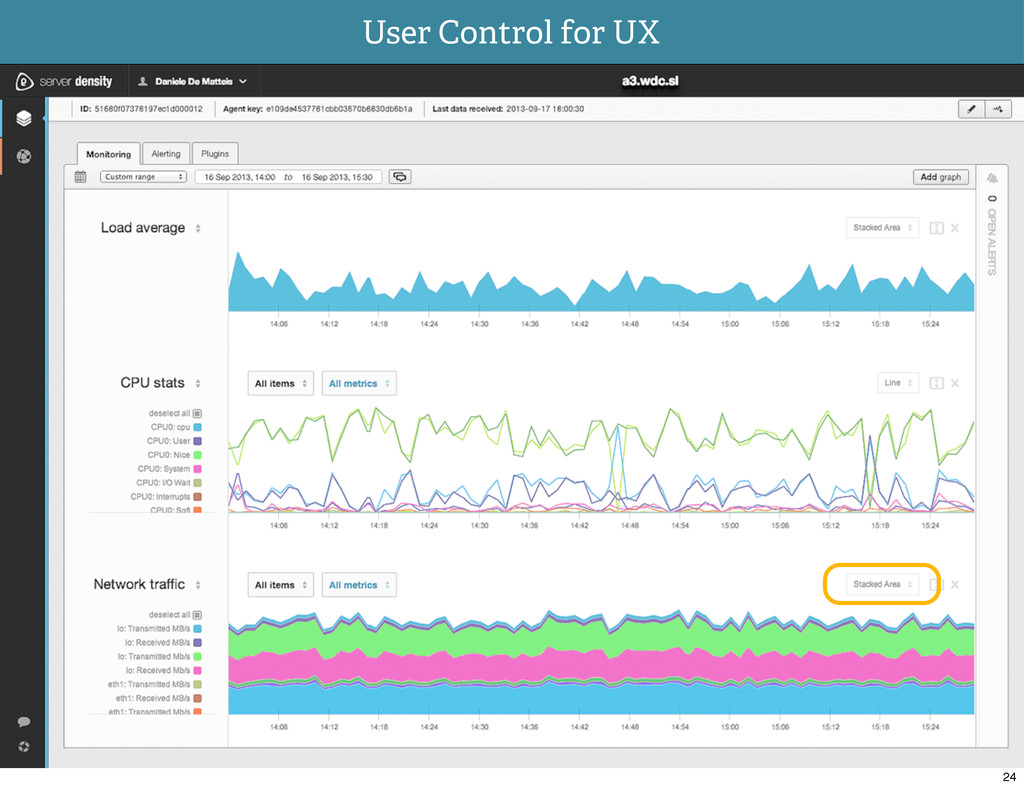
User Control for UX 24
User Control for UX 25
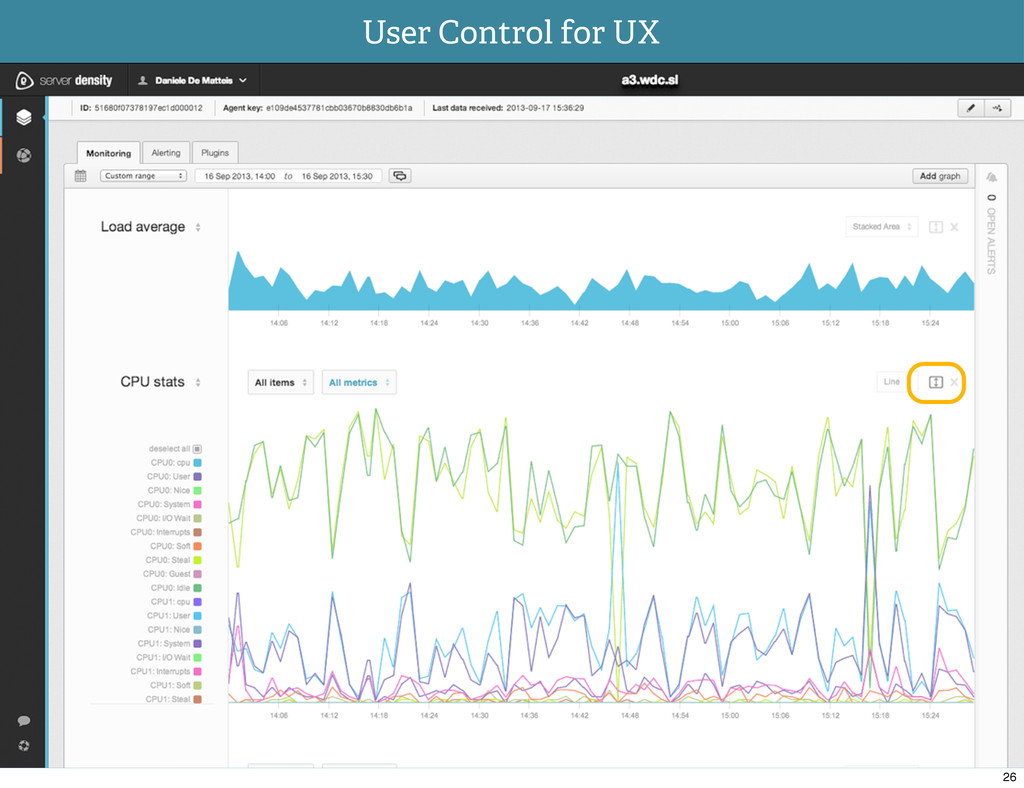
User Control for UX 26
User Control for UX 27
User Control for UX 28
good UX 㱺 action uncover system stories behind metric events
sense of place + hierarchy = understanding -- clutter ++ data density consistency build in depth give control Consistency Context Clarity Perspective Appeal Control 29
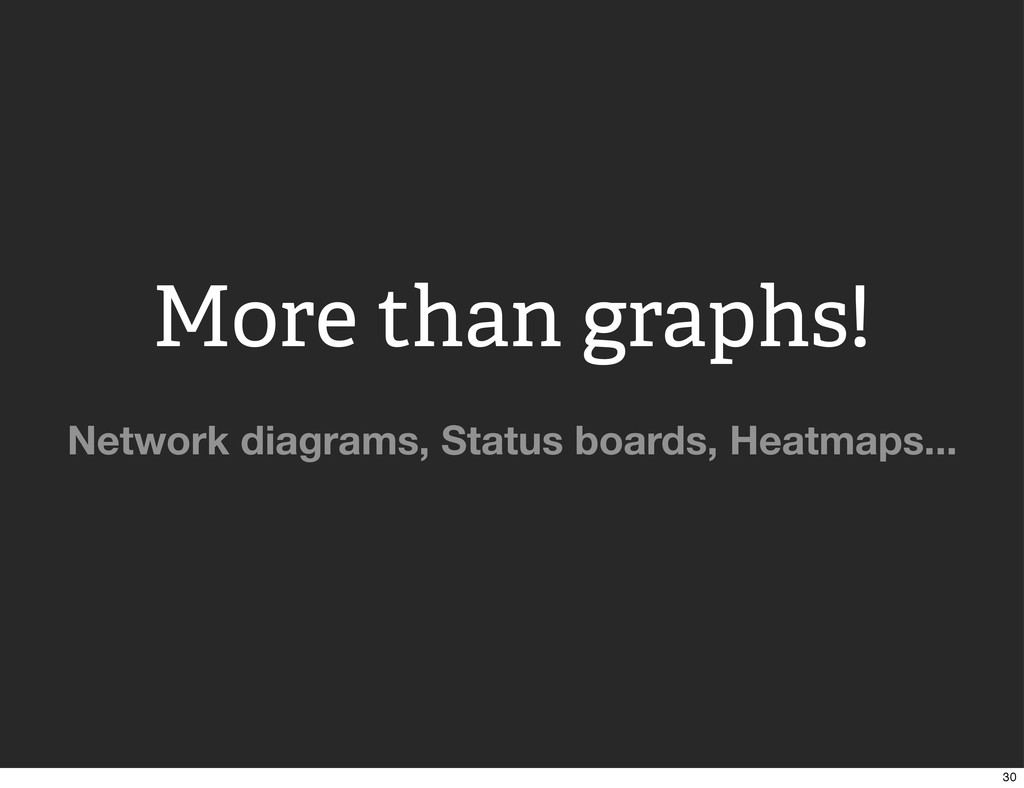
More than graphs! 30
Network diagrams, Status boards, Heatmaps... More than graphs! 30
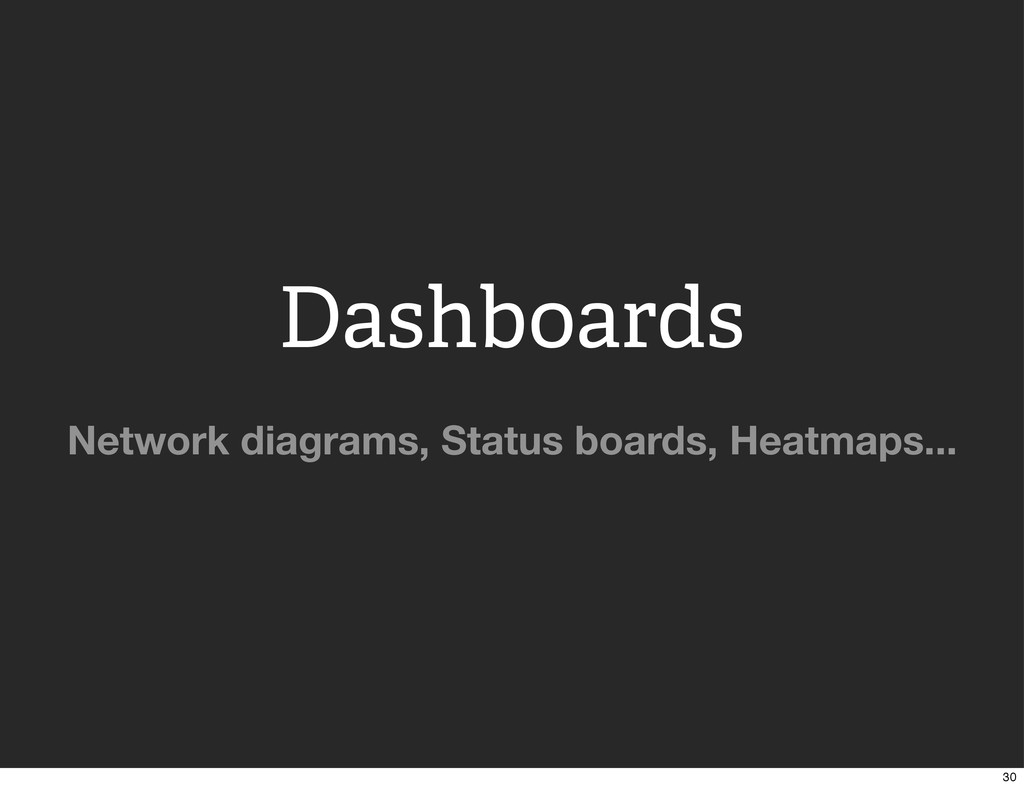
Network diagrams, Status boards, Heatmaps... Dashboards 30
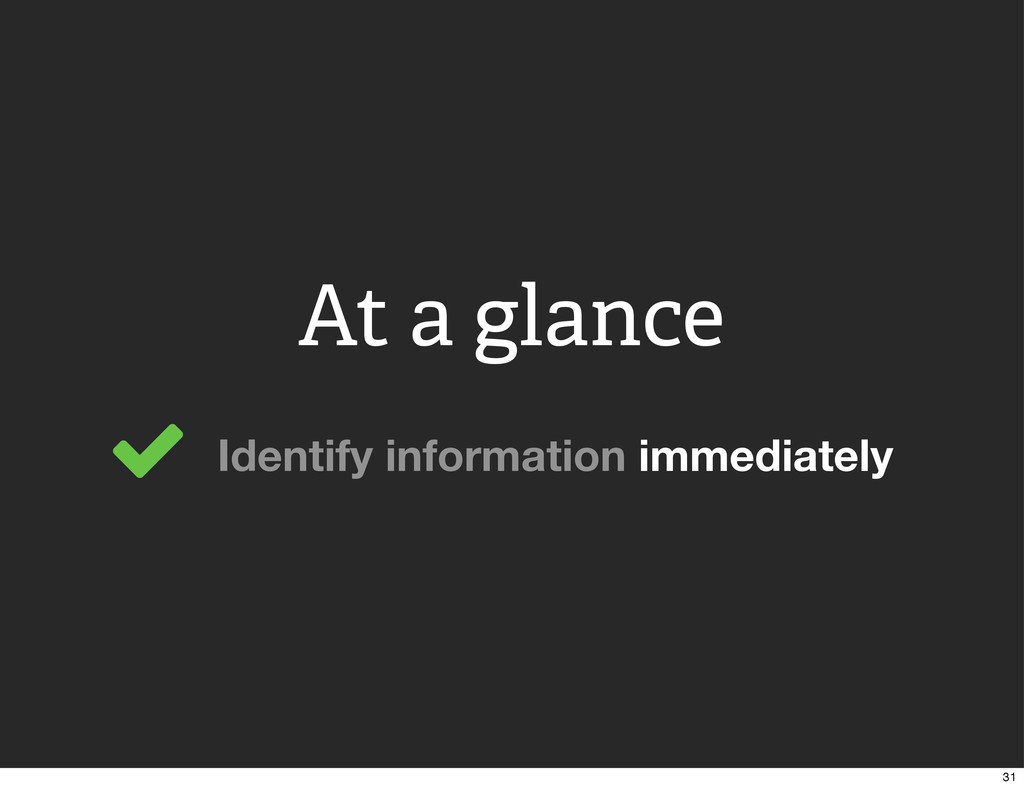
Identify information immediately At a glance 31
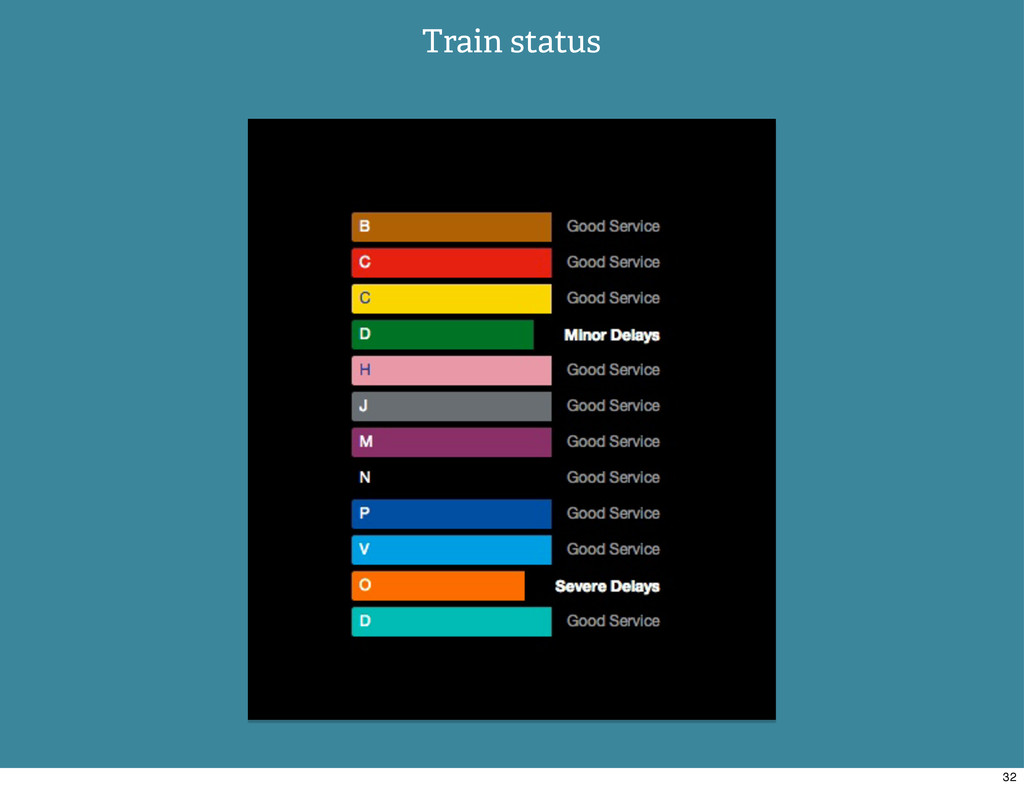
Train status 32
@morekid @harrywincup @serverdensity Thanks. Daniele De Matteis Harry Wincup serverdensity.com
33