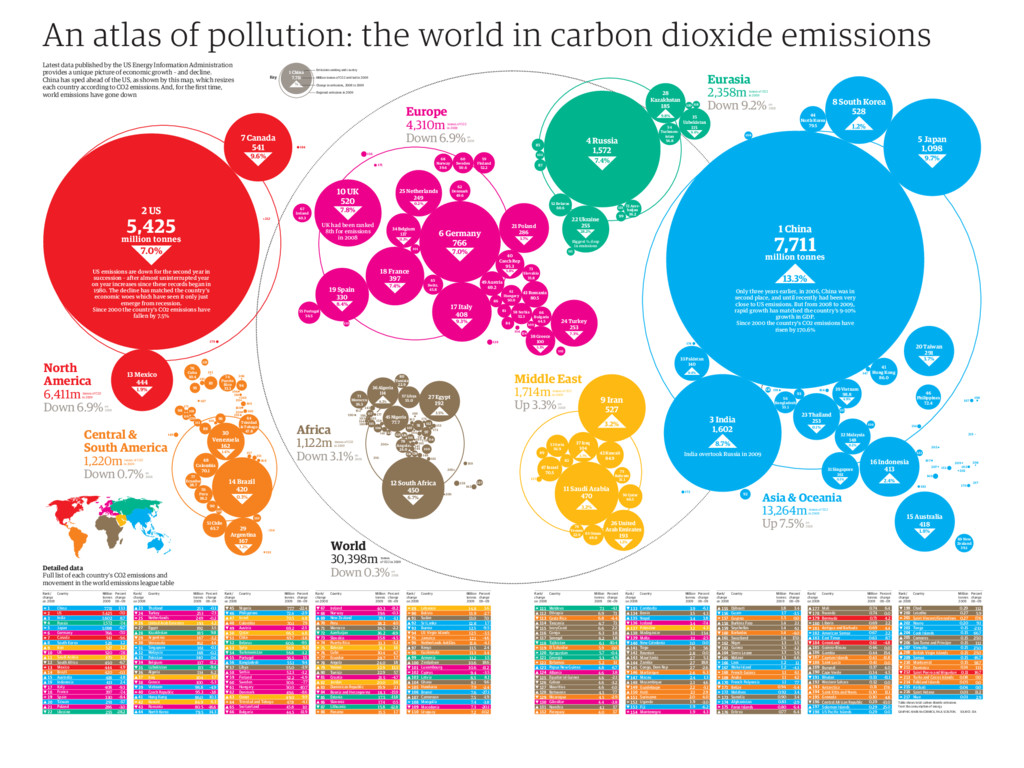
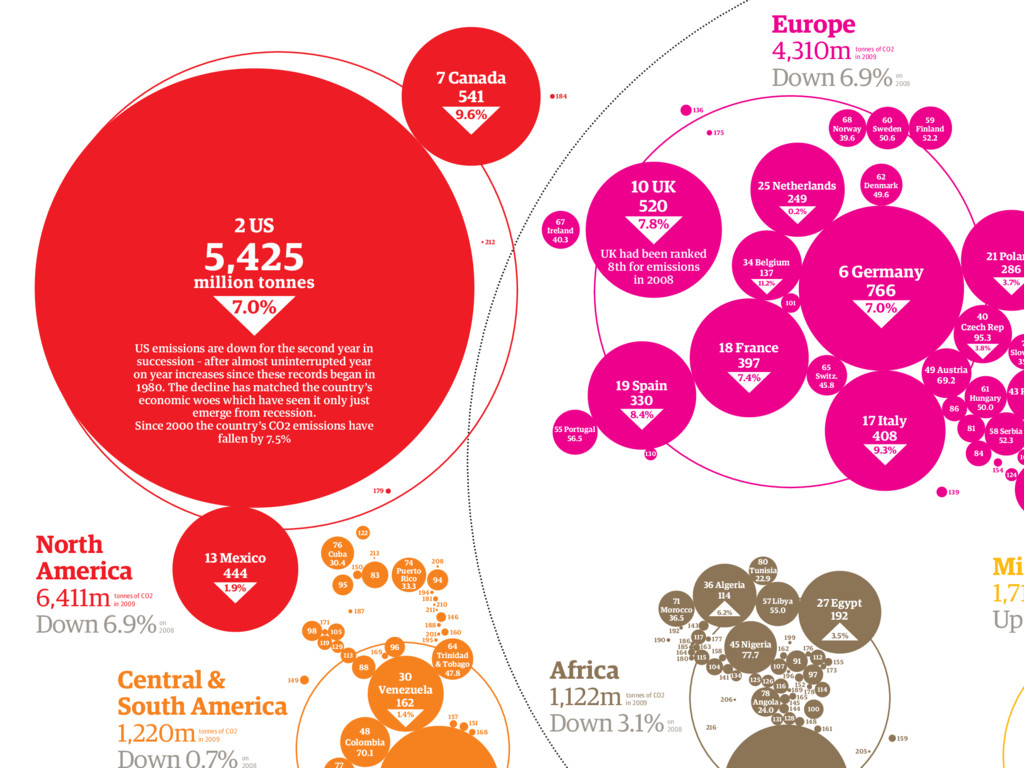
carbon dioxide emissions 182 15 Australia 418 56 Bangladesh 55.1 191 106 204 153 170 41 Hong Kong 86.0 India overtook Russia in 2009 3 India 1,602 16 Indonesia 413 5 Japan 1,098 215 44 North Korea 79.5 8 South Korea 528 166 147 0.2% 32 Malaysia 148 172 108 202 135 140 69 New Zealand 39.1 217 0.4% 33 Pakistan 140 174 123 209 0.1% 31 Singapore 161 197 92 20 Taiwan 291 23 Thailand 253 183 203 198 207 4.9% 39 Vietnam 98.8 167 156 46 Philippines 72.4 93 133 Asia & Oceania Up 7.5% 13,264m on 2008 tonnes of CO2 in 2009 Central & South America Down 0.7% 1,220m on 2008 tonnes of CO2 in 2009 Eurasia Down 9.2% 2,358m on 2008 tonnes of CO2 in 2009 World Down 0.3% 30,398m on 2008 tonnes of CO2 in 2009 Down 6.9%on 2008 North America 6,411mtonnes of CO2 in 2009 Only three years earlier, in 2006, China was in second place, and until recently had been very close to US emissions. But from 2008 to 2009, rapid growth has matched the country’s 9-10% growth in GDP. Since 2000 the country’s CO2 emissions have risen by 170.6% US emissions are down for the second year in succession – after almost uninterrupted year on year increases since these records began in 1980. The decline has matched the country’s economic woes which have seen it only just emerge from recession. Since 2000 the country’s CO2 emissions have fallen by 7.5% 13.3% 7,711 million tonnes 1 China 7.0% 5,425 million tonnes 2 US 7 Canada 541 13 Mexico 444 9.6% 8.7% 99 72 Azer- baijan 36.2 52 Belarus 60.6 85 121 9.8% 28 Kazakhstan 185 120 103 87 111 4 Russia 1,572 118 54 Turkmen- istan 56.8 28.2% 22 Ukraine 255 9.4% 35 Uzbekistan 115 7.4% 1.2% 1.9% 75 Bahrain 31.1 9 Iran 527 3.7% 37 Iraq 104 47 Israel 70.5 82 42 Kuwait 84.9 89 63 Oman 49.0 137 50 Qatar 66.5 11 Saudi Arabia 470 53 Syria 56.9 1.2% 26 United Arab Emirates 193 79 Yemen 22.9 Middle East Up 3.3% 1,714m on 2008 tonnes of CO2 in 2009 3.2% 3.2% 124 49 Austria 69.2 11.2% 34 Belgium 137 66 Bulgaria 44.5 81 102 3.8% 40 Czech Rep 95.3 62 Denmark 49.6 175 59 Finland 52.2 18 France 397 6 Germany 766 130 5.3% 38 Greece 100 61 Hungary 50.0 136 67 Ireland 40.3 17 Italy 408 101 109 139 154 0.2% 25 Netherlands 249 68 Norway 39.6 3.7% 21 Poland 286 55 Portugal 56.5 43 Romania 80.5 58 Serbia 52.3 73 Slovakia 35.8 86 19 Spain 330 60 Sweden 50.6 65 Switz. 45.8 7.3% 24 Turkey 253 UK had been ranked 8th for emissions in 2008 10 UK 520 84 Europe Down 6.9% 4,310m on 2008 tonnes of CO2 in 2009 7.0% 7.8% 7.4% 9.3% 8.4% 193 3.2% 29 Argentina 167 171 90 14 Brazil 420 51 Chile 65.7 48 Colombia 70.1 113 77 Ecuador 28.7 119 214 168 149 98 157 105 129 88 132 70 Peru 38.2 151 110 1.4% 30 Venezuela 162 181 169 122 160 187 76 Cuba 30.4 211 83 195 150 95 146 210 96 74 Puerto Rico 33.3 194 188 201 64 Trinidad & Tobago 47.8 213 94 208 0.3% Latest data published by the US Energy Information Administration provides a unique picture of economic growth – and decline. China has sped ahead of the US, as shown by this map, which resizes each country according to CO2 emissions. And, for the first time, world emissions have gone down 9.7% 2.4% 1.8% 3.7% 0.1% Biggest % drop in emissions 6.2% 36 Algeria 114 78 Angola 24.0 134 128 158 189 107 190 196 199 205 116 145 115 155 3.5% 27 Egypt 192 125 176 112 126 186 104 163 185 97 200 180 57 Libya 55.0 138 165 177 143 127 71 Morocco 36.5 148 131 45 Nigeria 77.7 142 178 216 206 117 159 164 173 91 161 114 141 80 Tunisia 22.9 152 192 144 100 162 Africa Down 3.1% 1,122m on 2008 tonnes of CO2 in 2009 6.7% 12 South Africa 450 Change in emissions, 2008 to 2009 Regional emissions in 2009 1 China 7,711 % Emissions ranking and country Million tonnes of CO2 emitted in 2009 Key Table shows total carbon dioxide emissions from the consumption of energy Rank/ change on 2008 Rank/ change on 2008 Rank/ change on 2008 Rank/ change on 2008 Rank/ change on 2008 Rank/ change on 2008 Rank/ change on 2008 Rank/ change on 2008 Rank/ change on 2008 Rank/ change on 2008 Country Million tonnes 2009 Percent change 08—09 Country Million tonnes 2009 Percent change 08—09 Country Million tonnes 2009 Percent change 08—09 Country Million tonnes 2009 Percent change 08—09 Country Million tonnes 2009 Percent change 08—09 Country Million tonnes 2009 Percent change 08—09 Country Million tonnes 2009 Percent change 08—09 Country Million tonnes 2009 Percent change 08—09 Country Million tonnes 2009 Percent change 08—09 Country Million tonnes 2009 Percent change 08—09 China US India Russia Japan Germany Canada South Korea Iran UK Saudi Arabia South Africa Mexico Brazil Australia Indonesia Italy France Spain Taiwan Poland Ukraine Thailand Turkey Netherlands United Arab Emirates Egypt Kazakhstan Argentina Venezuela Singapore Malaysia Pakistan Belgium Uzbekistan Algeria Iraq Greece Vietnam Czech Republic Hong Kong Kuwait Romania North Korea Nigeria Philippines Israel Colombia Austria Qatar Chile Belarus Syria Turkmenistan Portugal Bangladesh Libya Serbia Finland Sweden Hungary Denmark Oman Trinidad and Tobago Switzerland Bulgaria Ireland Norway New Zealand Peru Morocco Azerbaijan Slovakia Puerto Rico Bahrain Cuba Ecuador Angola Yemen Tunisia Croatia Jordan Dominican Republic Bosnia and Herzegovina Estonia Slovenia Lithuania Panama Lebanon Bolivia Sudan Sri Lanka Burma US Virgin Islands Jamaica Netherlands Antilles Kenya Guatemala Armenia Zimbabwe Luxembourg Cyprus Latvia Ghana Honduras Brunei Cameroon Mongolia Macedonia Uruguay Moldova Ethiopia Costa Rica Tanzania IvoryCoast Congo Senegal Tajikistan El Salvador Kyrgyzstan Georgia Bahamas Papua New Guinea Albania Equatorial Guinea Gabon Mauritius Botswana Nicaragua Gibraltar Namibia Paraguay Cambodia Benin Nepal Iceland Palestine Madagascar Malta New Caledonia Togo Reunion Mauritania Zambia Congo, Dem Rep Martinique Macau Mozambique Guadeloupe Haiti Suriname Uganda Fiji Montenegro Djibouti Guam Guyana Burkina Faso Seychelles Barbados Swaziland Niger Guinea Sierra Leone Malawi Laos Wake Island French Guiana Aruba French Polynesia Belize Maldives Somalia Afghanistan Faroe Islands Eritrea Mali Rwanda Bermuda Liberia Antigua and Barbuda American Samoa East Timor Greenland Guinea-Bissau Gambia Cayman Islands Saint Lucia Burundi Cape Verde Bhutan Western Sahara Antarctica Saint Kitts and Nevis Grenada Central African Republic Solomon Islands US Pacific Islands Chad Lesotho Saint Vincent/Grenadines Nauru Tonga Cook Islands Comoros Sao Tome and Principe Vanuatu British Virgin Islands Samoa Montserrat Dominica Saint Pierre and Miquelon Turks and Caicos Islands Falkland Islands Kiribati Saint Helena Niue 1 2 3 4 5 6 7 8 9 10 11 12 13 14 15 16 17 18 19 20 21 22 23 24 25 26 27 28 29 30 31 32 33 34 35 36 37 38 39 40 41 42 43 44 45 46 47 48 49 50 51 52 53 54 55 56 57 58 59 60 61 62 63 64 65 66 67 68 69 70 71 72 73 74 75 76 77 78 79 80 81 82 83 84 85 86 87 88 89 90 91 92 93 94 95 96 97 98 99 100 101 102 103 104 105 106 107 108 109 110 111 112 113 114 115 116 117 118 119 120 121 122 123 124 125 126 127 128 129 130 131 132 133 134 135 136 137 138 139 140 141 142 143 144 145 146 147 148 149 150 151 152 153 154 155 156 157 158 159 160 161 162 163 164 165 166 167 168 169 170 171 172 173 174 175 176 177 178 179 180 181 182 183 184 185 186 187 188 189 190 191 192 193 194 195 196 197 198 199 200 201 202 203 204 205 206 207 208 209 210 211 212 213 214 215 216 217 13.3 -7.0 8.7 -7.4 -9.7 -7.0 -9.6 1.2 3.2 -7.8 3.2 -6.7 -1.9 -0.3 -1.8 2.4 -9.3 -7.4 -8.4 -3.7 -3.0 -28.2 -0.1 -7.3 -0.2 -1.2 3.5 9.8 -3.2 -1.4 -0.1 -0.2 0.4 -11.2 -9.4 6.2 3.7 -5.3 -4.9 -3.8 10.3 6.3 -16.6 14.3 -22.4 -2.9 4.8 7.9 -2.5 4.8 -3.8 -9.5 6.1 -1.2 1.5 9.4 -3.9 -3.2 -4.9 -7.7 -10.7 -8.6 9.9 -4.1 1.0 -11.9 -11.2 -0.3 -1.1 4.0 -2.2 -8.9 -4.5 -3.2 1.6 4.7 1.7 1.8 13.5 5.7 -4.7 2.4 2.1 -15.9 -11.8 0.5 -12.8 1.7 3.6 -2.7 7.0 1.7 -9.5 -3.5 -4.6 -4.1 2.4 -1.4 1.5 18.6 -11.2 -3.5 8.1 9.6 -2.4 -27.1 -1.9 -3.8 -20.1 -10.2 -4.1 7.1 -4.4 7.1 2.2 3.8 1.8 -10.4 0.0 -0.4 -4.9 3.1 6.7 3.8 -2.1 -3.2 -1.0 7.7 -2.9 -3.8 3.7 3.7 -6.1 4.3 3.8 -7.4 4.3 13.4 -2.5 0.0 5.6 0.0 5.3 18.8 -2.6 6.3 1.3 4.6 -5.1 2.9 4.0 -3.0 -6.2 4.3 3.4 -3.5 0.0 2.1 6.1 -4.0 17.0 3.5 -1.2 5.9 4.6 1.1 -4.3 6.1 4.2 7.7 -5.4 3.4 3.4 -2.9 6.4 6.4 6.4 0.0 4.2 2.2 4.4 2.2 8.7 -4.8 0.0 15.4 -11.8 0.0 4.0 4.5 -11.1 0.0 17.6 11.1 4.8 -13.0 25.0 0.0 11.1 5.9 17.6 9.1 -23.1 66.7 25.0 11.1 25.0 25.0 -16.7 58.7 11.1 16.7 0.0 0.0 0.0 11.2 2.9 7,711 5,425 1,602 1,572 1,098 766 541 528 527 520 470 450 444 420 418 413 408 397 330 291 286 255 253 253 249 193 192 185 167 162 161 148 140 137 115 114 104 100 98.8 95.3 86.0 84.9 80.5 79.5 77.7 72.4 70.5 70.1 69.2 66.5 65.7 60.6 56.9 56.8 56.5 55.1 55.0 52.3 52.2 50.6 50.0 49.6 49.0 47.8 45.8 44.5 40.3 39.6 39.1 38.2 36.5 36.2 35.8 33.3 31.1 30.4 28.7 24.0 22.9 22.9 21.5 20.0 19.9 18.3 17.5 17.4 15.8 15.5 14.8 13.9 13.0 12.8 12.5 12.5 12.1 11.6 11.5 11.3 11.2 10.6 10.6 9.4 8.5 8.1 7.9 7.6 7.5 7.4 7.3 7.2 7.1 6.9 6.8 6.7 6.6 6.3 6.2 6.1 5.9 5.7 5.3 5.2 4.8 4.6 4.6 4.6 4.6 4.5 4.5 4.4 4.1 4.0 3.9 3.5 3.4 3.4 3.2 3.1 3.1 3.0 2.8 2.8 2.7 2.7 2.7 2.6 2.4 2.3 2.2 2.1 2.0 1.9 1.9 1.9 1.8 1.7 1.5 1.4 1.4 1.4 1.4 1.3 1.3 1.3 1.3 1.2 1.2 1.1 1.1 1.1 0.94 0.92 0.90 0.83 0.80 0.77 0.74 0.74 0.71 0.69 0.69 0.67 0.63 0.61 0.46 0.44 0.43 0.41 0.37 0.34 0.33 0.32 0.31 0.30 0.30 0.29 0.29 0.29 0.29 0.27 0.27 0.20 0.15 0.15 0.15 0.15 0.15 0.15 0.15 0.15 0.14 0.11 0.08 0.05 0.04 0.01 0.01 Detailed data Full list of each country’s CO2 emissions and movement in the world emissions league table GRAPHIC: MARK McCORMICK, PAUL SCRUTON. SOURCE: EIA