Upgrade to Pro — share decks privately, control downloads, hide ads and more …

Graph Everything!

Oliver Hankeln
September 20, 2013

Graph Everything!

This is my talk for Monitorama EU 2013. Covering how we at gutefrage.net store our Metrics in openTSDB and our experiences with it.
Also some thoughts about related topics like alerting, some creative (or crazy?) metrics.

Oliver Hankeln

September 20, 2013
Tweet

More Decks by Oliver Hankeln

Other Decks in Programming

Transcript

  1. Who am I? Senior Engineer - Data and Infrastructure at

    gutefrage.net GmbH Was doing software development before DevOps advocate Samstag, 21. September 13
  2. Who is Gutefrage.net? Germany‘s biggest Q&A platform #1 German site

    (mobile) about 5M Unique Users #3 German site (desktop) about 17M Unique Users > 4 Mio PI/day Part of the Holtzbrinck group Running several platforms (Gutefrage.net, Helpster.de, Cosmiq, Comprano, ...) Samstag, 21. September 13
  3. What you will get How do we store our metrics?

    Our experiences with that setup Why the hell are we doing that? Some thoughts on metrics Samstag, 21. September 13
  4. Our requirements Creating new metrics has to be simple no

    compaction (bye bye RRDTool) System has to scale Samstag, 21. September 13
  5. openTSDB Written at StumbleUpon but OpenSource Uses HBase as a

    storage Distributed system (multiple TSDs) Samstag, 21. September 13
  6. The ecosystem App feeds metrics in via RabbitMQ We base

    Icinga checks on the metrics We evaluate etsy Skyline for anomaly detection We deploy sensors via chef Samstag, 21. September 13
  7. What works well We store about 200M data points in

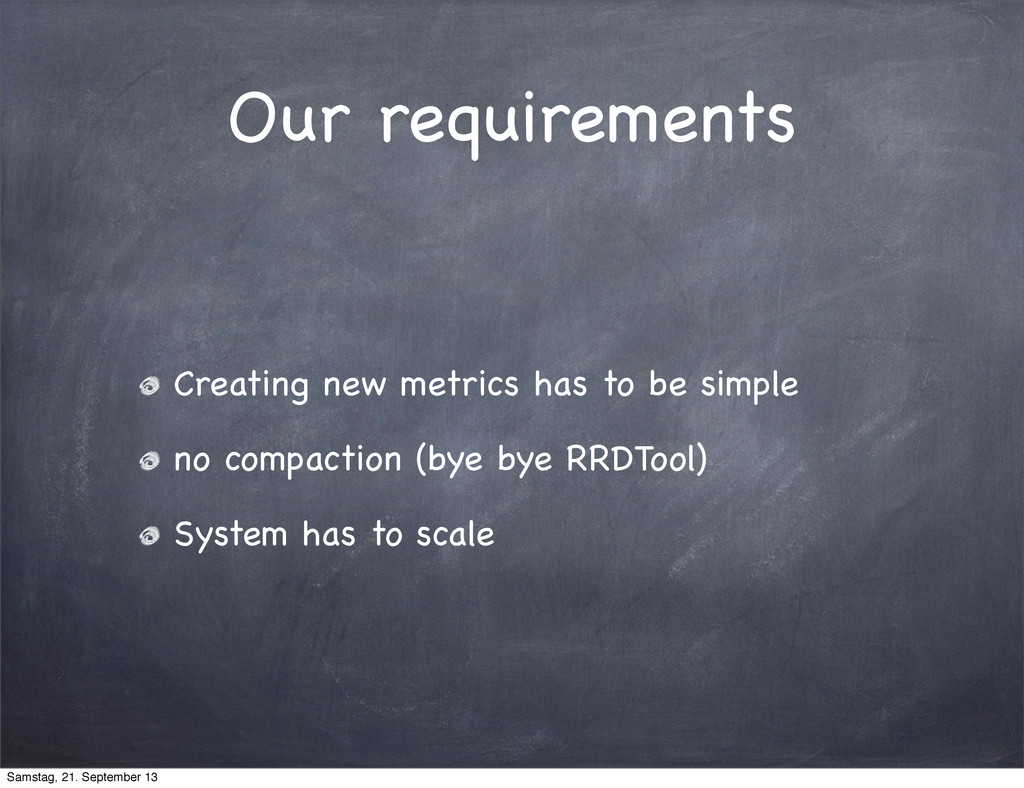
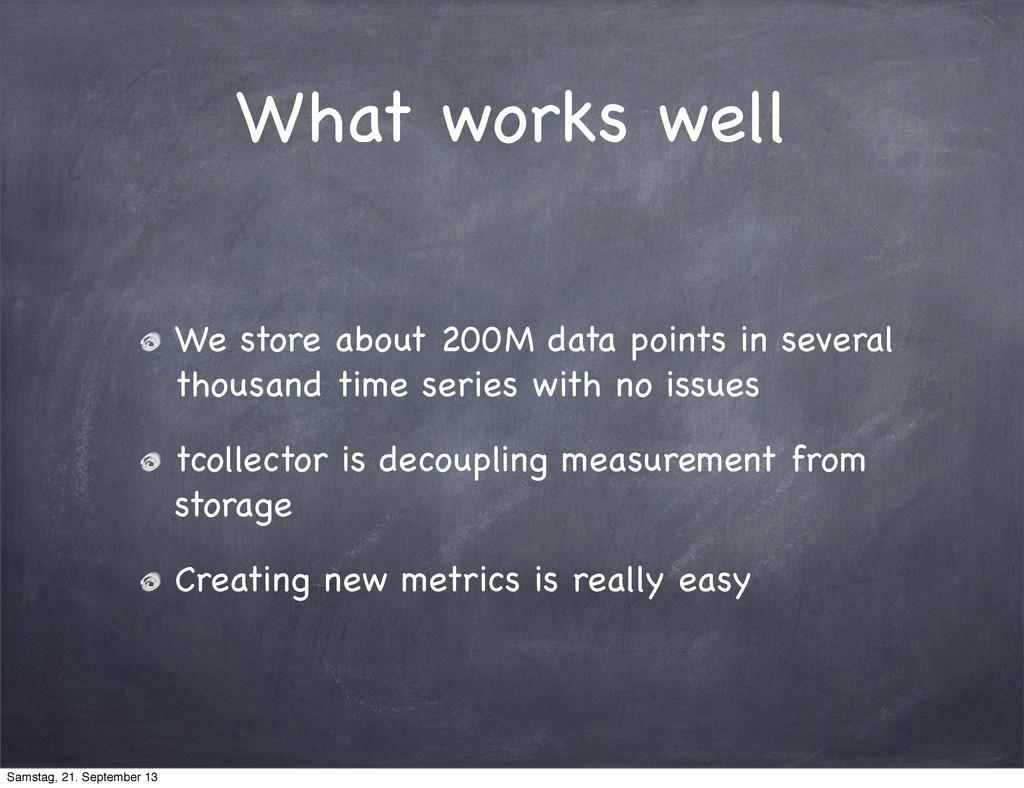
    several thousand time series with no issues tcollector is decoupling measurement from storage Creating new metrics is really easy Samstag, 21. September 13
  8. Challenges The UI is seriously lacking no annotation support out

    of the box Only 1s time resolution (and only 1 value/s/ time series) Samstag, 21. September 13
  9. salvation is coming OpenTSDB 2 is around the corner millisecond

    precision annotations and meta data decent API Samstag, 21. September 13
  10. Communication Replace gut feeling with real data Helps to avoid

    the blame game Brains prefer graphs to numbers Samstag, 21. September 13
  11. Getting insights We move towards Continuous Deployment Complex systems show

    emergent behaviour Graphs are the correct flight level Samstag, 21. September 13
  12. Lean Startup Build - Measure - Learn cycle You have

    to define measureable goals No. It‘s measure not guessing Samstag, 21. September 13
  13. Perspectives Operations (Server load, traffic, disk space,...) Developers (DB Queries/PageView,

    JS errors,...) Product Owners (Content creation, Content Quality, ...) ... Samstag, 21. September 13
  14. Public display Helps that everyone feels involved n+1 eyes see

    more than n eyes Needs a culture of trust Samstag, 21. September 13
  15. Alerting Fixed values for alerts are not good enough Drawing

    Attention vs. Alerting False positives are bugs Don‘t call the on-call-guy for nothing Samstag, 21. September 13
  16. Metrics != boring You can (and should) get creative with

    what you measure. Have some brainstorming sessions Insights may come from surprising places Samstag, 21. September 13
  17. Track team happiness There is no fixed scale It forces

    you to communicate If you listen you can find problems in the team Samstag, 21. September 13
  18. Track ops confidence create a platform where you can buy

    or sell your on-call shifts. The price for a shift tells you how confident the team is. This has not been tested - yet. Samstag, 21. September 13
  19. Track recruiting efforts Helps to get a feeling about the

    job market Reminds everyone to keep looking for new colleagues BTW: we are hiring ;-) Samstag, 21. September 13
  20. Image Sources: Plane: Felix Gottwald - www.felixgottwald.net (Creative Commons Attribution

    Share Alike 3.0German) Talking men: Deutsche Fotothek - Peter, Richard sen. Money: Wikimedia contributor Avij Other images: Oliver Hankeln This presentation is licenced under Creative Commons Attribution Share Alike 3.0 Samstag, 21. September 13