Upgrade to Pro — share decks privately, control downloads, hide ads and more …

IPC 2013 / WTC 2013: openTSDB

IPC 2013 / WTC 2013: openTSDB

This talk covers openTSDB, culture around monitoring. It looks into how openTSDB stores its data in HBase, which is based on HDFS.
I share our experiences and give advice on how to use this measuring tool

Oliver Hankeln

October 30, 2013
Tweet

More Decks by Oliver Hankeln

Other Decks in Technology

Transcript

  1. openTSDB - Metrics for a distributed world Oliver Hankeln /

    gutefrage.net @mydalon Mittwoch, 30. Oktober 13
  2. Who am I? Senior Engineer - Data and Infrastructure at

    gutefrage.net GmbH Was doing software development before DevOps advocate Mittwoch, 30. Oktober 13
  3. Who is Gutefrage.net? Germany‘s biggest Q&A platform #1 German site

    (mobile) about 5M Unique Users #3 German site (desktop) about 17M Unique Users > 4 Mio PI/day Part of the Holtzbrinck group Running several platforms (Gutefrage.net, Helpster.de, Cosmiq, Comprano, ...) Mittwoch, 30. Oktober 13
  4. What you will get Why we chose openTSDB What is

    openTSDB? How does openTSDB store the data? Our experiences Some advice Mittwoch, 30. Oktober 13
  5. We were looking at some options Munin Graphite openTSDB Ganglia

    Scales well no sort of yes yes Keeps all data no no yes no Creating metrics easy easy easy easy Mittwoch, 30. Oktober 13
  6. We have a winner! Munin Graphite openTSDB Ganglia Scales well

    no sort of yes yes Keeps all data no no yes no Creating metrics easy easy easy easy Bingo! Mittwoch, 30. Oktober 13
  7. Separation of concerns UI was not important for our decision

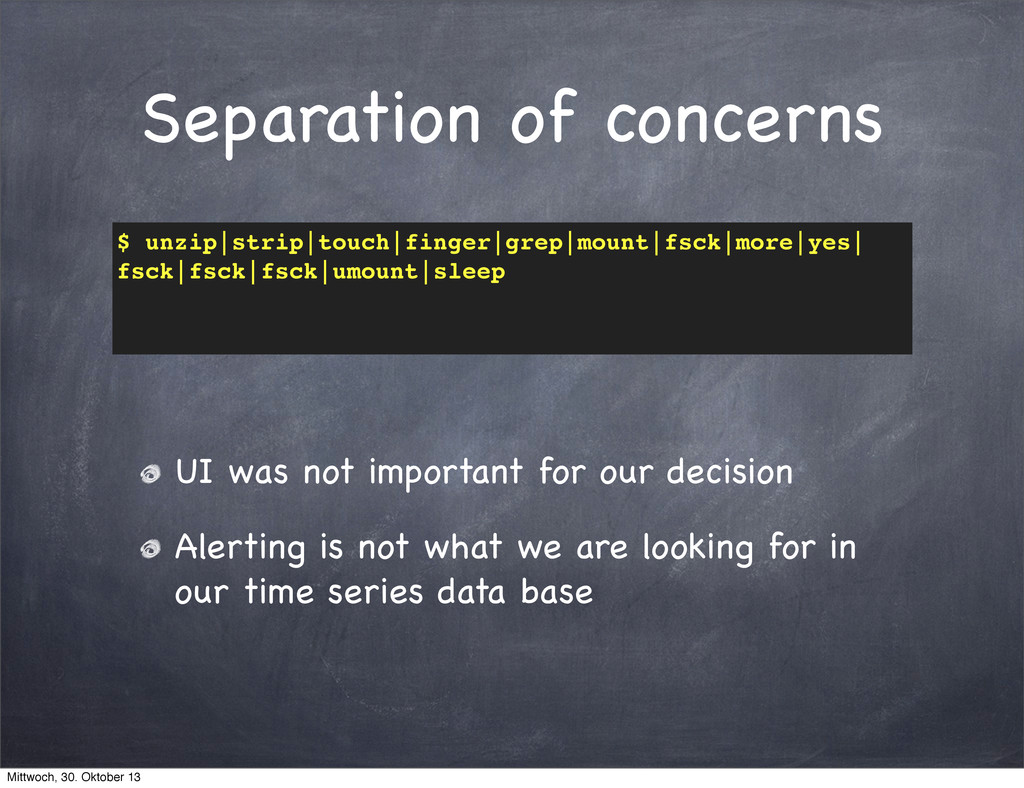
    Alerting is not what we are looking for in our time series data base $ unzip|strip|touch|finger|grep|mount|fsck|more|yes| fsck|fsck|fsck|umount|sleep Mittwoch, 30. Oktober 13
  8. The ecosystem App feeds metrics in via RabbitMQ We base

    Icinga checks on the metrics We evaluate Skyline and Oculus by Etsy for anomaly detection We deploy sensors via chef Mittwoch, 30. Oktober 13
  9. openTSDB Written by Benoît Sigoure at StumbleUpon OpenSource (get it

    from github) Uses HBase (which is based on HDFS) as a storage Distributed system (multiple TSDs) Mittwoch, 30. Oktober 13
  10. The big picture HBase TSD TSD TSD TSD UI API

    tcollector This is really a cluster Mittwoch, 30. Oktober 13
  11. Putting data into openTSDB $ telnet tsd01.acme.com 4242 put proc.load.avg5min

    1382536472 23.2 host=db01.acme.com Mittwoch, 30. Oktober 13
  12. It gets even better tcollector is a python script that

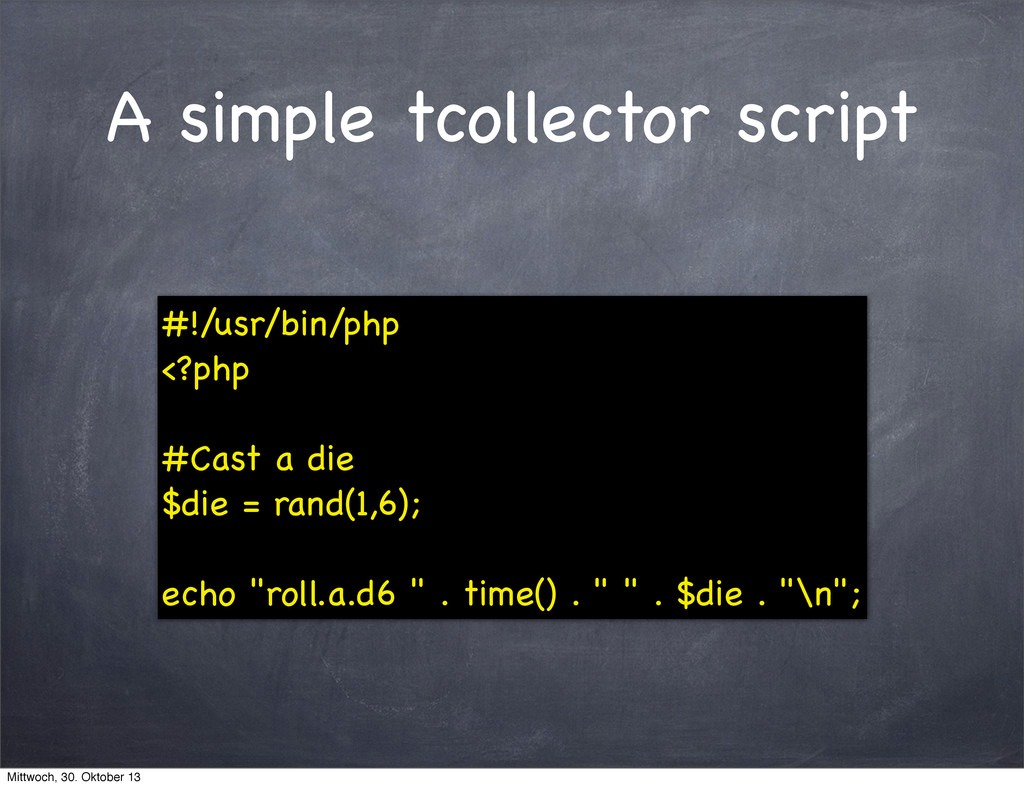
    runs your collectors handles network connection, starts your collectors at set intervals does basic process management adds host tag, does deduplication Mittwoch, 30. Oktober 13
  13. A simple tcollector script #!/usr/bin/php <?php #Cast a die $die

    = rand(1,6); echo "roll.a.d6 " . time() . " " . $die . "\n"; Mittwoch, 30. Oktober 13
  14. What was that HDFS again? HDFS is a distributed filesystem

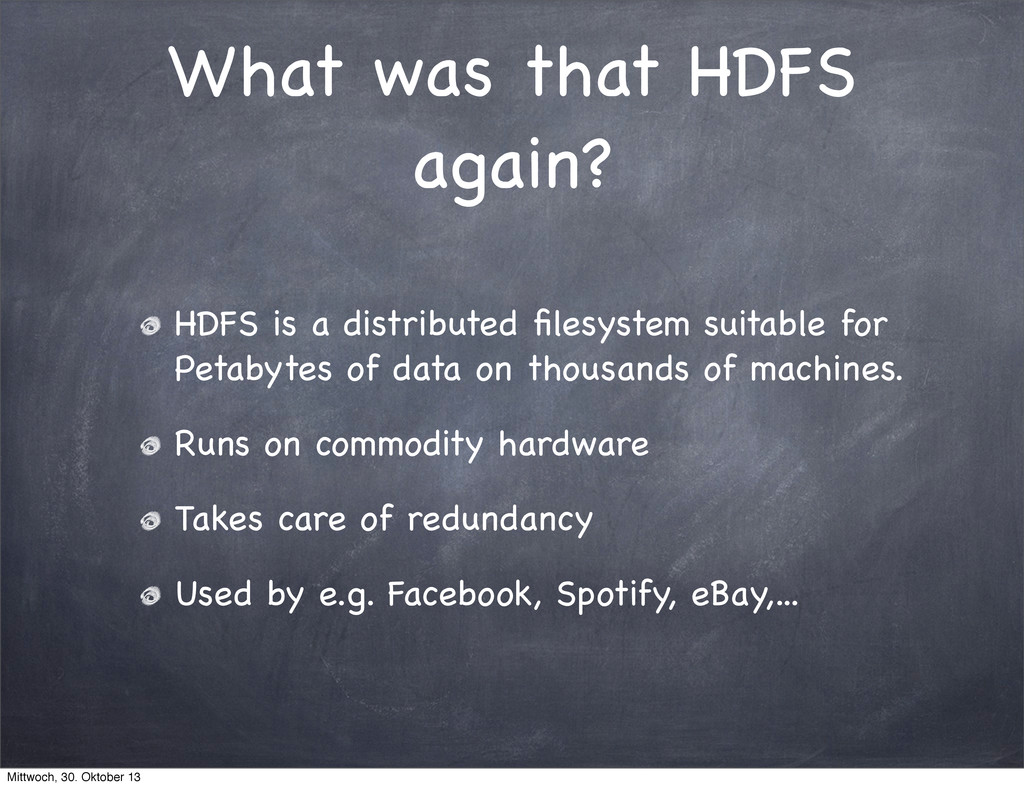
    suitable for Petabytes of data on thousands of machines. Runs on commodity hardware Takes care of redundancy Used by e.g. Facebook, Spotify, eBay,... Mittwoch, 30. Oktober 13
  15. Okay... and HBase? HBase is a NoSQL database / data

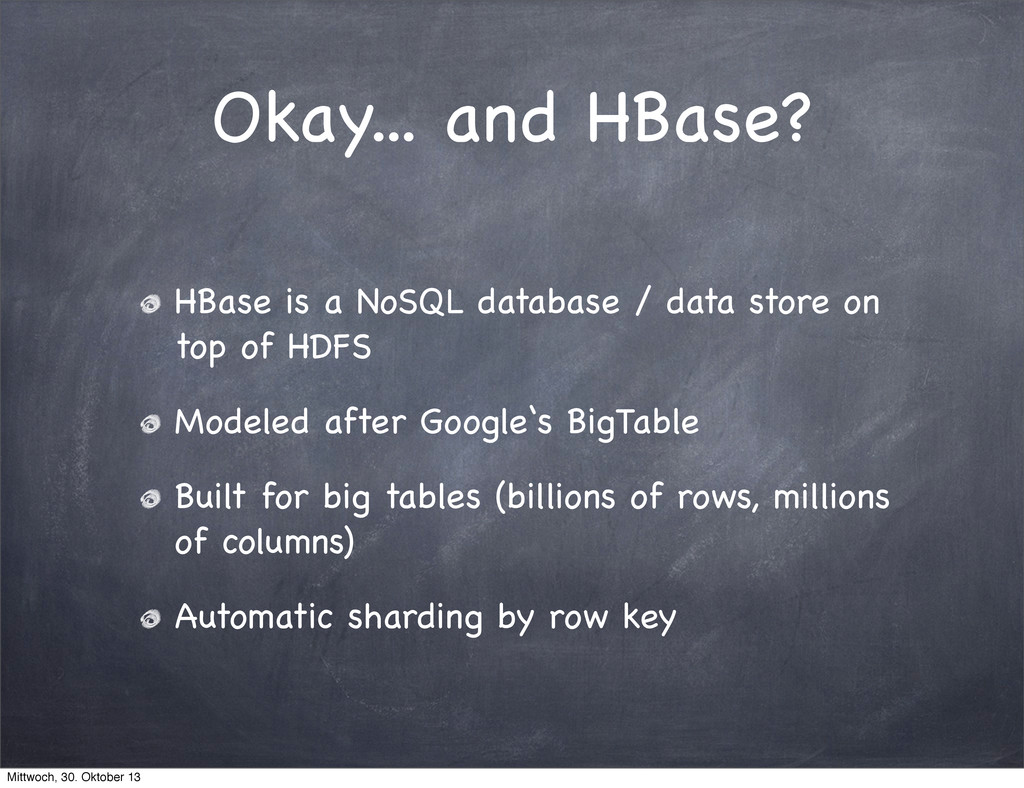
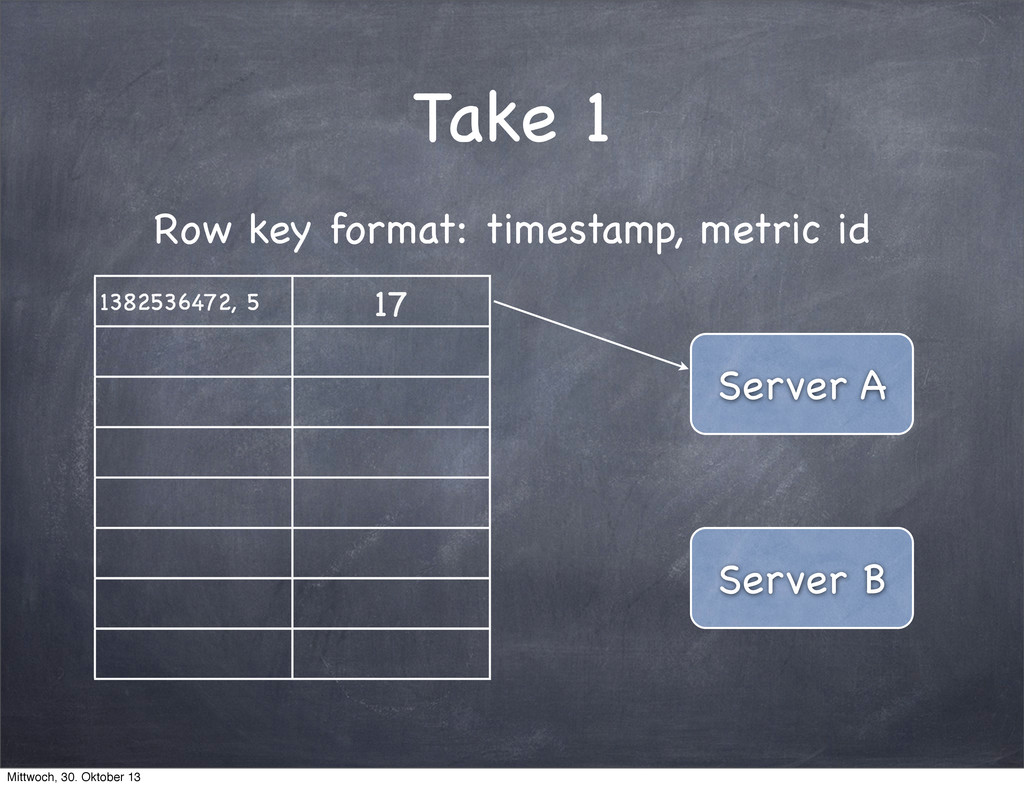
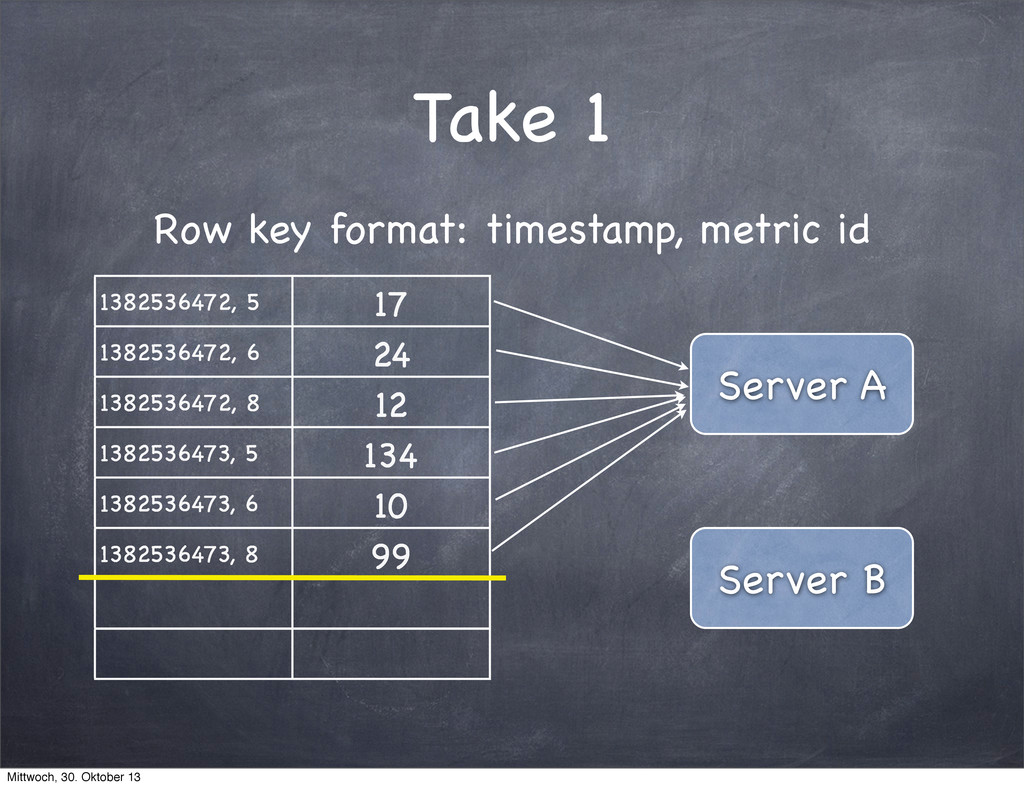
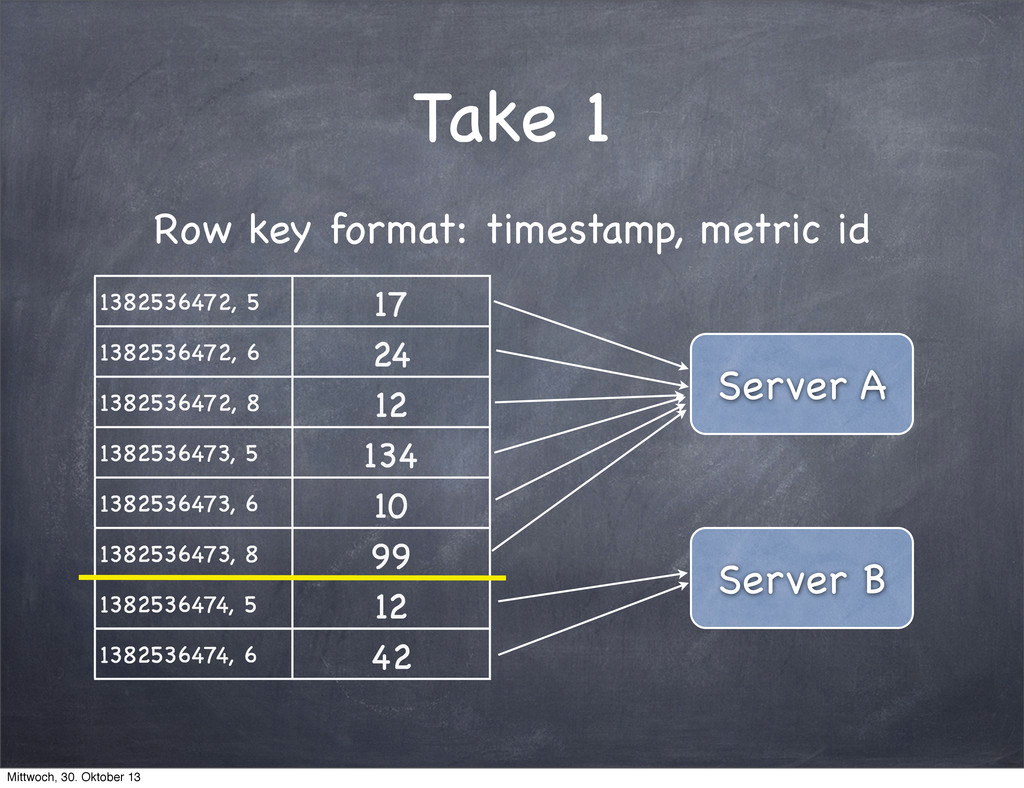
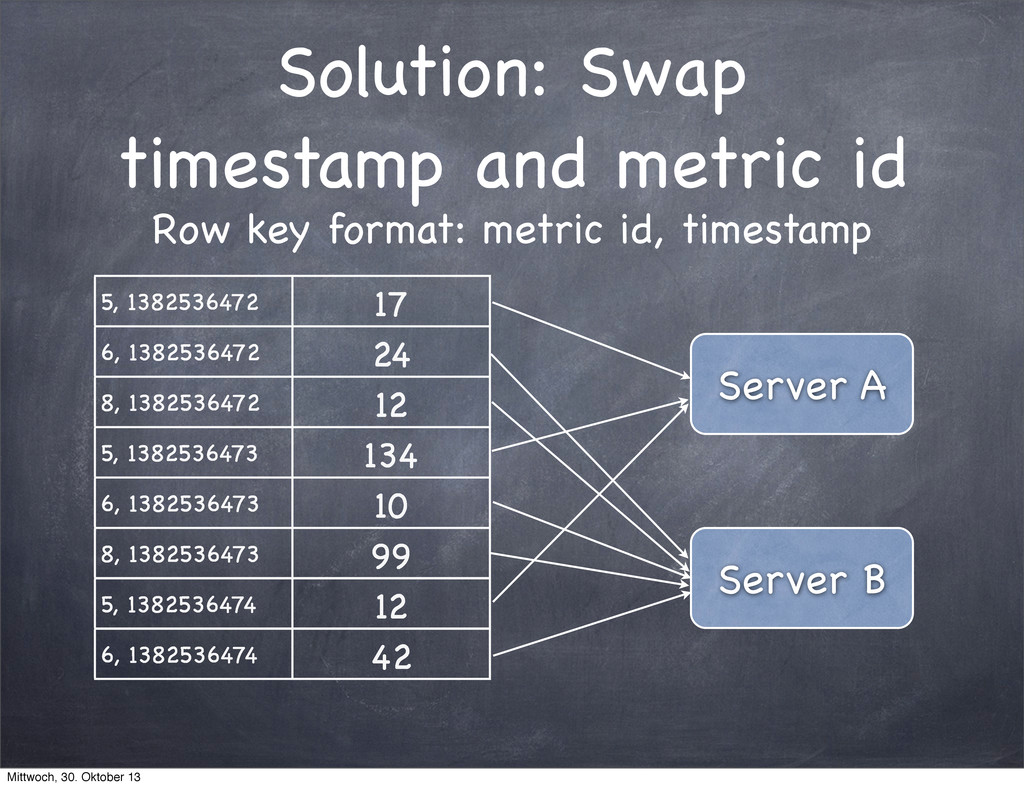
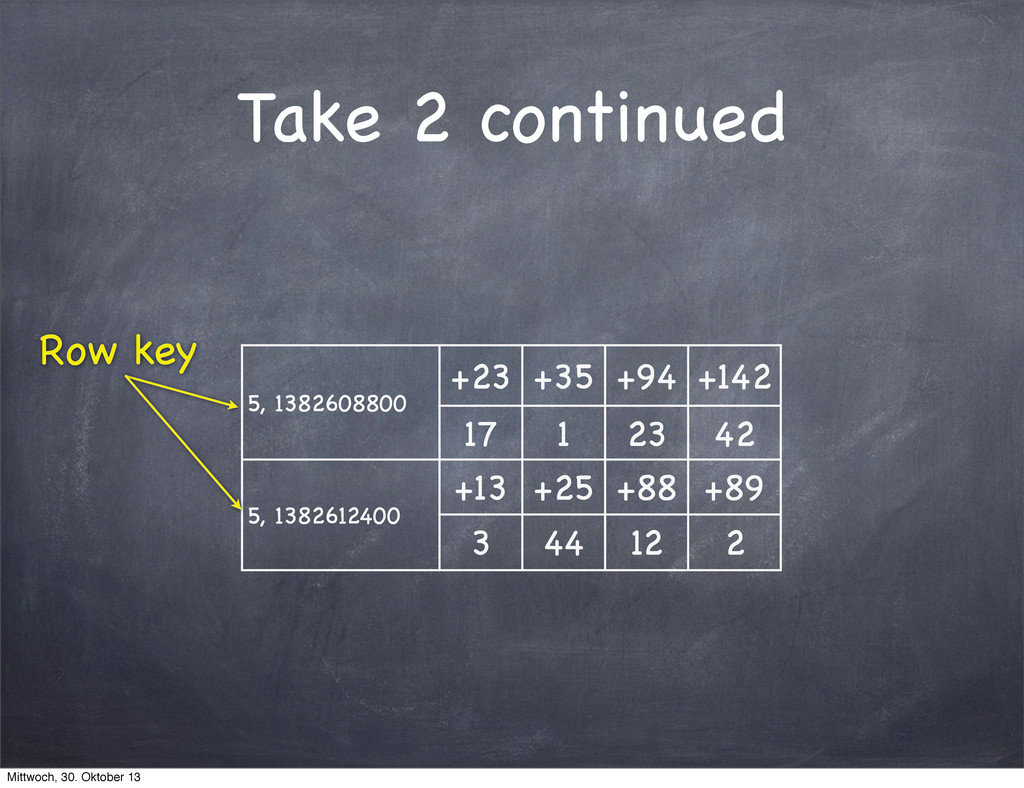
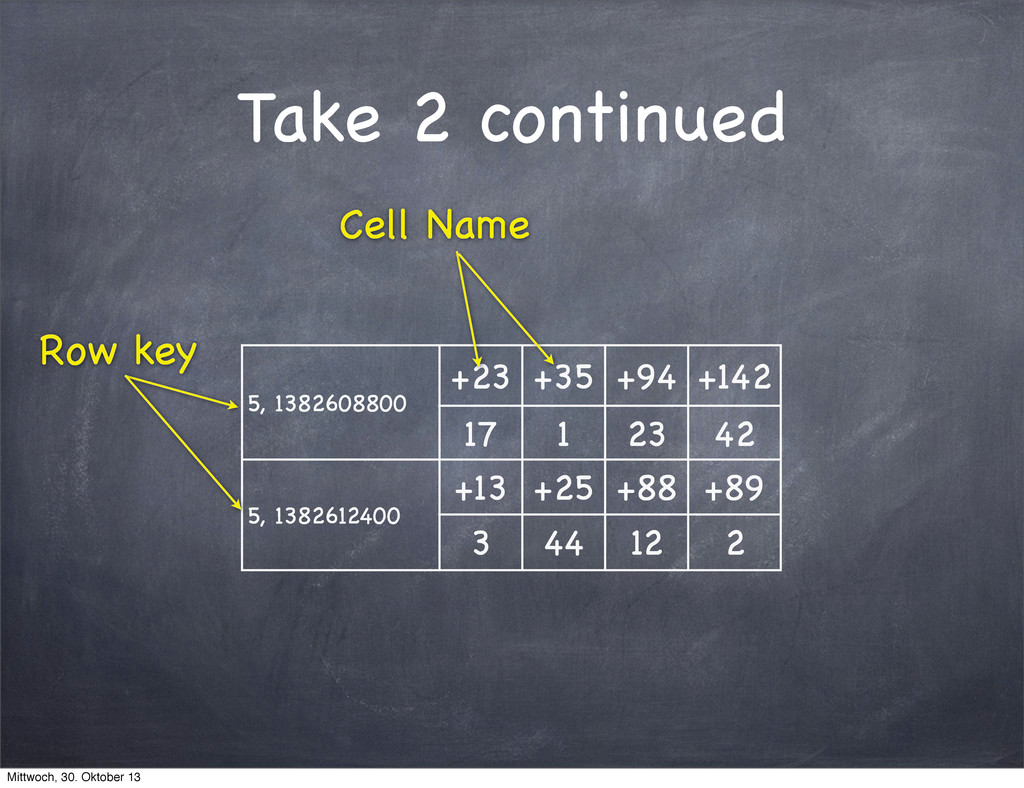
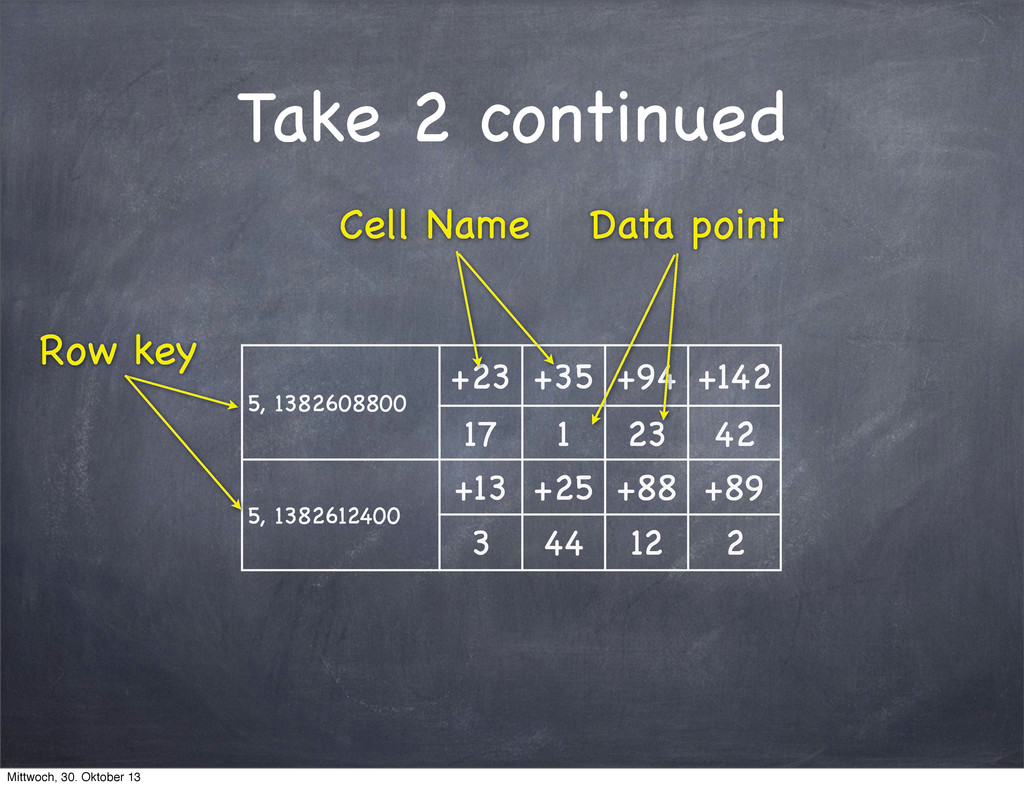
    store on top of HDFS Modeled after Google‘s BigTable Built for big tables (billions of rows, millions of columns) Automatic sharding by row key Mittwoch, 30. Oktober 13
  16. Keys are key! Data is sharded across regions based on

    their row key You query data based on the row key You can query row key ranges (say e.g. A...D) So: think about key design Mittwoch, 30. Oktober 13
  17. Take 1 Row key format: timestamp, metric id 1382536472, 5

    17 Server A Server B Mittwoch, 30. Oktober 13
  18. Take 1 Row key format: timestamp, metric id 1382536472, 5

    17 1382536472, 6 24 Server A Server B Mittwoch, 30. Oktober 13
  19. Take 1 Row key format: timestamp, metric id 1382536472, 5

    17 1382536472, 6 24 1382536472, 8 12 1382536473, 5 134 1382536473, 6 10 1382536473, 8 99 Server A Server B Mittwoch, 30. Oktober 13
  20. Take 1 Row key format: timestamp, metric id 1382536472, 5

    17 1382536472, 6 24 1382536472, 8 12 1382536473, 5 134 1382536473, 6 10 1382536473, 8 99 1382536474, 5 12 1382536474, 6 42 Server A Server B Mittwoch, 30. Oktober 13
  21. Solution: Swap timestamp and metric id Row key format: metric

    id, timestamp 5, 1382536472 17 6, 1382536472 24 8, 1382536472 12 5, 1382536473 134 6, 1382536473 10 8, 1382536473 99 5, 1382536474 12 6, 1382536474 42 Server A Server B Mittwoch, 30. Oktober 13
  22. Solution: Swap timestamp and metric id Row key format: metric

    id, timestamp 5, 1382536472 17 6, 1382536472 24 8, 1382536472 12 5, 1382536473 134 6, 1382536473 10 8, 1382536473 99 5, 1382536474 12 6, 1382536474 42 Server A Server B Mittwoch, 30. Oktober 13
  23. Take 2 Metric ID first, then timestamp Searching through many

    rows is slower than searching through viewer rows. (Obviously) So: Put multiple data points into one row Mittwoch, 30. Oktober 13
  24. Take 2 continued 5, 1382608800 +23 +35 +94 +142 5,

    1382608800 17 1 23 42 5, 1382612400 +13 +25 +88 +89 5, 1382612400 3 44 12 2 Mittwoch, 30. Oktober 13
  25. Take 2 continued 5, 1382608800 +23 +35 +94 +142 5,

    1382608800 17 1 23 42 5, 1382612400 +13 +25 +88 +89 5, 1382612400 3 44 12 2 Row key Mittwoch, 30. Oktober 13
  26. Take 2 continued 5, 1382608800 +23 +35 +94 +142 5,

    1382608800 17 1 23 42 5, 1382612400 +13 +25 +88 +89 5, 1382612400 3 44 12 2 Row key Cell Name Mittwoch, 30. Oktober 13
  27. Take 2 continued 5, 1382608800 +23 +35 +94 +142 5,

    1382608800 17 1 23 42 5, 1382612400 +13 +25 +88 +89 5, 1382612400 3 44 12 2 Row key Cell Name Data point Mittwoch, 30. Oktober 13
  28. Where are the tags stored? They are put at the

    end of the row key Both tag names and tag values are represented by IDs Mittwoch, 30. Oktober 13
  29. The Row Key 3 Bytes - metric ID 4 Bytes

    - timestamp (rounded down to the hour) 3 Bytes tag ID 3 Bytes tag value ID Total: 7 Bytes + 6 Bytes * Number of tags Mittwoch, 30. Oktober 13
  30. Myth: Keeping Data is expensive Gartner found the price for

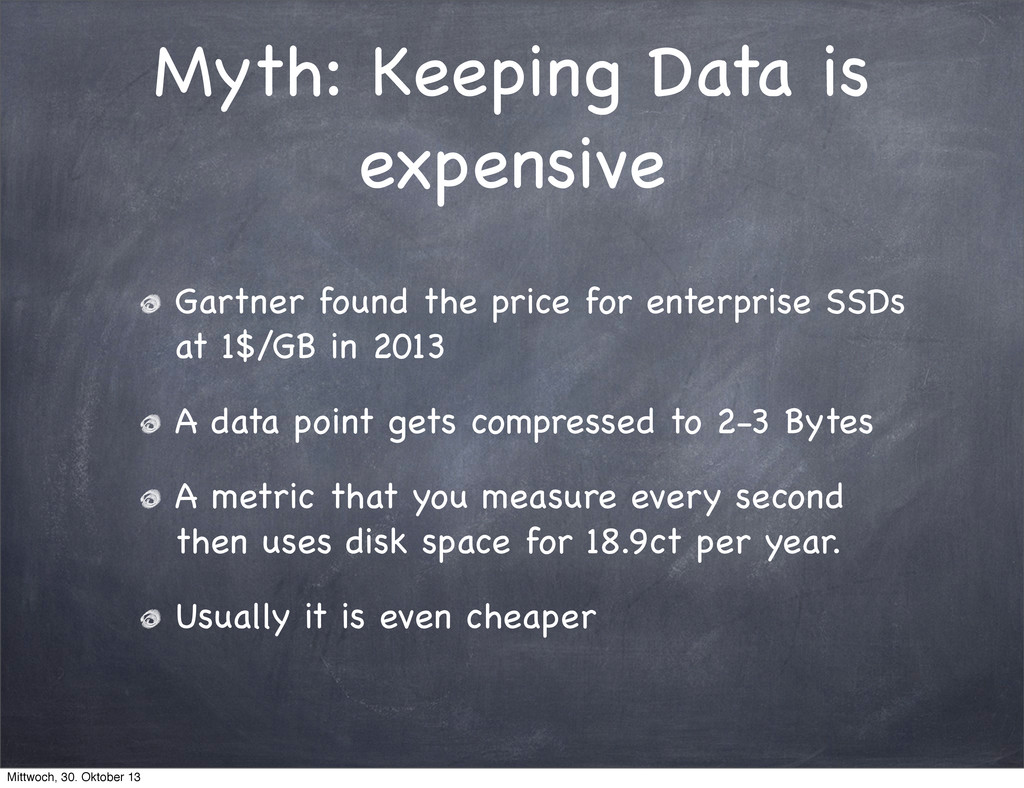
    enterprise SSDs at 1$/GB in 2013 A data point gets compressed to 2-3 Bytes A metric that you measure every second then uses disk space for 18.9ct per year. Usually it is even cheaper Mittwoch, 30. Oktober 13
  31. If your work costs 50$ per hour and it takes

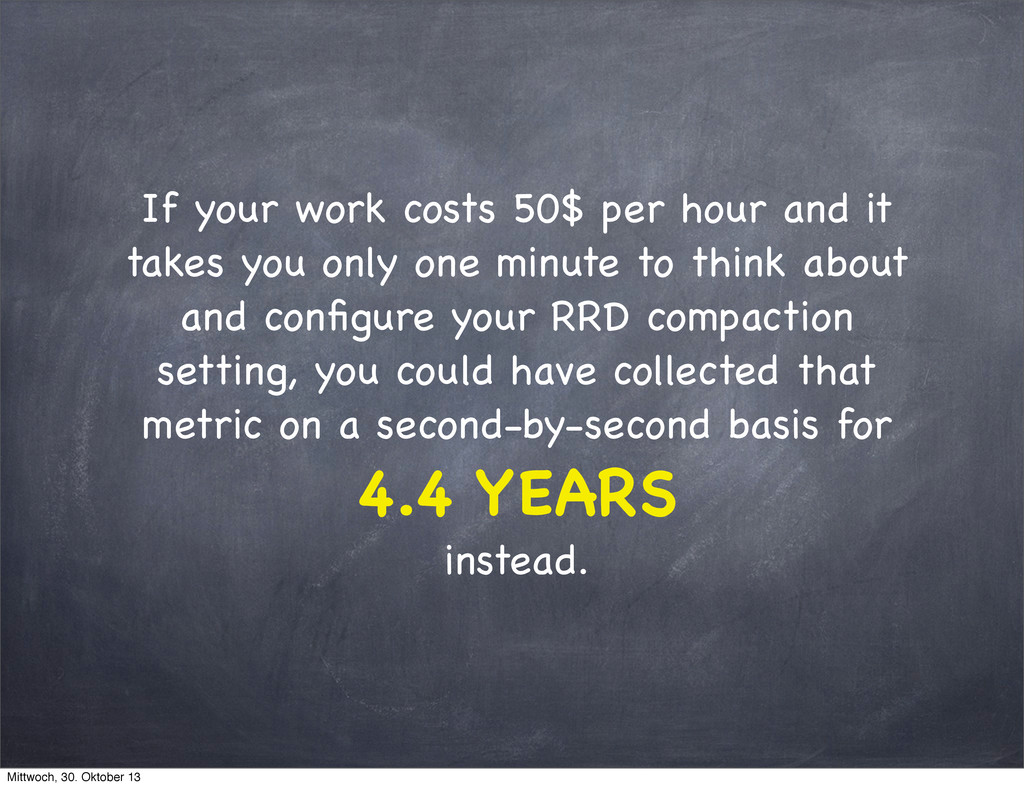
    you only one minute to think about and configure your RRD compaction setting, you could have collected that metric on a second-by-second basis for 4.4 YEARS instead. Mittwoch, 30. Oktober 13
  32. Myth: the amount of metrics is too limited Don‘t confuse

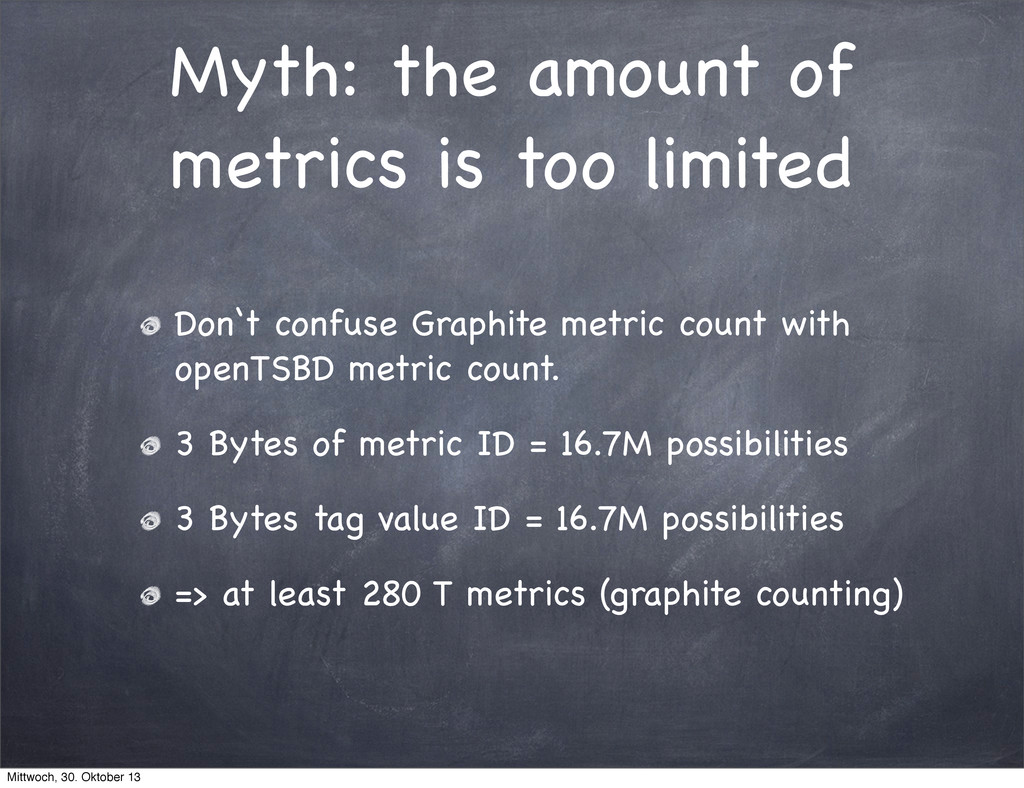
    Graphite metric count with openTSBD metric count. 3 Bytes of metric ID = 16.7M possibilities 3 Bytes tag value ID = 16.7M possibilities => at least 280 T metrics (graphite counting) Mittwoch, 30. Oktober 13
  33. Tools shape culture shapes tools It is time for a

    new monitoring culture! Embrace machine learning! Monitor everything in your organisation! Throw of the shackles of fixed intervals! Come, join the revolution! Mittwoch, 30. Oktober 13
  34. What works well We store about 200M data points in

    several thousand time series with no issues tcollector is decoupling measurement from storage Creating new metrics is really easy You are free to choose your rhythm Mittwoch, 30. Oktober 13
  35. Challenges The UI is seriously lacking no annotation support out

    of the box no meta data for time series Only 1s time resolution (and only 1 value/s/ time series) Mittwoch, 30. Oktober 13
  36. salvation is coming OpenTSDB 2 is around the corner millisecond

    precision annotations and meta data improved API improved UI Mittwoch, 30. Oktober 13
  37. Friendly advice Pick a naming scheme and stick to it

    Use tags wisely (not more than 6 or 7 tags per data point) Use tcollector wait for openTSDB 2 ;-) Mittwoch, 30. Oktober 13