Upgrade to Pro — share decks privately, control downloads, hide ads and more …

Injecting Failure, Explaining Failure

Sponsored · SiteGround - Reliable hosting with speed, security, and support you can count on. →

Injecting Failure, Explaining Failure

Presentation at Imperial College London with the Large Scale Data & Systems Group (LSDS). It covers chaos engineering, AI-assisted root-cause analysis, and how AI agents are transforming software and production engineering today.

Avatar for Nikos Katirtzis

Nikos Katirtzis

October 12, 2026

More Decks by Nikos Katirtzis

Other Decks in Technology

Transcript

  1. Injecting Failure, Explaining Failure Chaos engineering and AI-assisted root-cause analysis

    in practice LSDS Seminar · Imperial College London · 2026
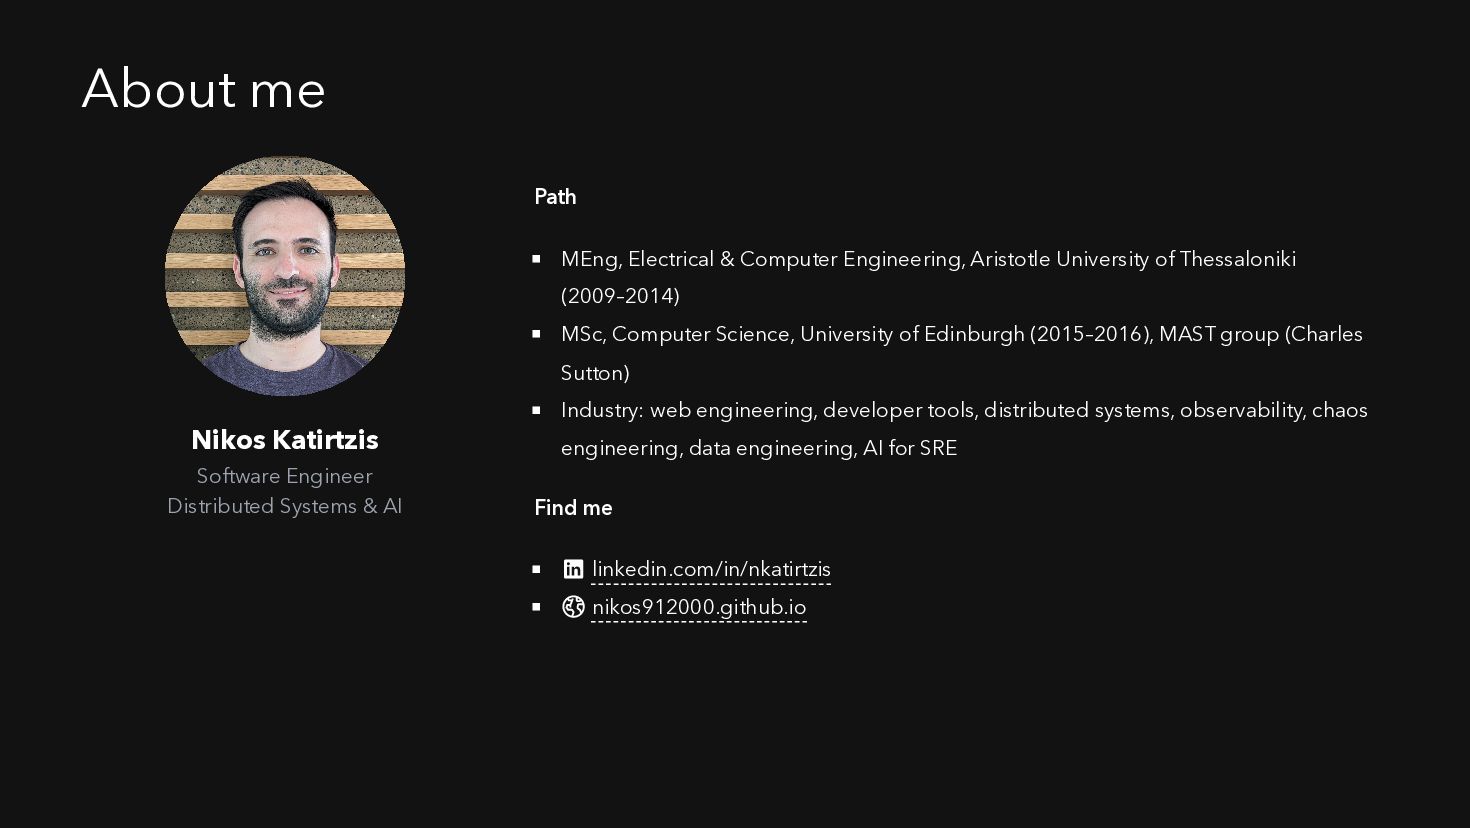
  2. About me Path MEng, Electrical & Computer Engineering, Aristotle University

    of Thessaloniki (2009–2014) MSc, Computer Science, University of Edinburgh (2015–2016), MAST group (Charles Sutton) Nikos Katirtzis Software Engineer Distributed Systems & AI Industry: web engineering, developer tools, distributed systems, observability, chaos engineering, data engineering, AI for SRE Find me linkedin.com/in/nkatirtzis nikos912000.github.io
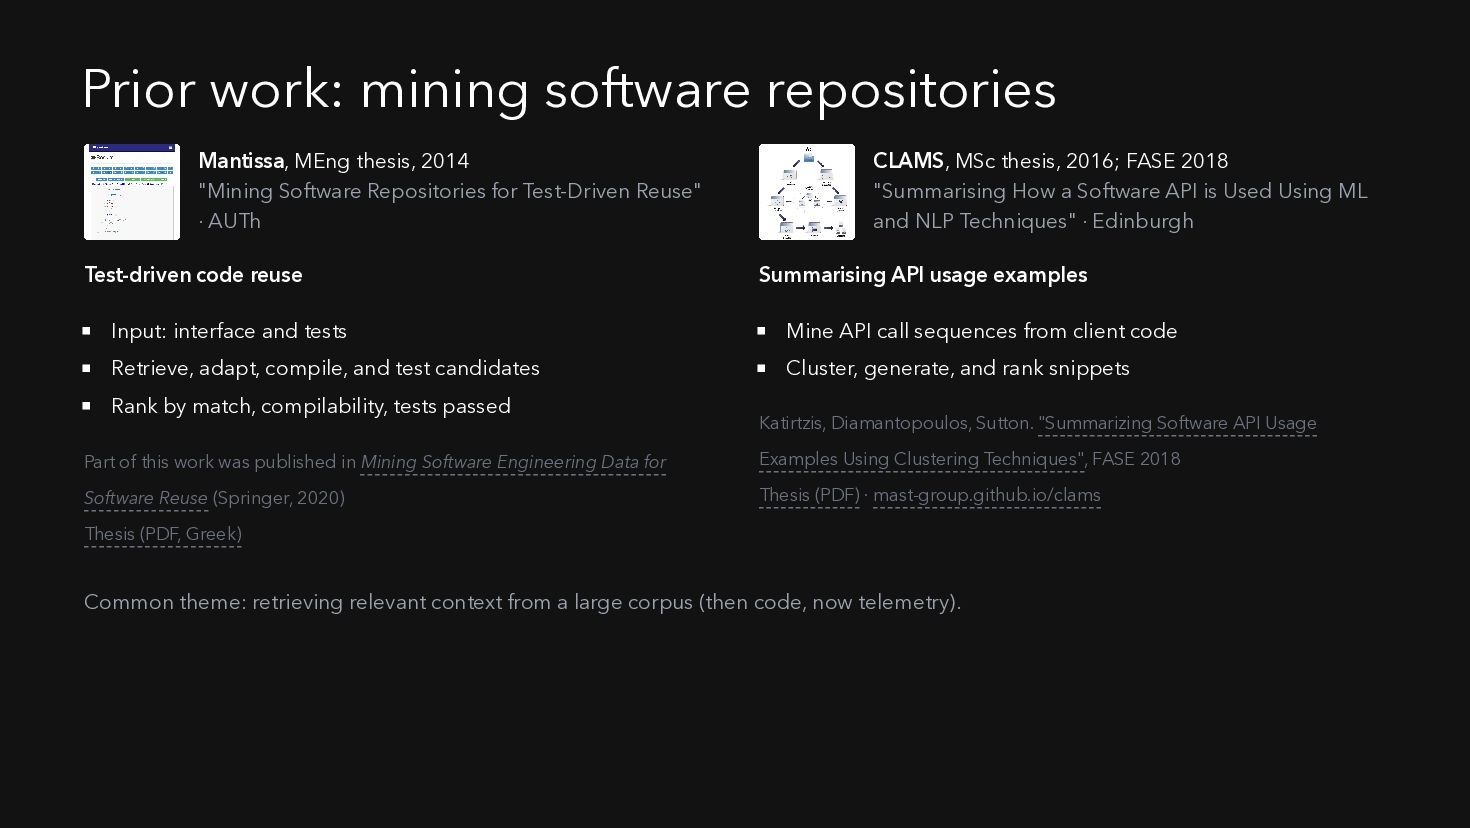
  3. Prior work: mining software repositories Mantissa, MEng thesis, 2014 "Mining

    Software Repositories for Test-Driven Reuse" · AUTh Test-driven code reuse CLAMS, MSc thesis, 2016; FASE 2018 "Summarising How a Software API is Used Using ML and NLP Techniques" · Edinburgh Summarising API usage examples Input: interface and tests Mine API call sequences from client code Retrieve, adapt, compile, and test candidates Cluster, generate, and rank snippets Rank by match, compilability, tests passed Katirtzis, Diamantopoulos, Sutton. "Summarizing Software API Usage Part of this work was published in Mining Software Engineering Data for Examples Using Clustering Techniques", FASE 2018 Software Reuse (Springer, 2020) Thesis (PDF) · mast-group.github.io/clams Thesis (PDF, Greek) Common theme: retrieving relevant context from a large corpus (then code, now telemetry).
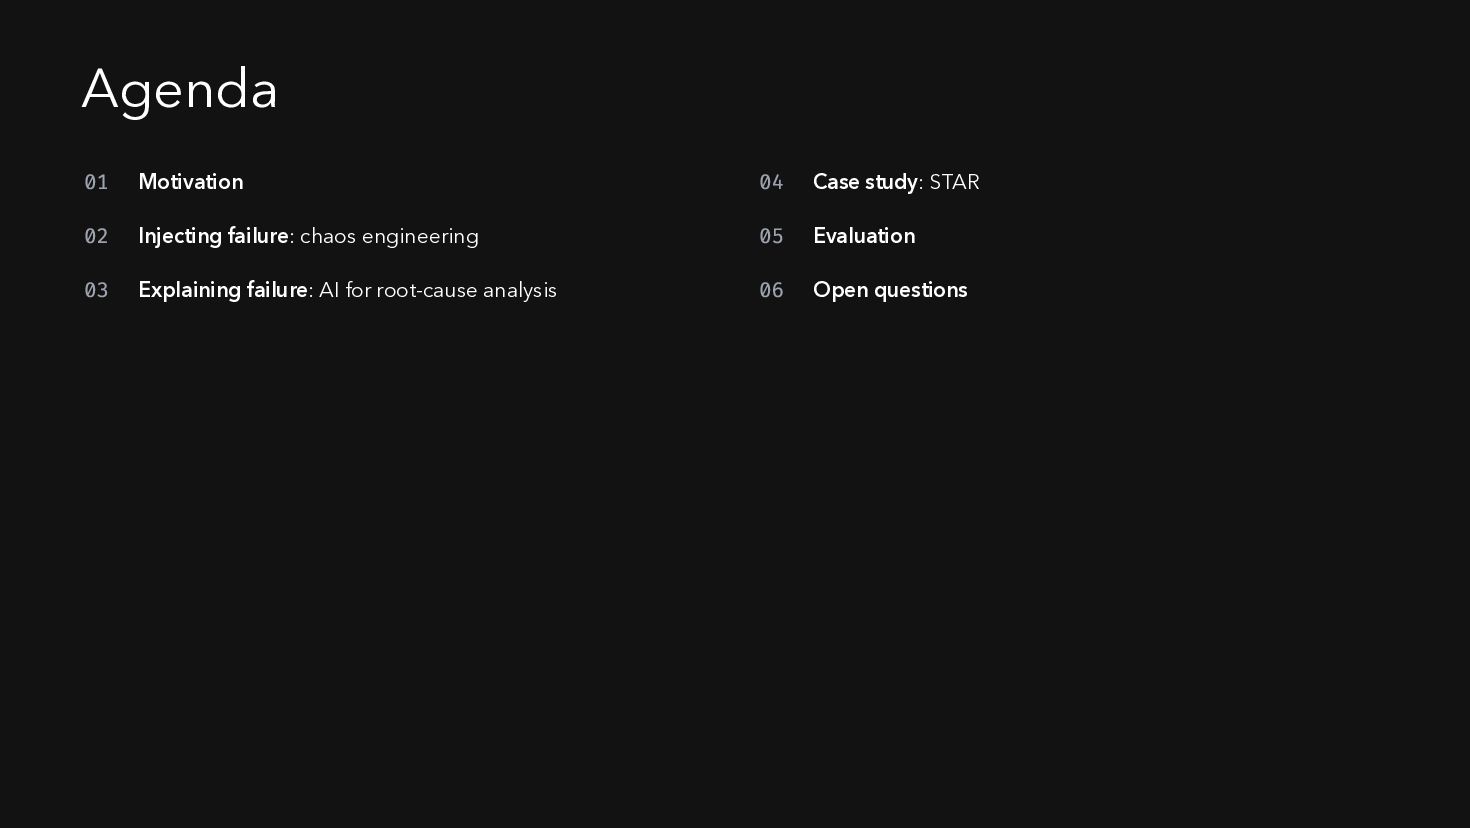
  4. Agenda 01 Motivation 04 Case study: STAR 02 Injecting failure:

    chaos engineering 05 Evaluation 03 Explaining failure: AI for root-cause analysis 06 Open questions
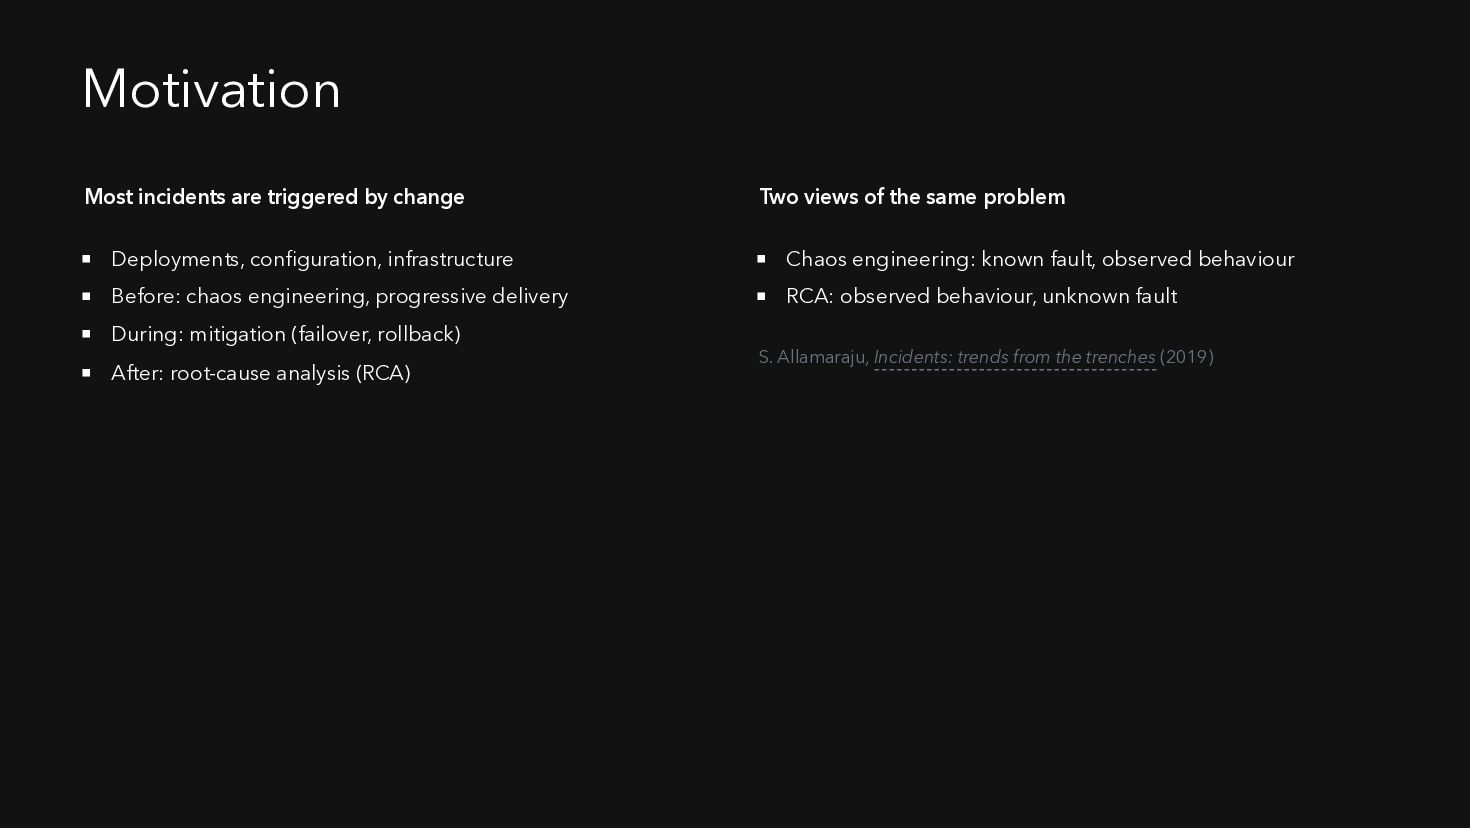
  5. Motivation Most incidents are triggered by change Two views of

    the same problem Deployments, configuration, infrastructure Chaos engineering: known fault, observed behaviour Before: chaos engineering, progressive delivery RCA: observed behaviour, unknown fault During: mitigation (failover, rollback) After: root-cause analysis (RCA) S. Allamaraju, Incidents: trends from the trenches (2019)
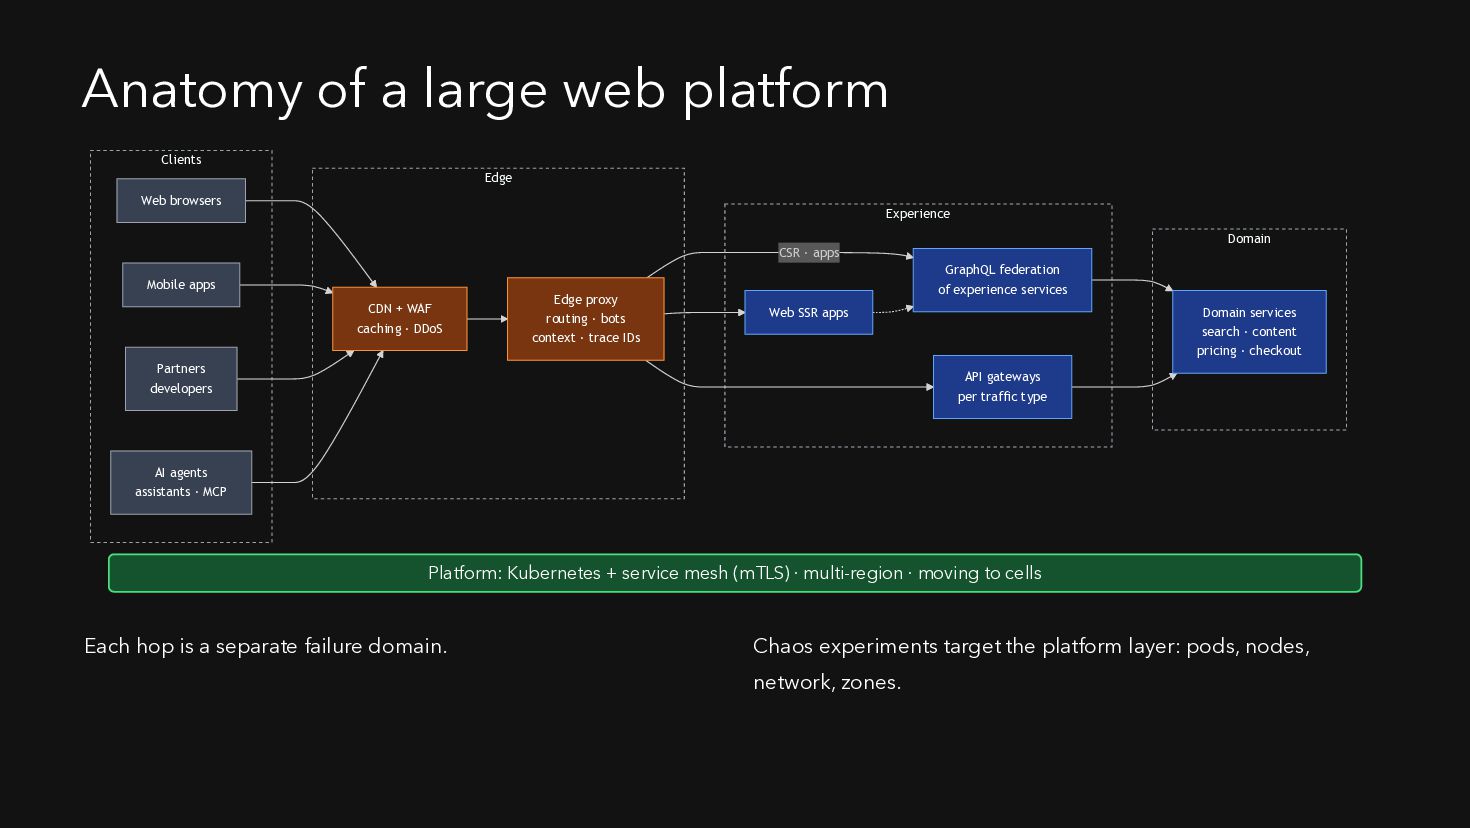
  6. Anatomy of a large web platform Clients Edge Web browsers

    Experience Domain CSR · apps Mobile apps CDN + WAF caching · DDoS Edge proxy routing · bots context · trace IDs GraphQL federation of experience services Web SSR apps Partners developers Domain services search · content pricing · checkout API gateways per traffic type AI agents assistants · MCP Platform: Kubernetes + service mesh (mTLS) · multi-region · moving to cells Each hop is a separate failure domain. Chaos experiments target the platform layer: pods, nodes, network, zones.
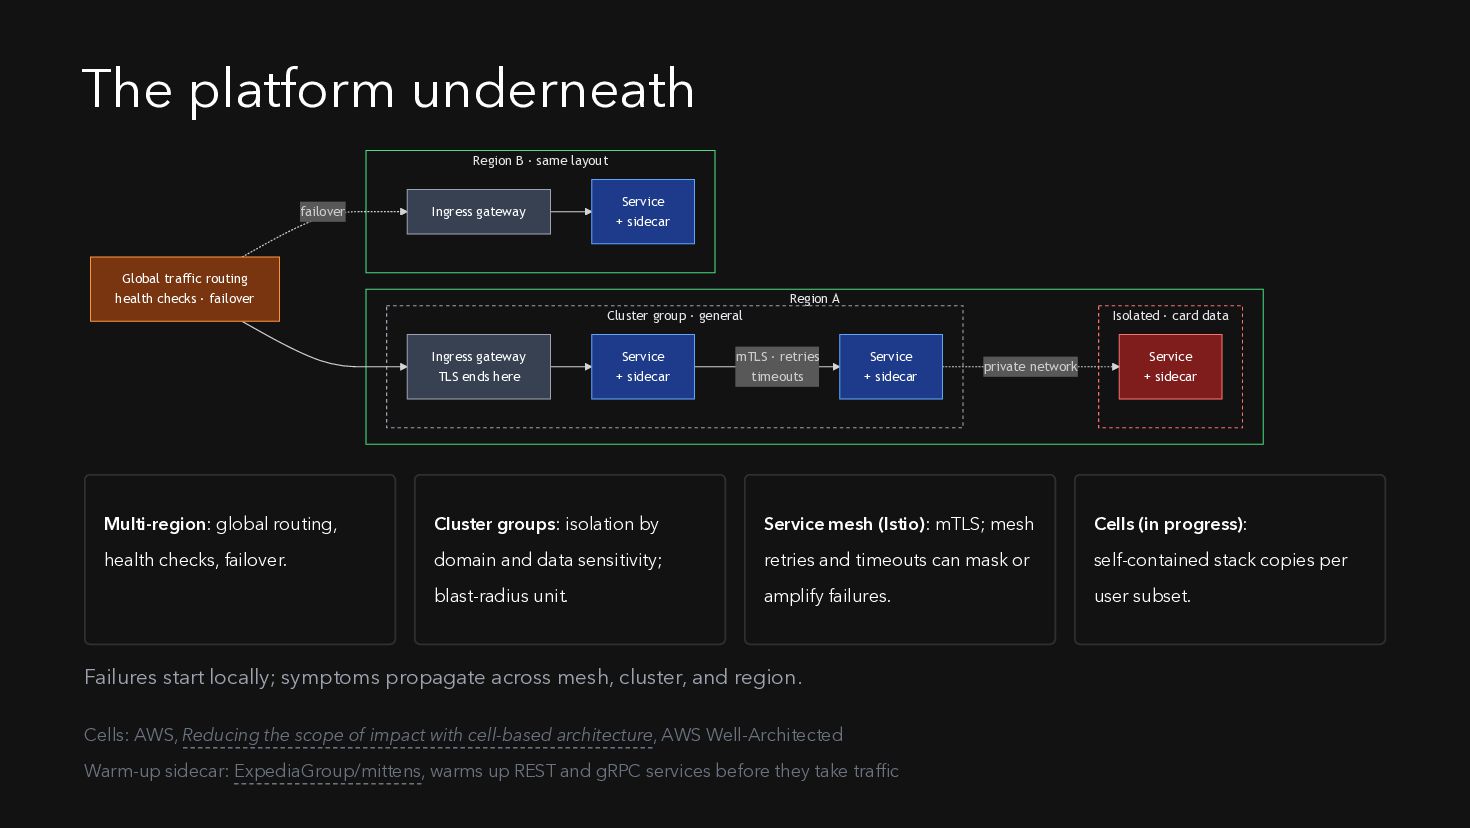
  7. The platform underneath Region B · same layout failover Ingress

    gateway Service + sidecar Global traffic routing health checks · failover Region A Cluster group · general Ingress gateway TLS ends here Service + sidecar Isolated · card data mTLS · retries timeouts Service + sidecar private network Service + sidecar Multi-region: global routing, Cluster groups: isolation by Service mesh (Istio): mTLS; mesh Cells (in progress): health checks, failover. domain and data sensitivity; retries and timeouts can mask or self-contained stack copies per blast-radius unit. amplify failures. user subset. Failures start locally; symptoms propagate across mesh, cluster, and region. Cells: AWS, Reducing the scope of impact with cell-based architecture, AWS Well-Architected Warm-up sidecar: ExpediaGroup/mittens, warms up REST and gRPC services before they take traffic
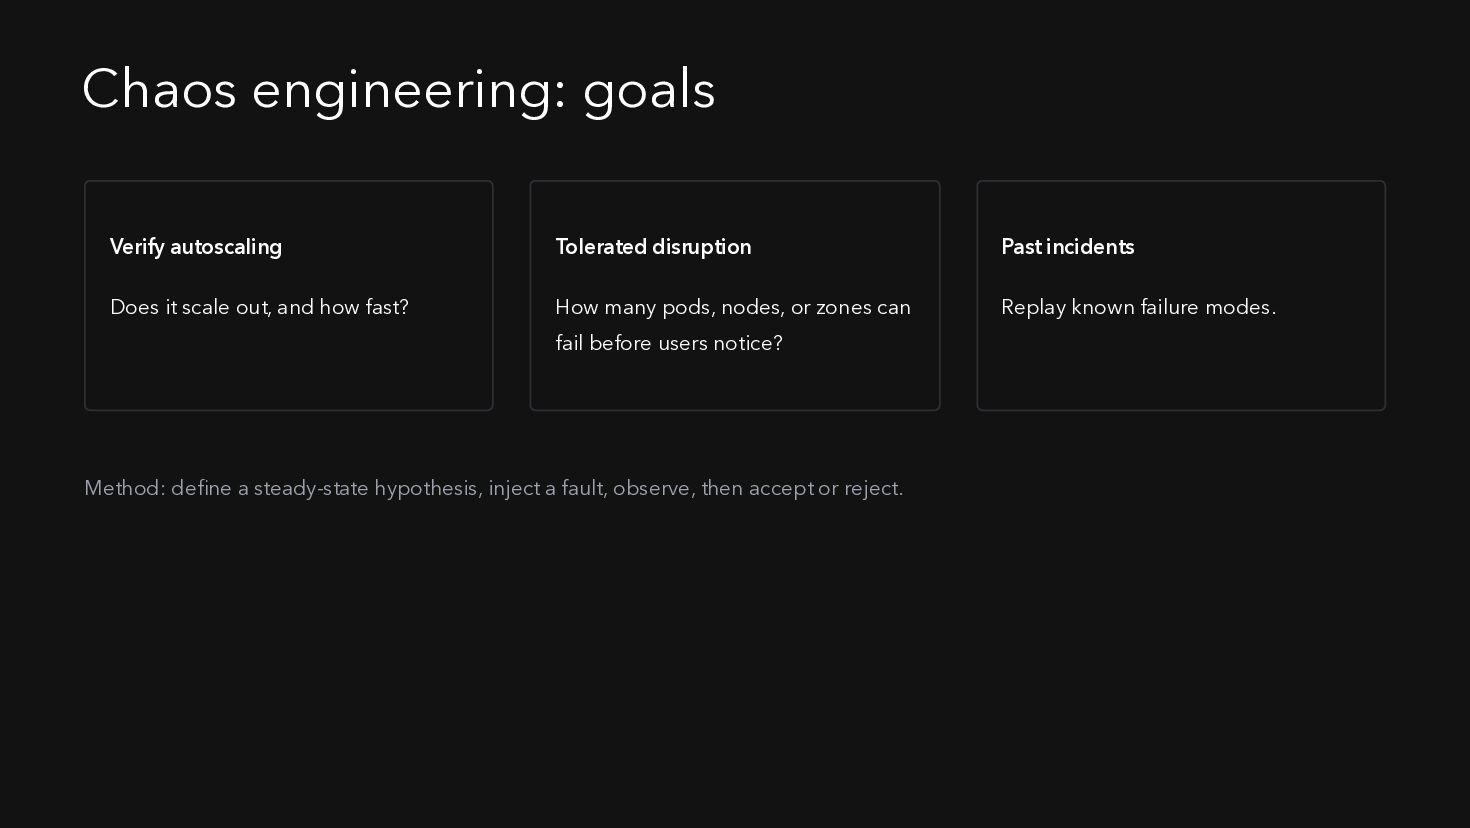
  8. Chaos engineering: goals Verify autoscaling Tolerated disruption Past incidents Does

    it scale out, and how fast? How many pods, nodes, or zones can Replay known failure modes. fail before users notice? Method: define a steady-state hypothesis, inject a fault, observe, then accept or reject.
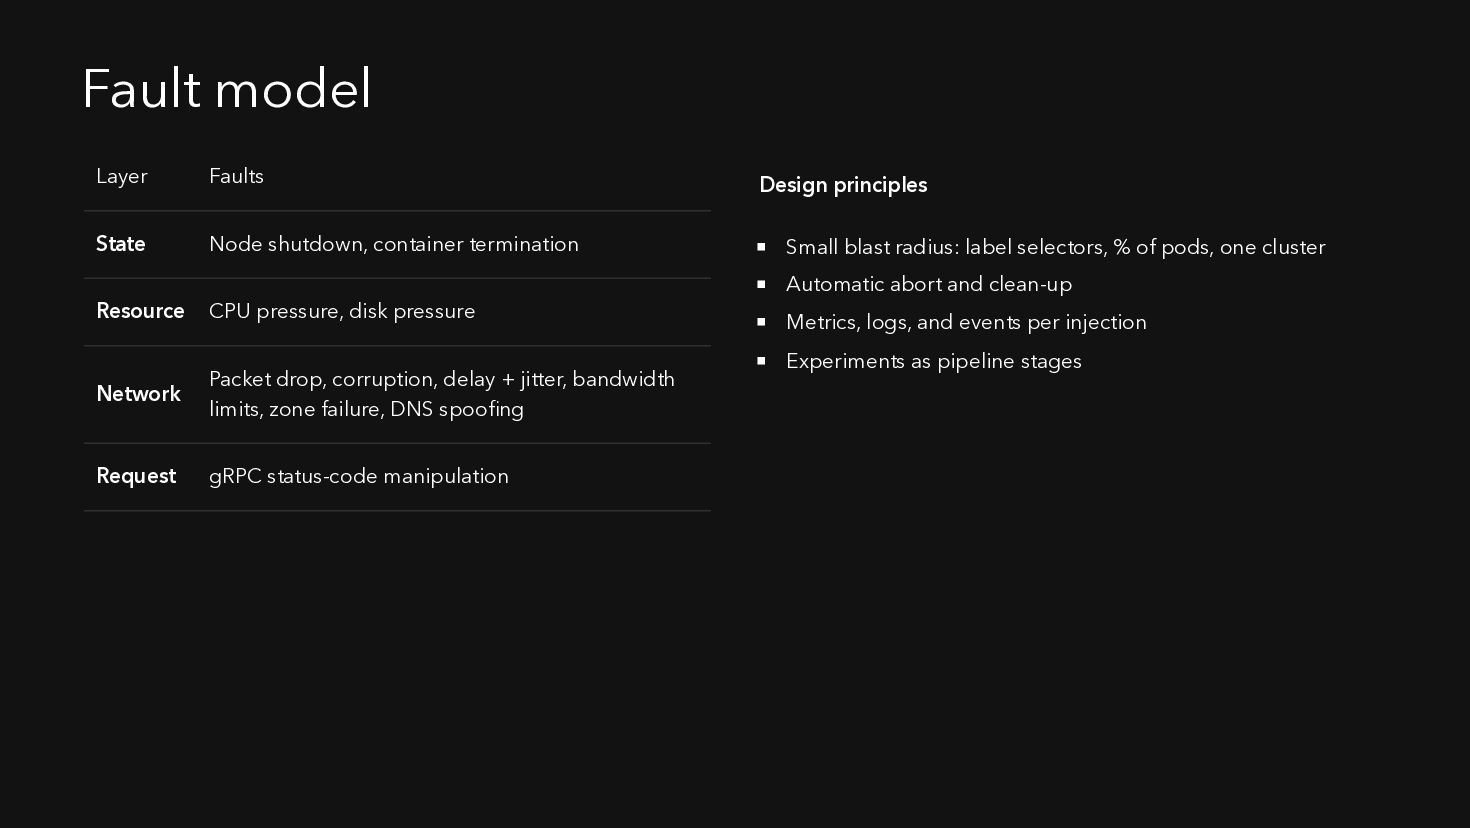
  9. Fault model Layer Faults State Node shutdown, container termination Resource

    CPU pressure, disk pressure Network Packet drop, corruption, delay + jitter, bandwidth limits, zone failure, DNS spoofing Request gRPC status-code manipulation Design principles Small blast radius: label selectors, % of pods, one cluster Automatic abort and clean-up Metrics, logs, and events per injection Experiments as pipeline stages
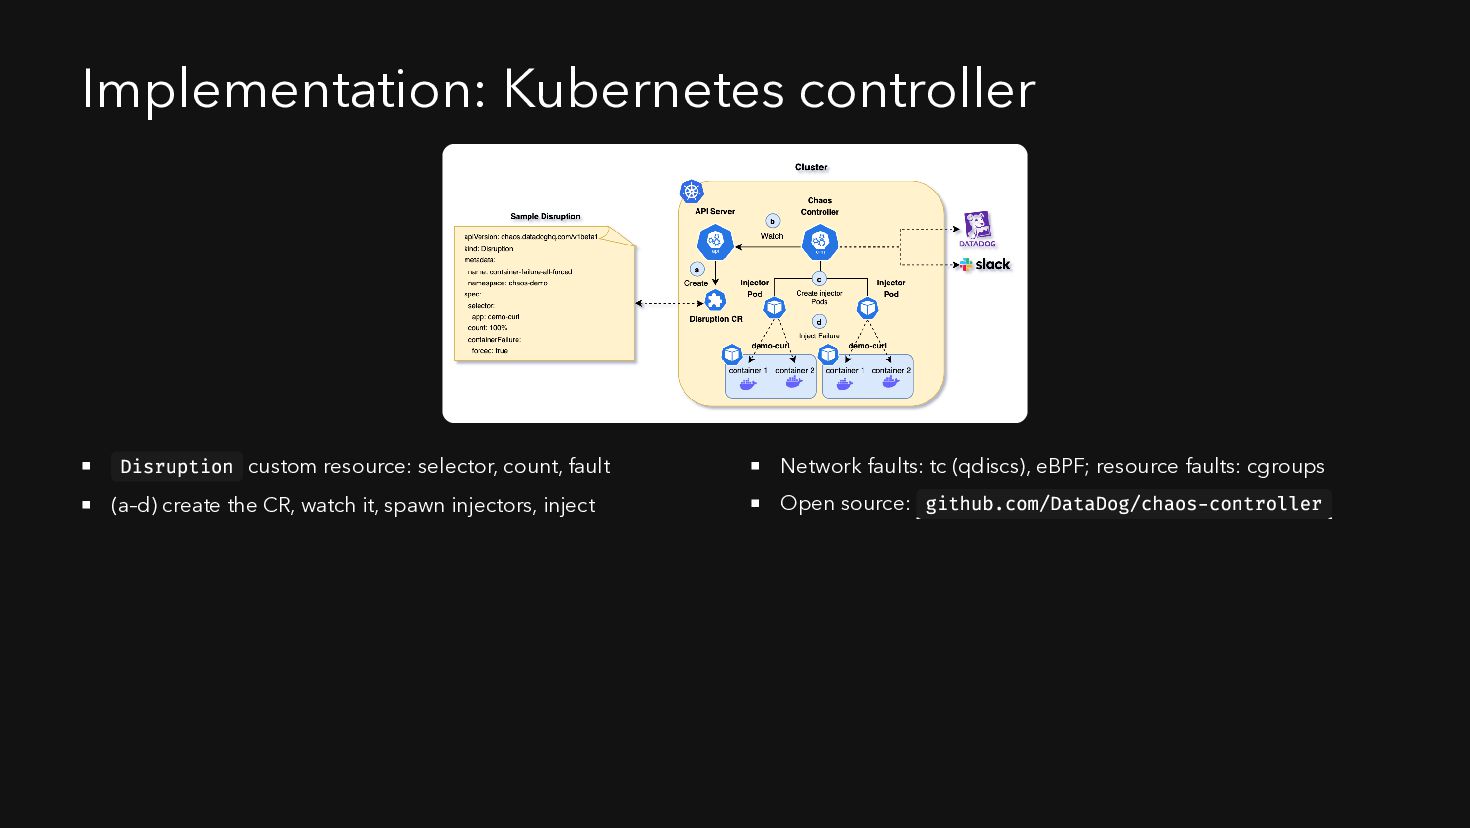
  10. Implementation: Kubernetes controller Disruption custom resource: selector, count, fault Network

    faults: tc (qdiscs), eBPF; resource faults: cgroups (a–d) create the CR, watch it, spawn injectors, inject Open source: github.com/DataDog/chaos-controller
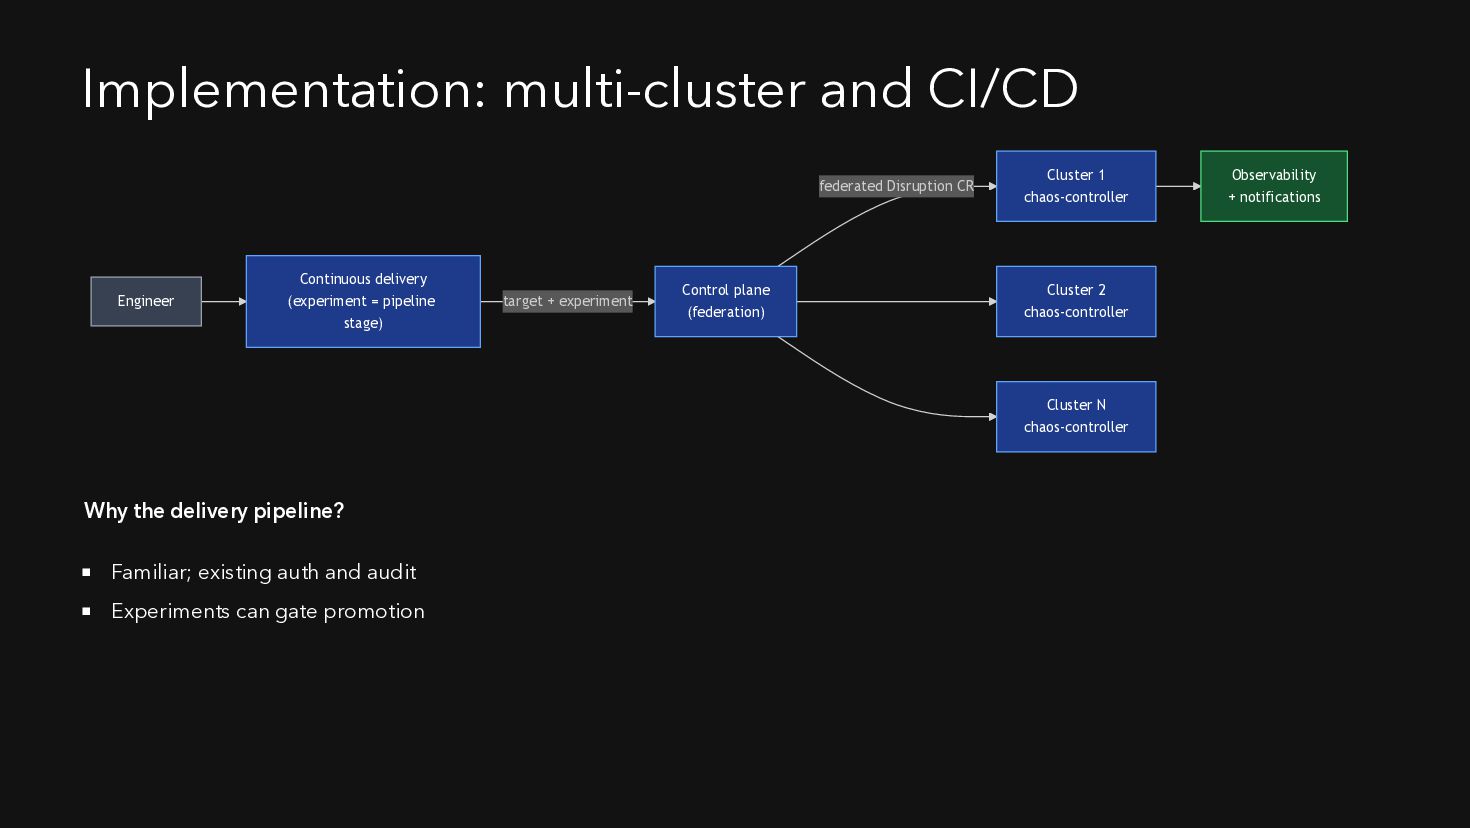
  11. Implementation: multi-cluster and CI/CD federated Disruption CR Engineer Continuous delivery

    (experiment = pipeline stage) target + experiment Control plane (federation) Cluster 1 chaos-controller Cluster 2 chaos-controller Cluster N chaos-controller Why the delivery pipeline? Familiar; existing auth and audit Experiments can gate promotion Observability + notifications
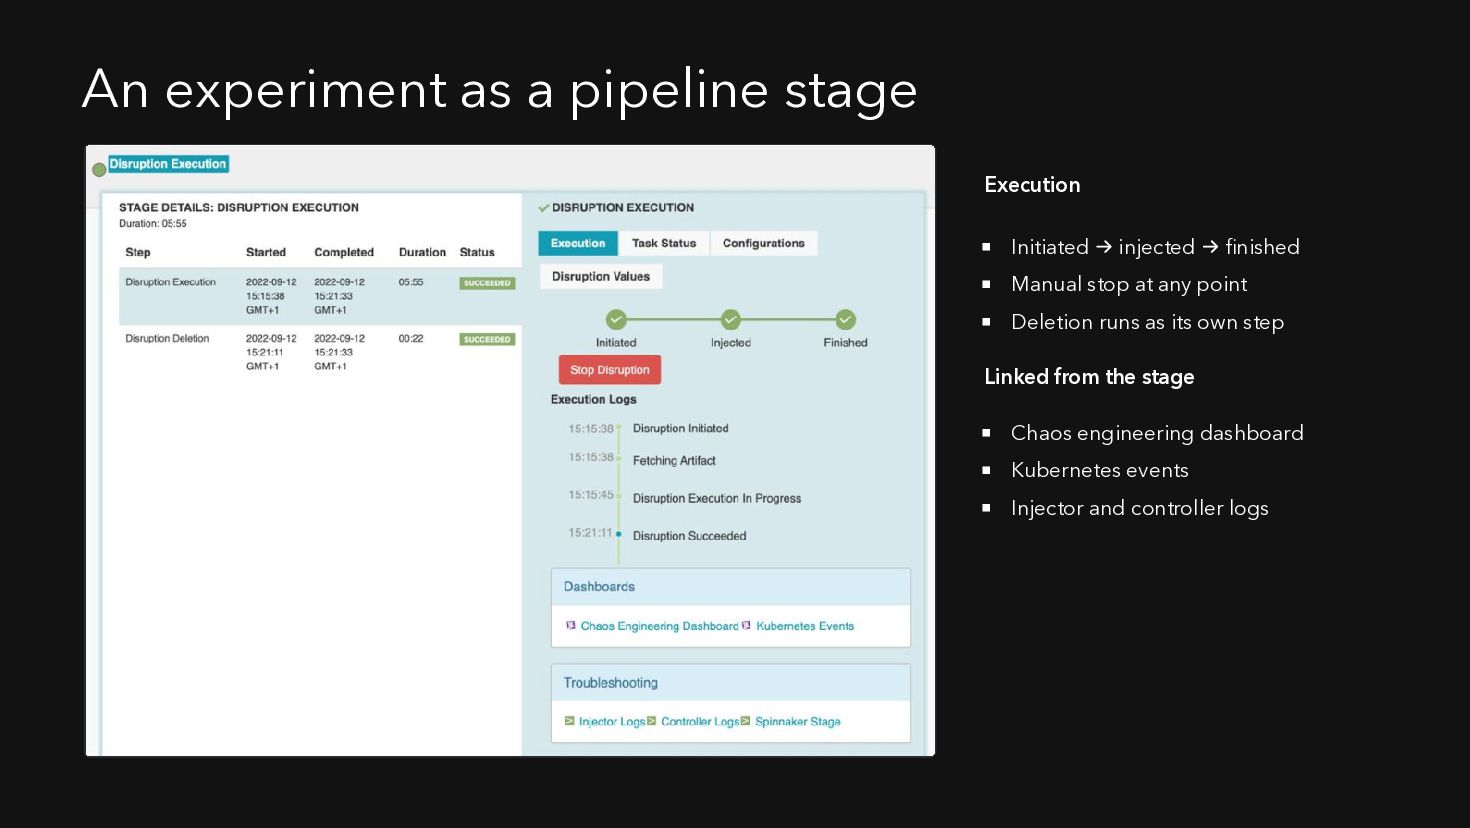
  12. An experiment as a pipeline stage Execution Initiated → injected

    → finished Manual stop at any point Deletion runs as its own step Linked from the stage Chaos engineering dashboard Kubernetes events Injector and controller logs
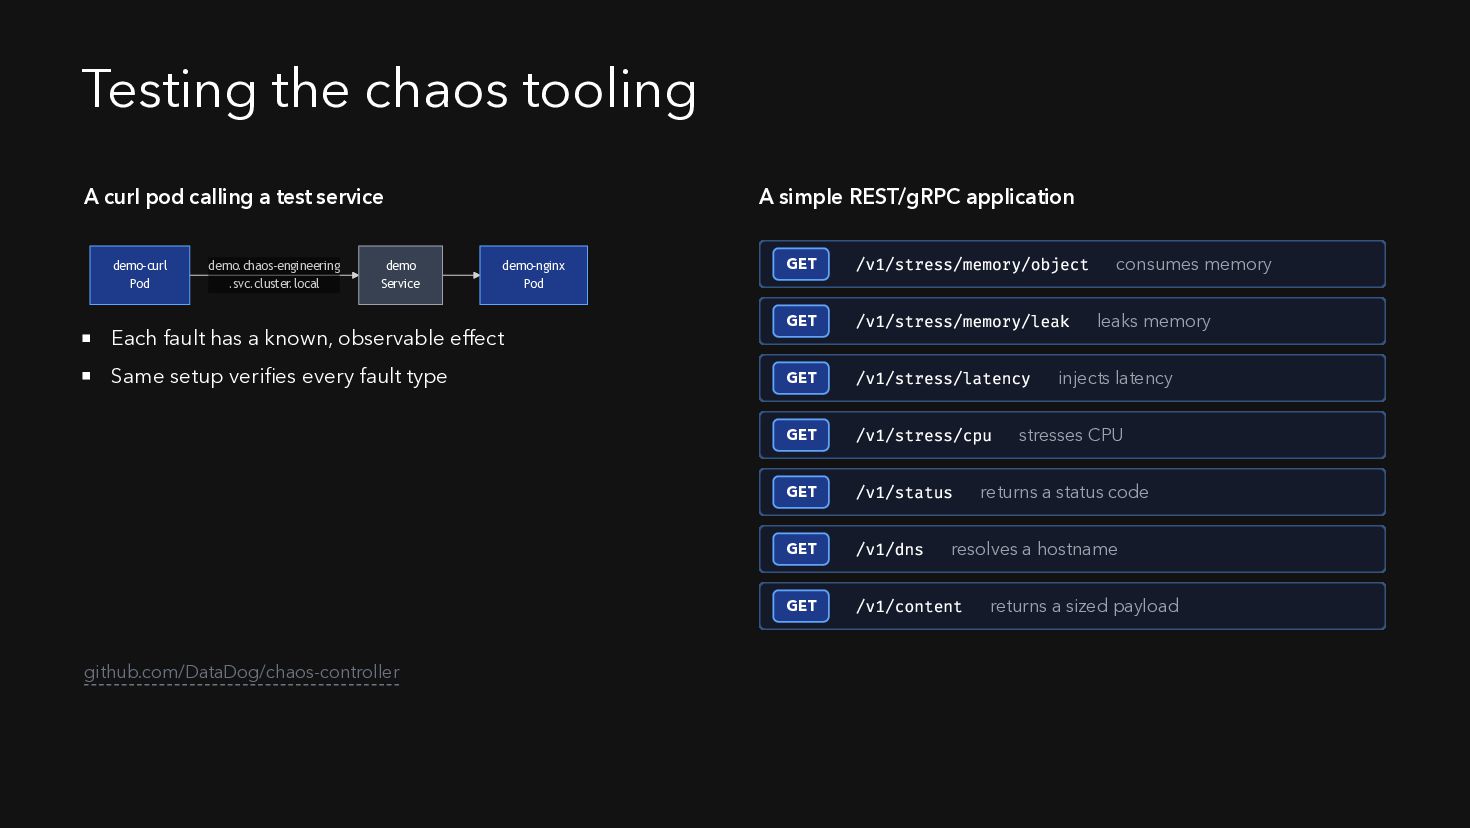
  13. Testing the chaos tooling A curl pod calling a test

    service demo-curl Pod demo.chaos-engineering .svc.cluster.local demo Service A simple REST/gRPC application demo-nginx Pod Each fault has a known, observable effect Same setup verifies every fault type github.com/DataDog/chaos-controller GET /v1/stress/memory/object GET /v1/stress/memory/leak GET /v1/stress/latency GET /v1/stress/cpu GET /v1/status GET /v1/dns GET /v1/content consumes memory leaks memory injects latency stresses CPU returns a status code resolves a hostname returns a sized payload
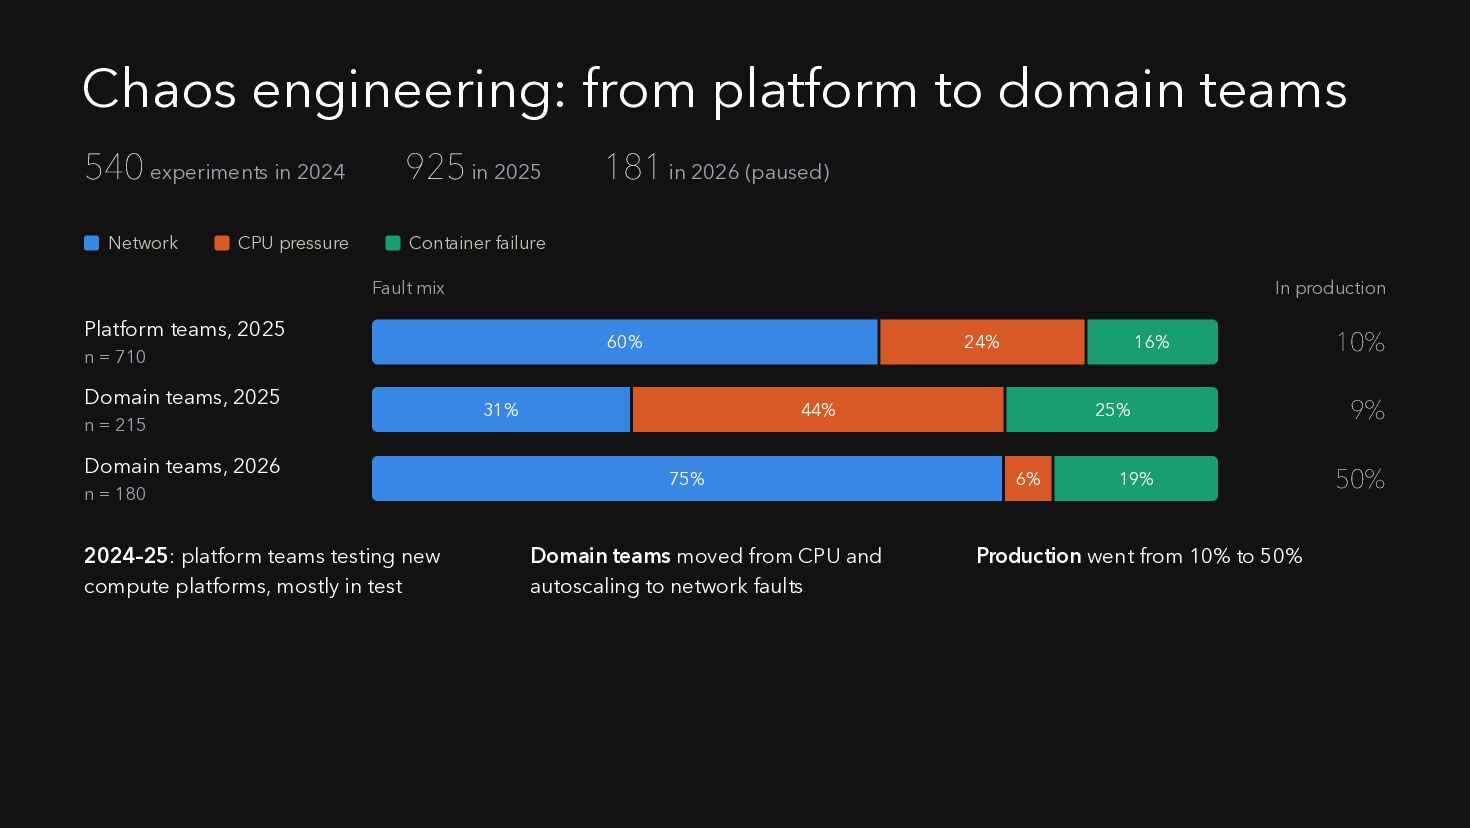
  14. Chaos engineering: from platform to domain teams 540 experiments in

    2024 Network CPU pressure 925 in 2025 181 in 2026 (paused) Container failure Fault mix In production Platform teams, 2025 60% n = 710 Domain teams, 2025 n = 215 Domain teams, 2026 n = 180 2024–25: platform teams testing new compute platforms, mostly in test 24% 31% 16% 44% 75% Domain teams moved from CPU and autoscaling to network faults 25% 6% 19% Production went from 10% to 50% 10% 9% 50%
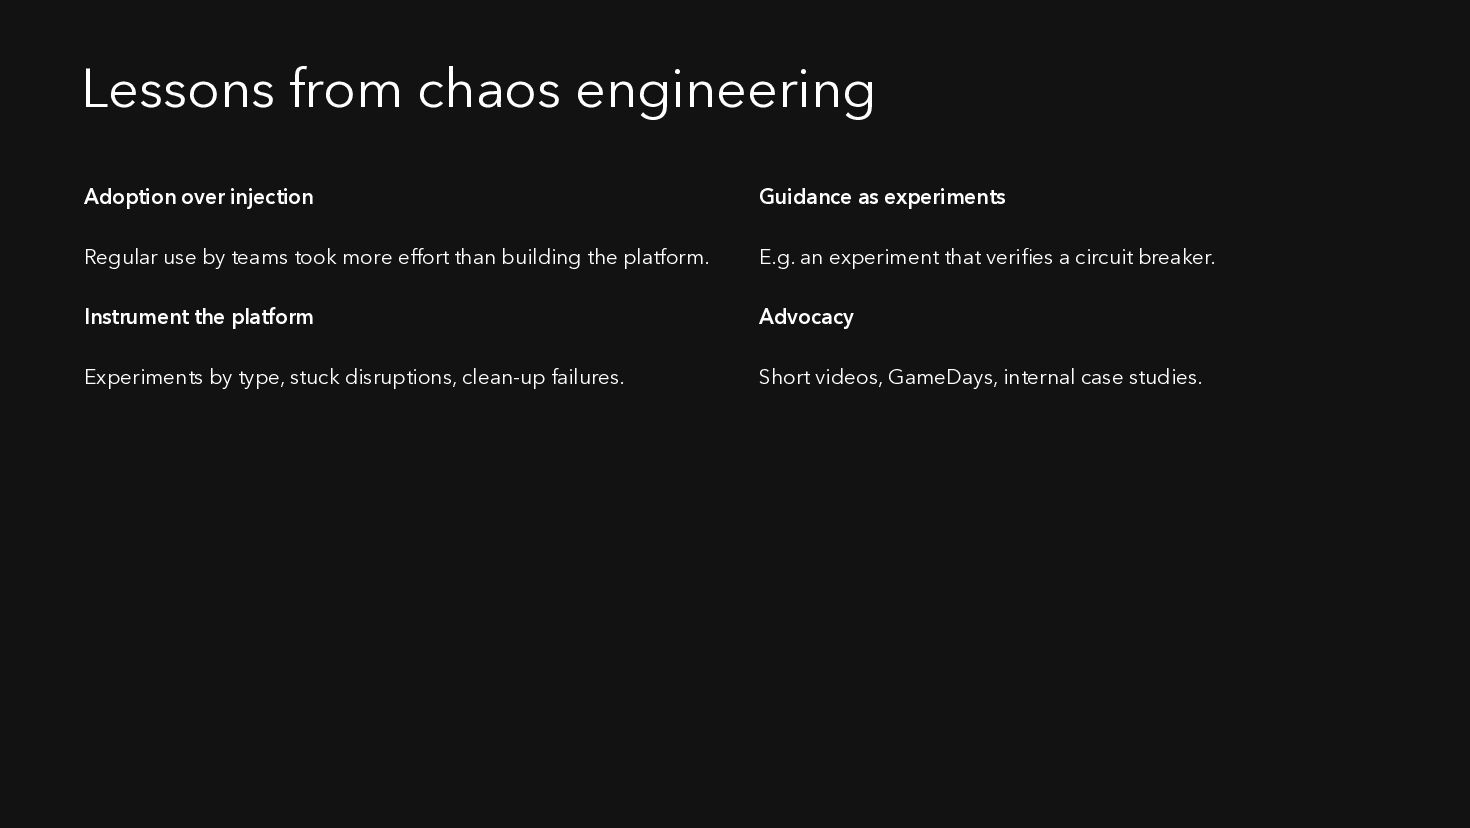
  15. Lessons from chaos engineering Adoption over injection Guidance as experiments

    Regular use by teams took more effort than building the platform. E.g. an experiment that verifies a circuit breaker. Instrument the platform Advocacy Experiments by type, stuck disruptions, clean-up failures. Short videos, GameDays, internal case studies.
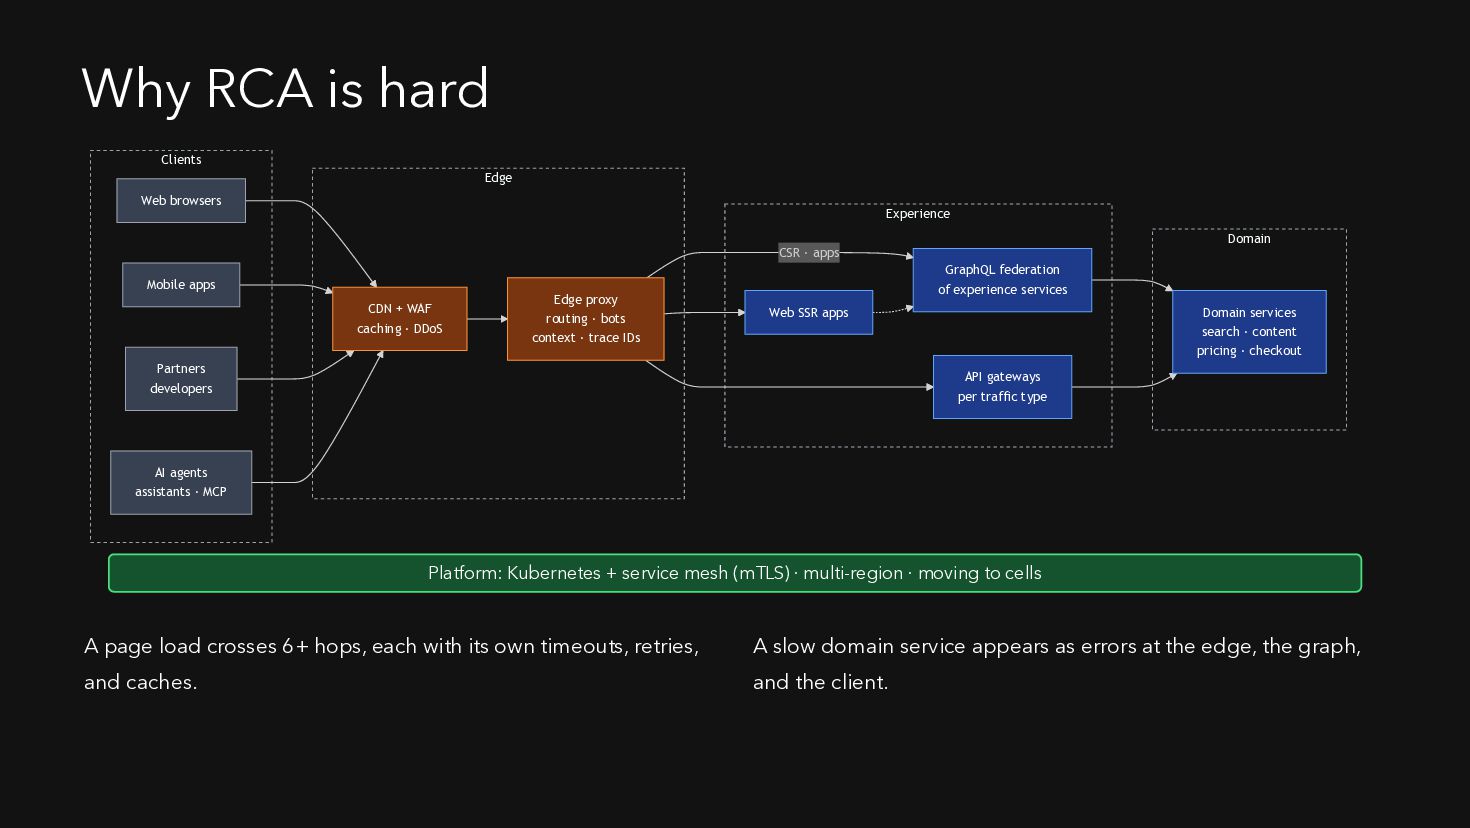
  16. Why RCA is hard Clients Edge Web browsers Experience Domain

    CSR · apps Mobile apps CDN + WAF caching · DDoS Edge proxy routing · bots context · trace IDs GraphQL federation of experience services Web SSR apps Partners developers Domain services search · content pricing · checkout API gateways per traffic type AI agents assistants · MCP Platform: Kubernetes + service mesh (mTLS) · multi-region · moving to cells A page load crosses 6+ hops, each with its own timeouts, retries, A slow domain service appears as errors at the edge, the graph, and caches. and the client.
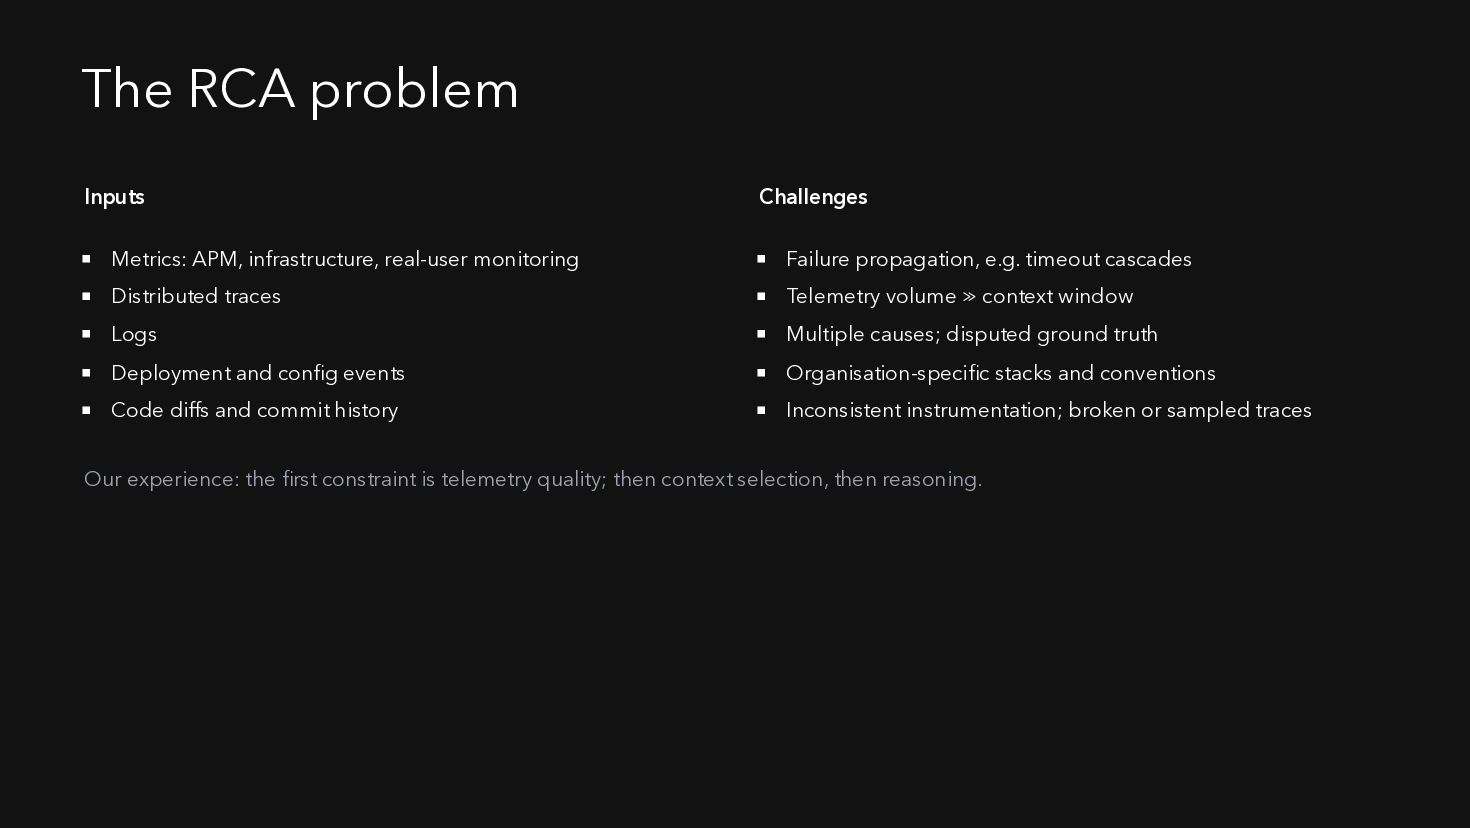
  17. The RCA problem Inputs Challenges Metrics: APM, infrastructure, real-user monitoring

    Failure propagation, e.g. timeout cascades Distributed traces Telemetry volume ≫ context window Logs Multiple causes; disputed ground truth Deployment and config events Organisation-specific stacks and conventions Code diffs and commit history Inconsistent instrumentation; broken or sampled traces Our experience: the first constraint is telemetry quality; then context selection, then reasoning.
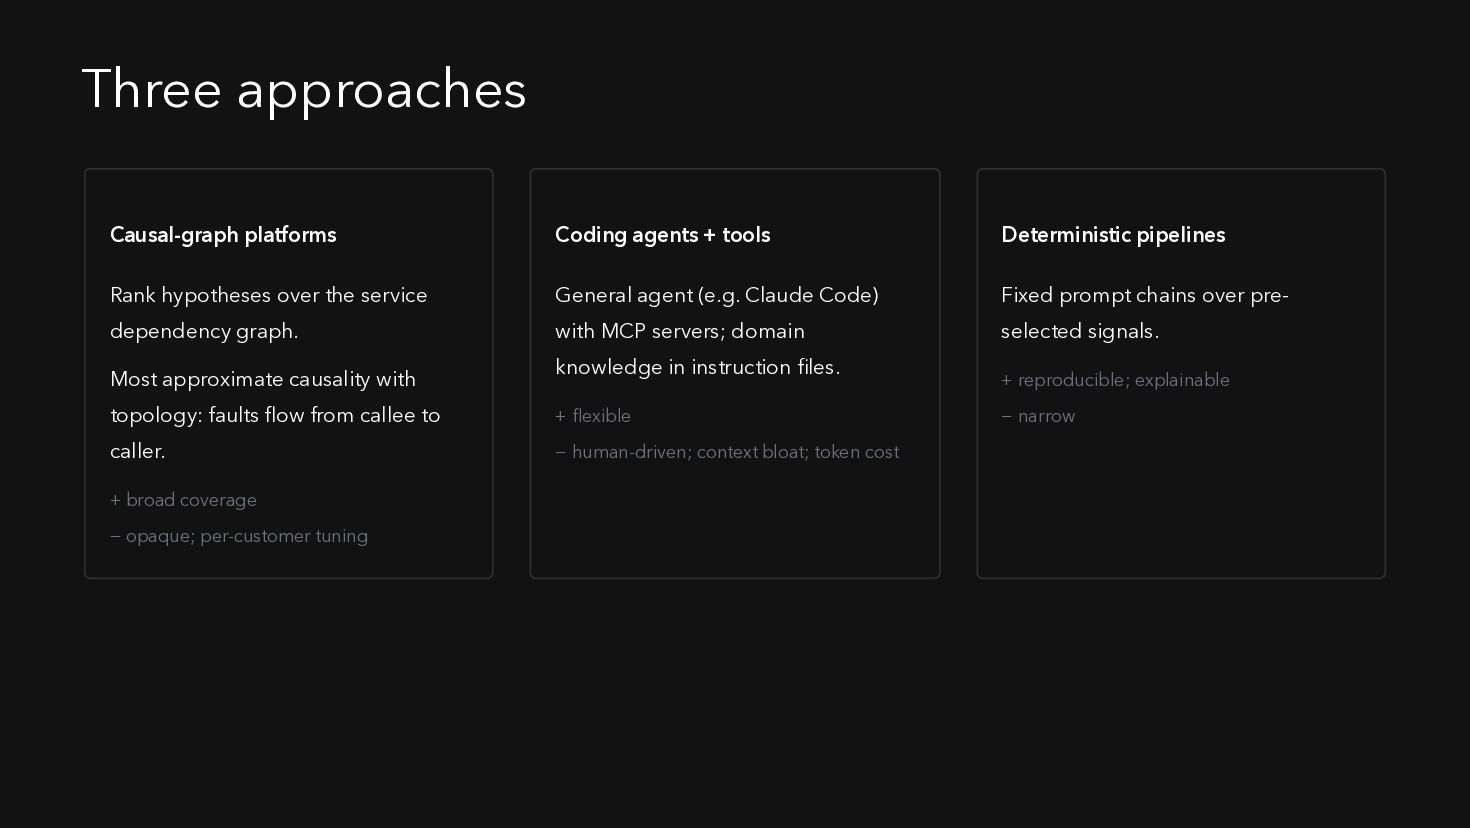
  18. Three approaches Causal-graph platforms Coding agents + tools Deterministic pipelines

    Rank hypotheses over the service General agent (e.g. Claude Code) Fixed prompt chains over pre- dependency graph. with MCP servers; domain selected signals. Most approximate causality with knowledge in instruction files. topology: faults flow from callee to + flexible caller. − human-driven; context bloat; token cost + broad coverage − opaque; per-customer tuning + reproducible; explainable − narrow
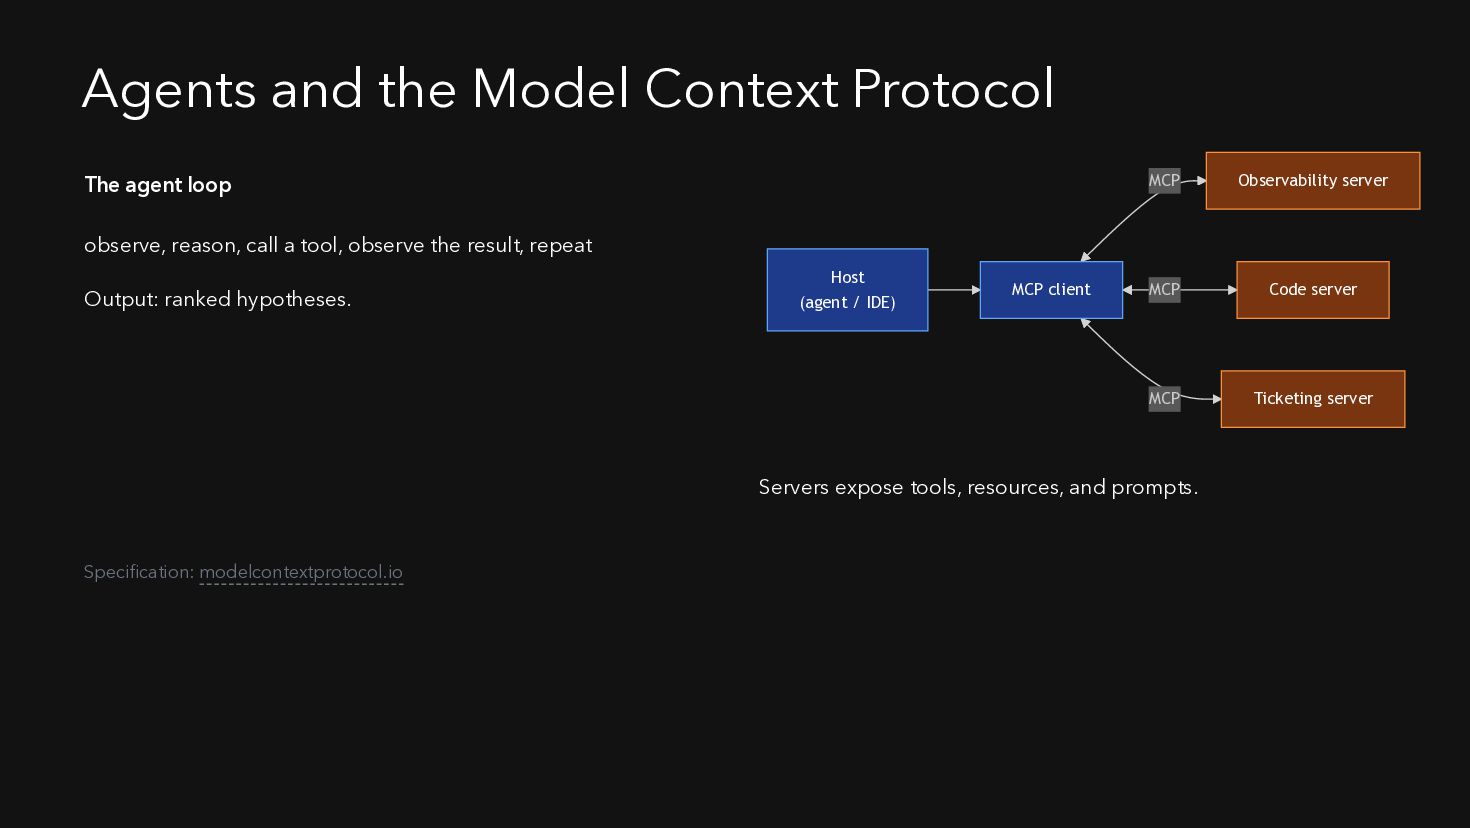
  19. Agents and the Model Context Protocol The agent loop MCP

    Observability server MCP Code server MCP Ticketing server observe, reason, call a tool, observe the result, repeat Output: ranked hypotheses. Host (agent / IDE) MCP client Servers expose tools, resources, and prompts. Specification: modelcontextprotocol.io
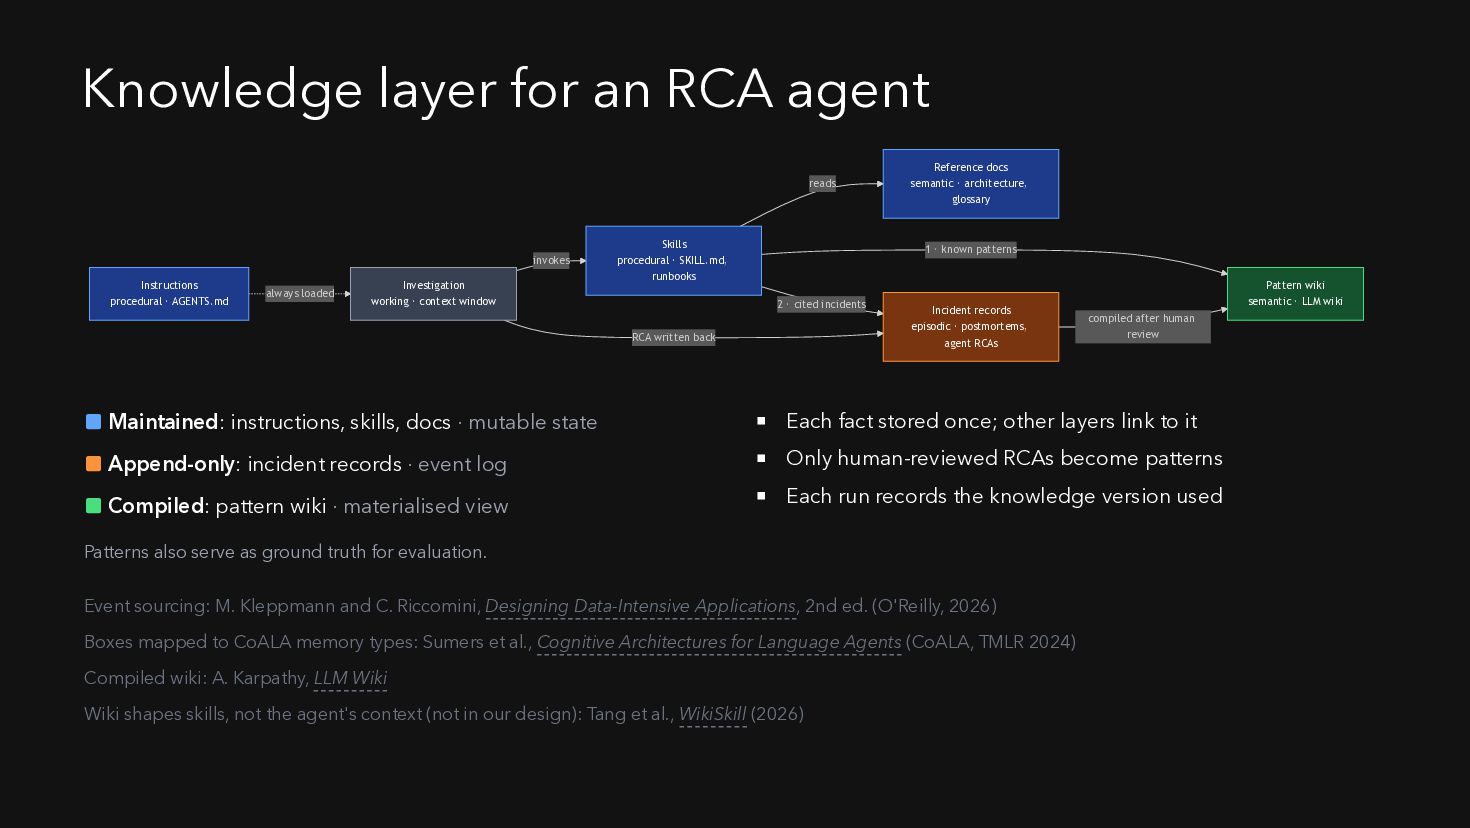
  20. Knowledge layer for an RCA agent reads invokes Instructions procedural

    · AGENTS.md always loaded Investigation working · context window Skills procedural · SKILL.md, runbooks 1 · known patterns 2 · cited incidents RCA written back ▪ Maintained: instructions, skills, docs · mutable state ▪ Append-only: incident records · event log ▪ Compiled: pattern wiki · materialised view Reference docs semantic · architecture, glossary Incident records episodic · postmortems, agent RCAs Pattern wiki semantic · LLM wiki compiled after human review Each fact stored once; other layers link to it Only human-reviewed RCAs become patterns Each run records the knowledge version used Patterns also serve as ground truth for evaluation. Event sourcing: M. Kleppmann and C. Riccomini, Designing Data-Intensive Applications, 2nd ed. (O'Reilly, 2026) Boxes mapped to CoALA memory types: Sumers et al., Cognitive Architectures for Language Agents (CoALA, TMLR 2024) Compiled wiki: A. Karpathy, LLM Wiki Wiki shapes skills, not the agent's context (not in our design): Tang et al., WikiSkill (2026)
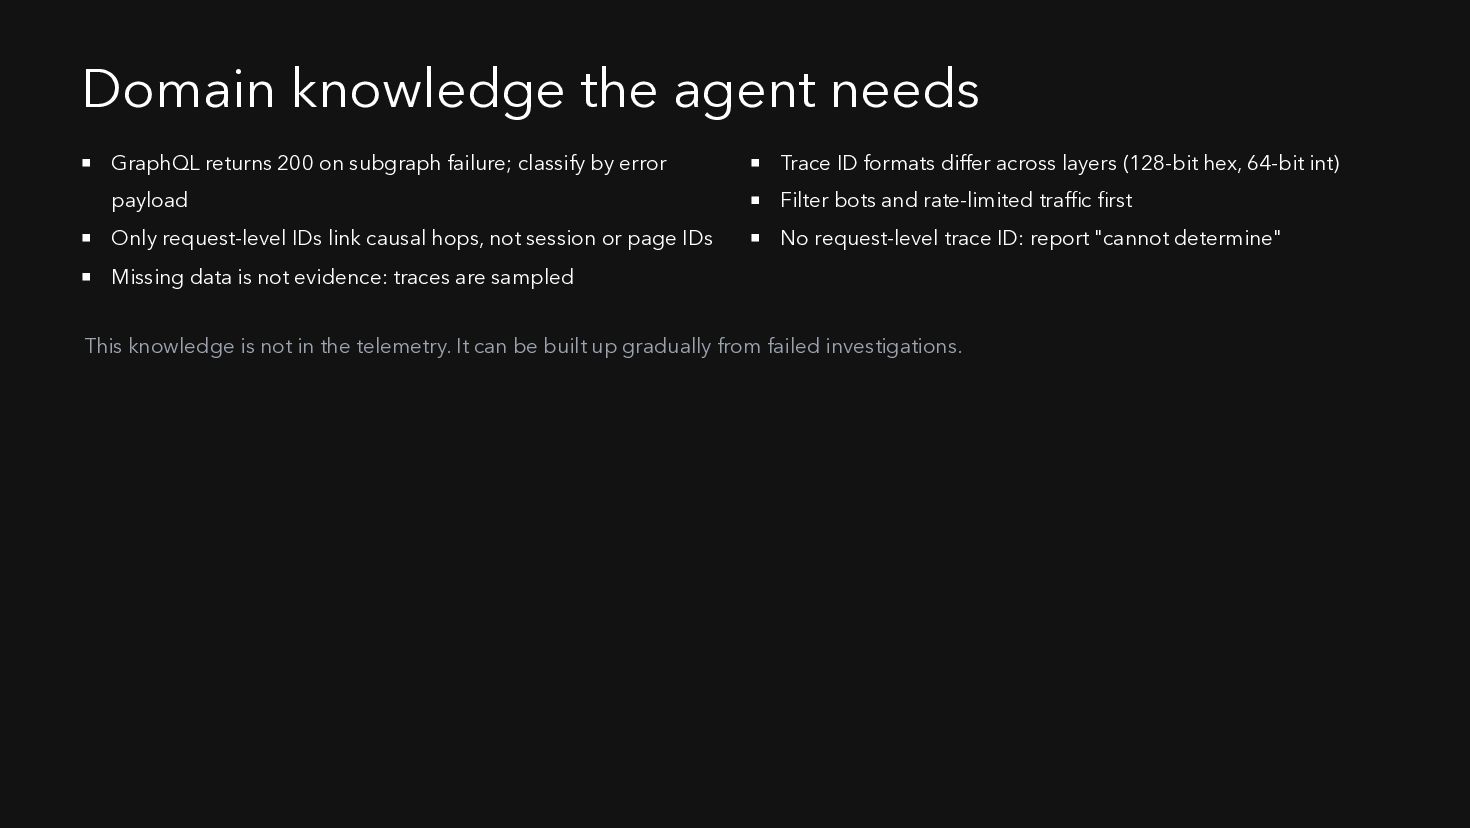
  21. Domain knowledge the agent needs GraphQL returns 200 on subgraph

    failure; classify by error Trace ID formats differ across layers (128-bit hex, 64-bit int) payload Filter bots and rate-limited traffic first Only request-level IDs link causal hops, not session or page IDs No request-level trace ID: report "cannot determine" Missing data is not evidence: traces are sampled This knowledge is not in the telemetry. It can be built up gradually from failed investigations.
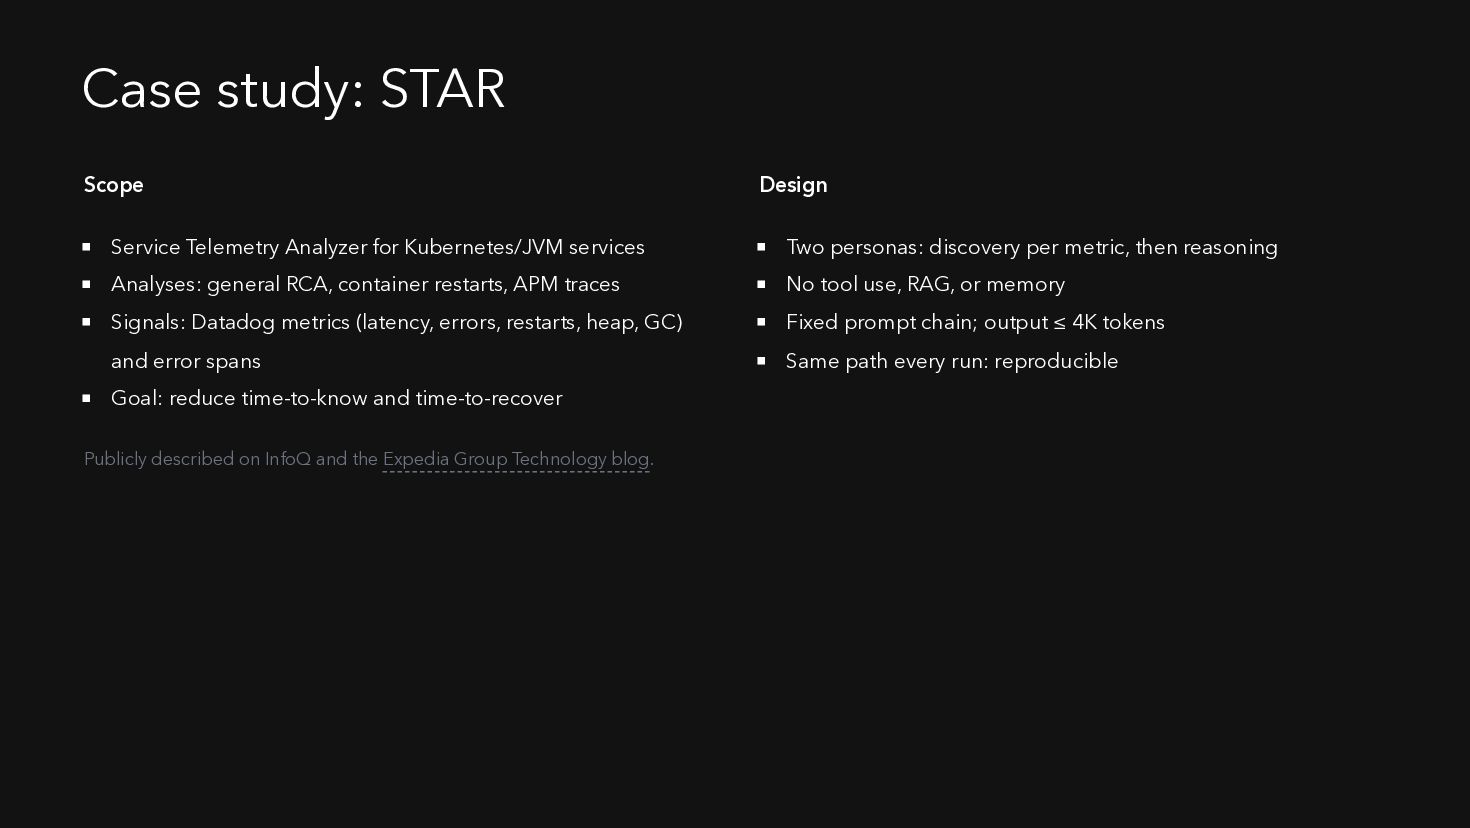
  22. Case study: STAR Scope Design Service Telemetry Analyzer for Kubernetes/JVM

    services Two personas: discovery per metric, then reasoning Analyses: general RCA, container restarts, APM traces No tool use, RAG, or memory Signals: Datadog metrics (latency, errors, restarts, heap, GC) Fixed prompt chain; output ≤ 4K tokens and error spans Same path every run: reproducible Goal: reduce time-to-know and time-to-recover Publicly described on InfoQ and the Expedia Group Technology blog.
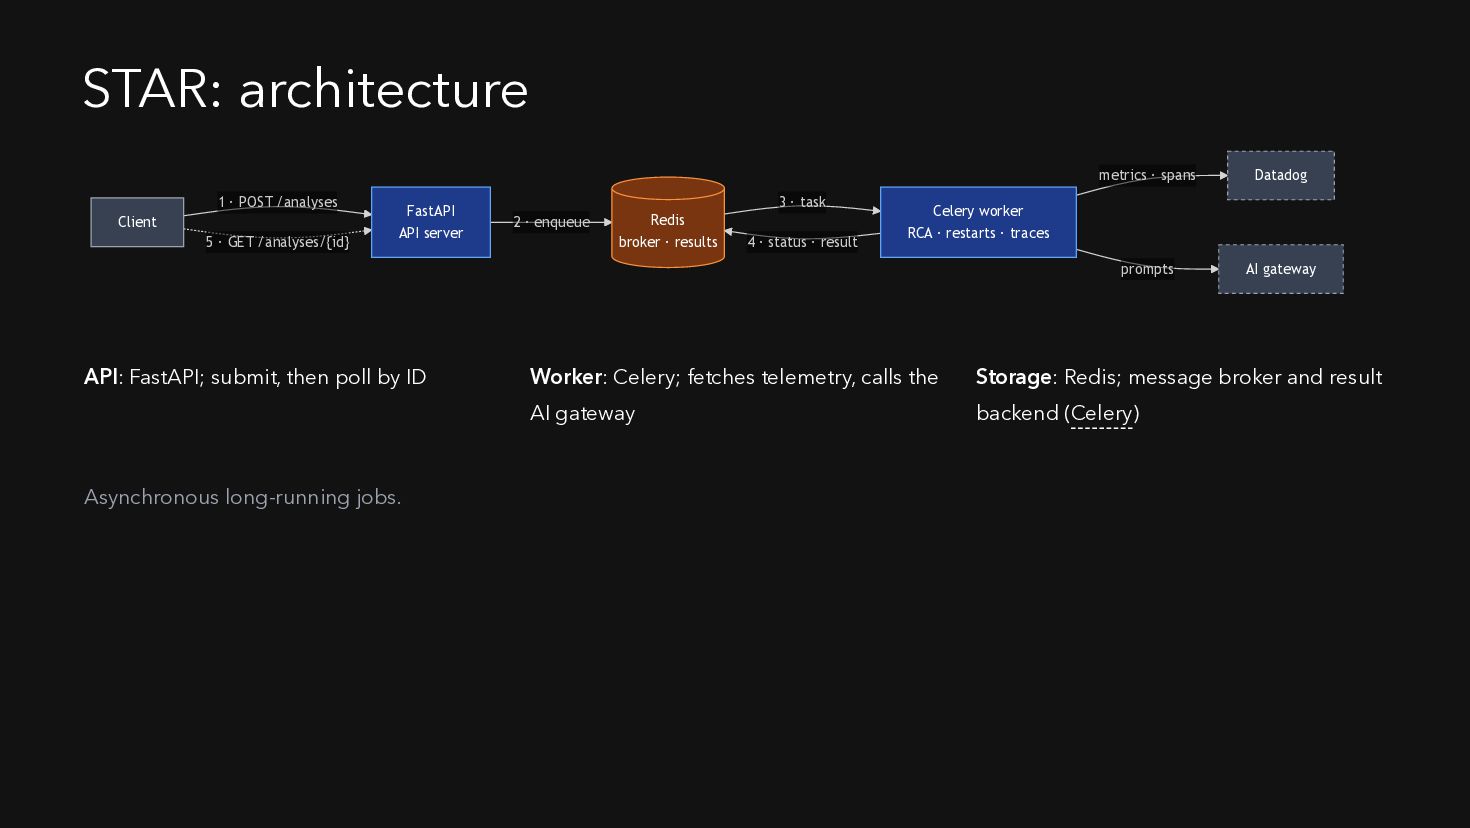
  23. STAR: architecture 1 · POST /analyses Client 5 · GET

    /analyses/{id} FastAPI API server API: FastAPI; submit, then poll by ID Asynchronous long-running jobs. 3 · task 2 · enqueue Redis broker · results 4 · status · result metrics · spans Datadog prompts AI gateway Celery worker RCA · restarts · traces Worker: Celery; fetches telemetry, calls the Storage: Redis; message broker and result AI gateway backend (Celery)
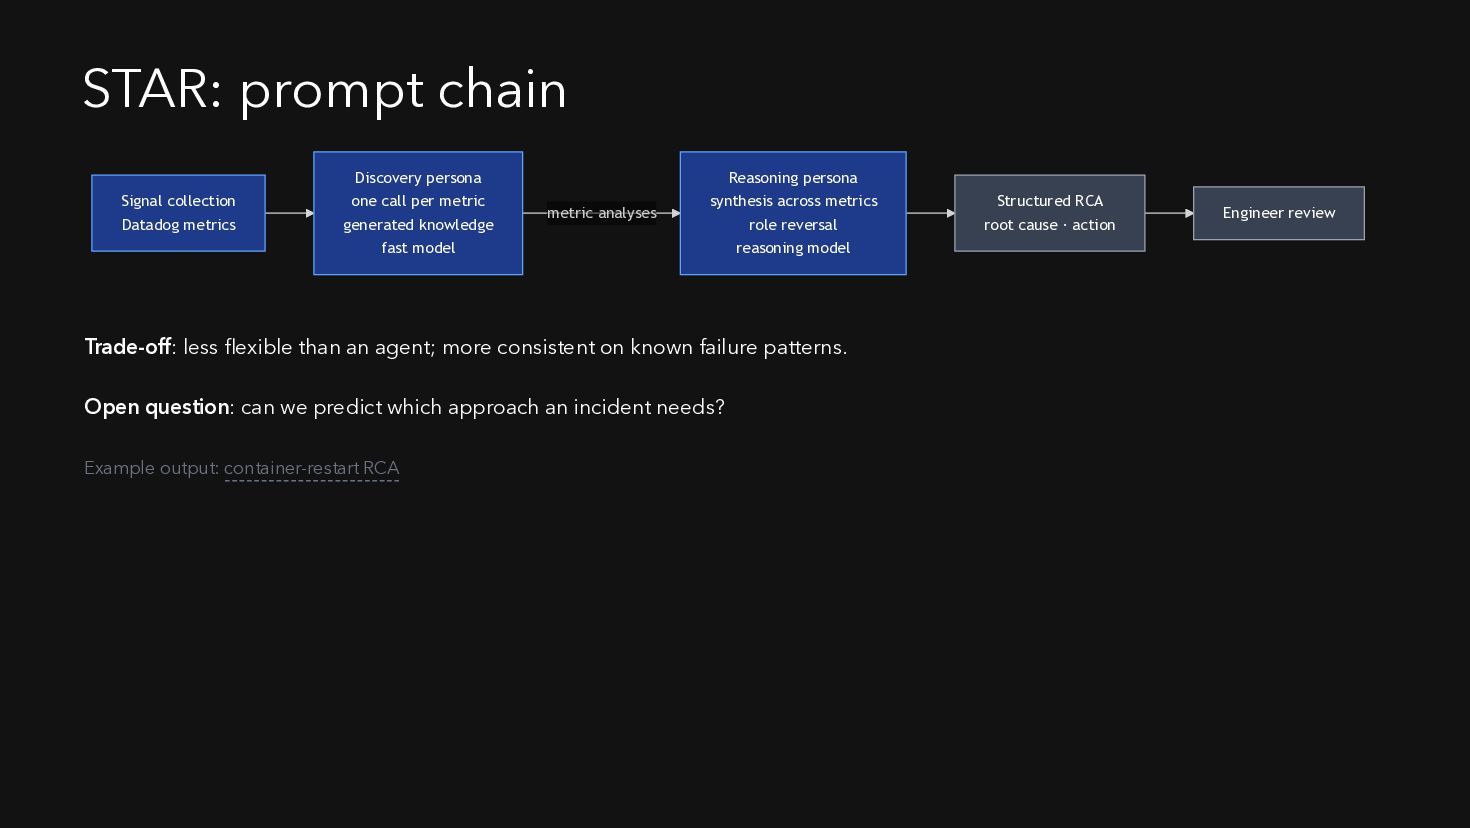
  24. STAR: prompt chain Signal collection Datadog metrics Discovery persona one

    call per metric generated knowledge fast model metric analyses Reasoning persona synthesis across metrics role reversal reasoning model Trade-off: less flexible than an agent; more consistent on known failure patterns. Open question: can we predict which approach an incident needs? Example output: container-restart RCA Structured RCA root cause · action Engineer review
  25. Evaluation pipeline Tool under test A Same inputs symptom ·

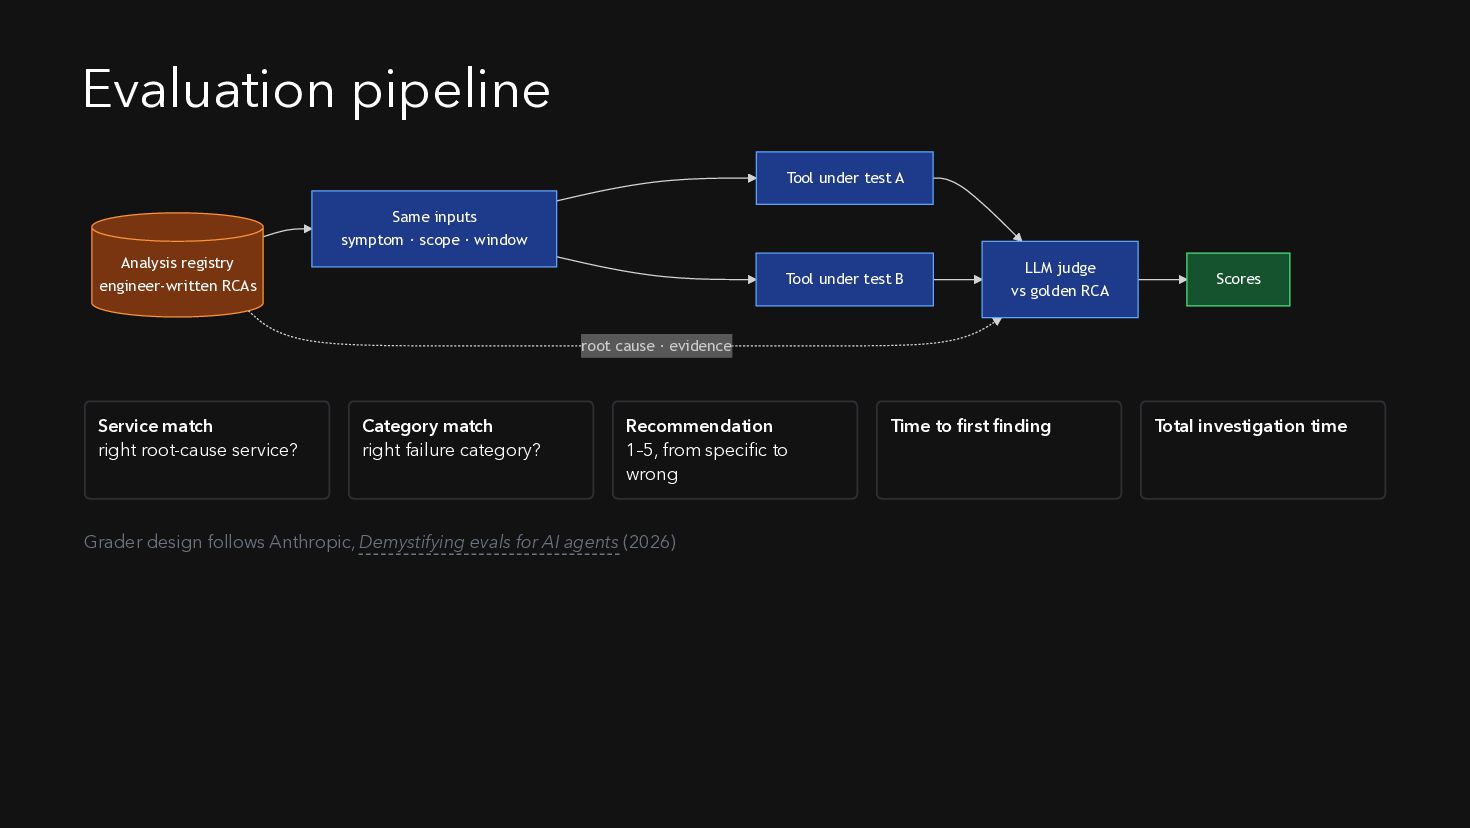
    scope · window Analysis registry engineer-written RCAs Tool under test B LLM judge vs golden RCA Scores root cause · evidence Service match right root-cause service? Category match right failure category? Recommendation 1–5, from specific to wrong Grader design follows Anthropic, Demystifying evals for AI agents (2026) Time to first finding Total investigation time
  26. Results: a commercial AI SRE agent 64% 76% 3.1 /

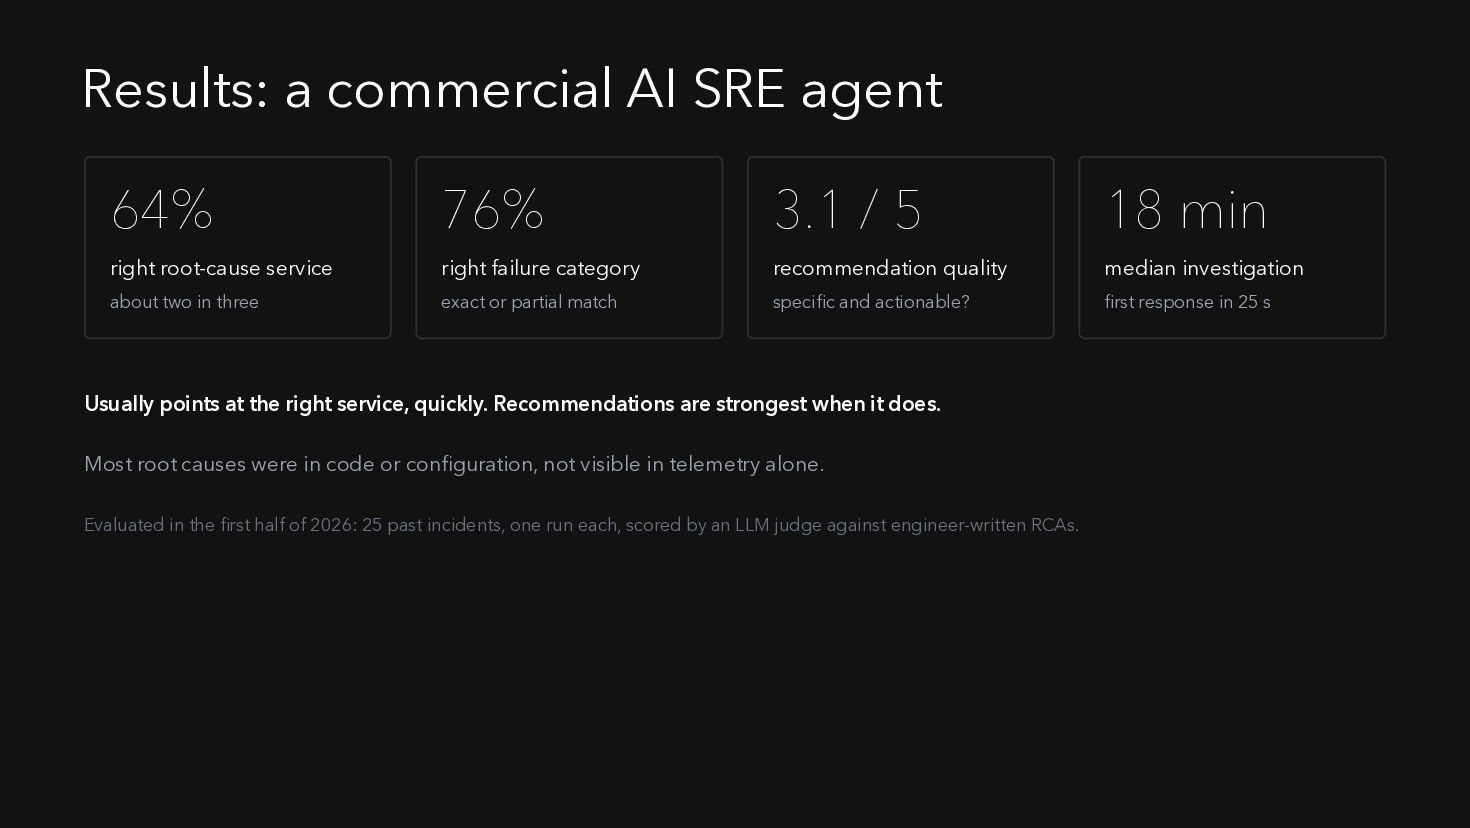
    5 18 min right root-cause service right failure category recommendation quality median investigation about two in three exact or partial match specific and actionable? first response in 25 s Usually points at the right service, quickly. Recommendations are strongest when it does. Most root causes were in code or configuration, not visible in telemetry alone. Evaluated in the first half of 2026: 25 past incidents, one run each, scored by an LLM judge against engineer-written RCAs.
  27. Challenges in evaluation Scoring Timing Operations What counts as right?

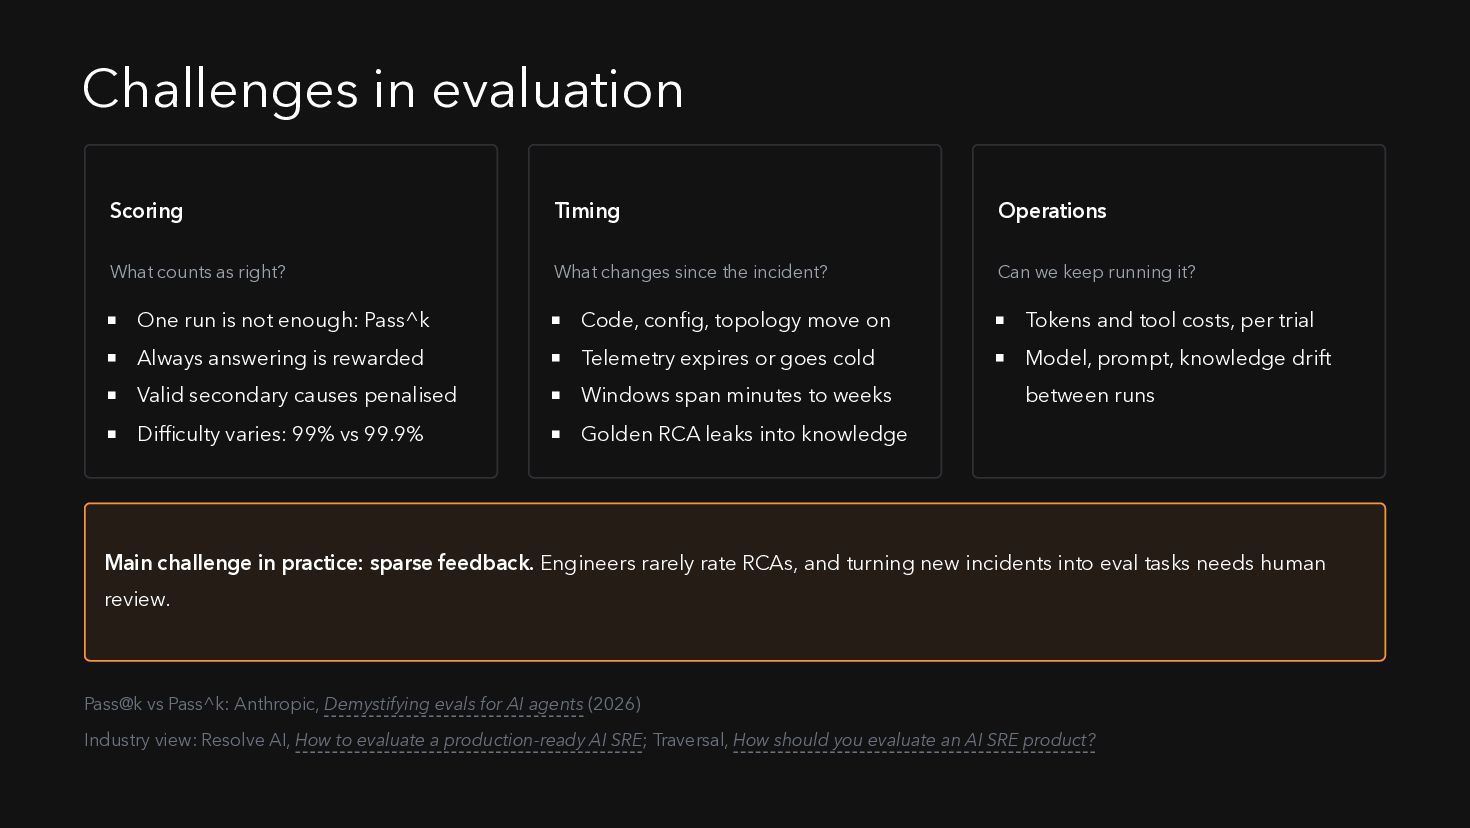
    What changes since the incident? Can we keep running it? One run is not enough: Pass^k Code, config, topology move on Tokens and tool costs, per trial Always answering is rewarded Telemetry expires or goes cold Model, prompt, knowledge drift Valid secondary causes penalised Windows span minutes to weeks between runs Difficulty varies: 99% vs 99.9% Golden RCA leaks into knowledge Main challenge in practice: sparse feedback. Engineers rarely rate RCAs, and turning new incidents into eval tasks needs human review. Pass@k vs Pass^k: Anthropic, Demystifying evals for AI agents (2026) Industry view: Resolve AI, How to evaluate a production-ready AI SRE; Traversal, How should you evaluate an AI SRE product?
  28. The benchmark gap Benchmark Focus OpenRCA / 2.0 Recorded telemetry;

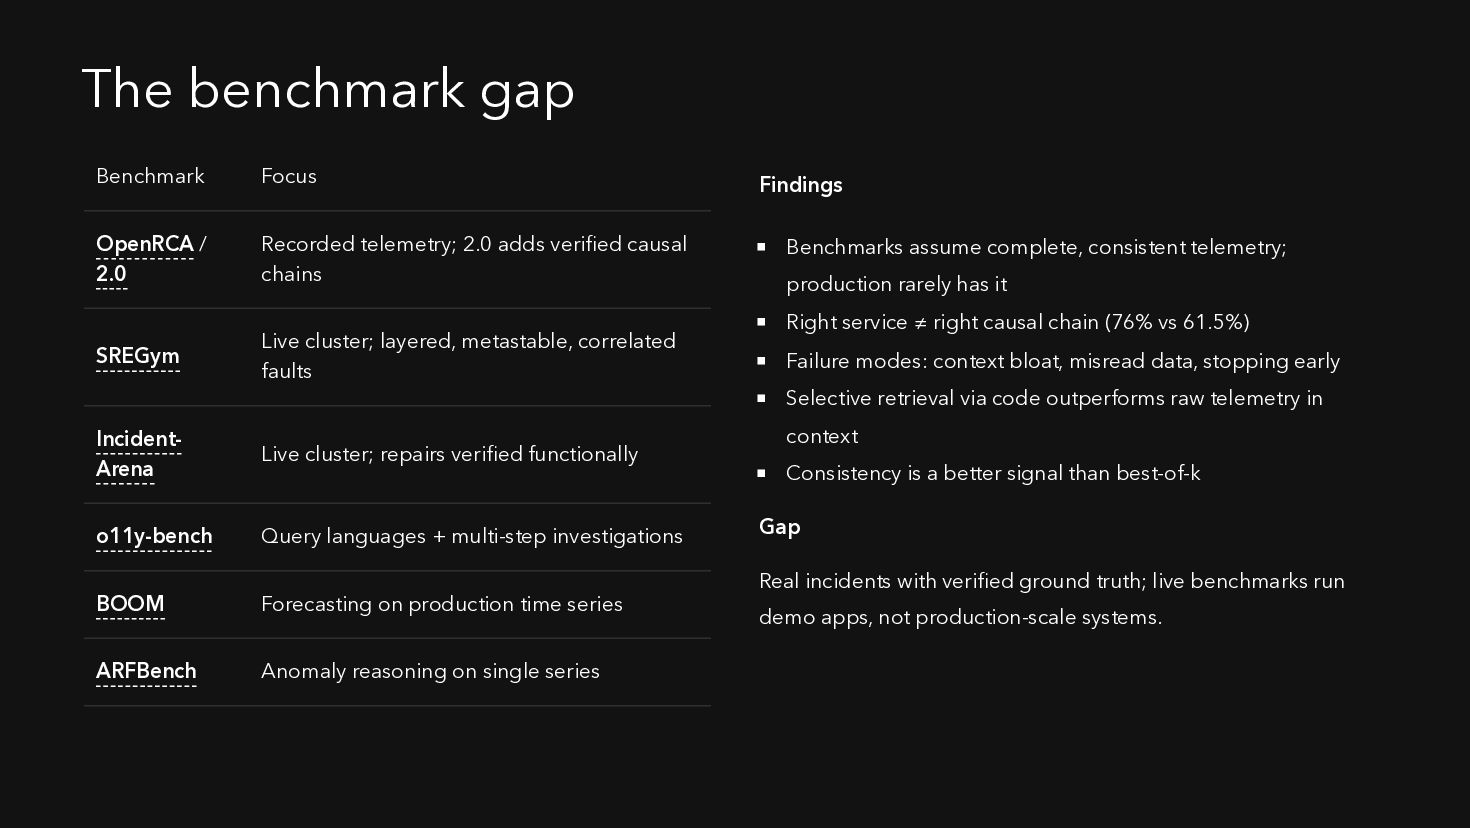
    2.0 adds verified causal chains SREGym Live cluster; layered, metastable, correlated faults IncidentArena Live cluster; repairs verified functionally o11y-bench Query languages + multi-step investigations BOOM Forecasting on production time series ARFBench Anomaly reasoning on single series Findings Benchmarks assume complete, consistent telemetry; production rarely has it Right service ≠ right causal chain (76% vs 61.5%) Failure modes: context bloat, misread data, stopping early Selective retrieval via code outperforms raw telemetry in context Consistency is a better signal than best-of-k Gap Real incidents with verified ground truth; live benchmarks run demo apps, not production-scale systems.
  29. Open questions TELEMETRY Standardisation as a prerequisite Agent-ready telemetry Is

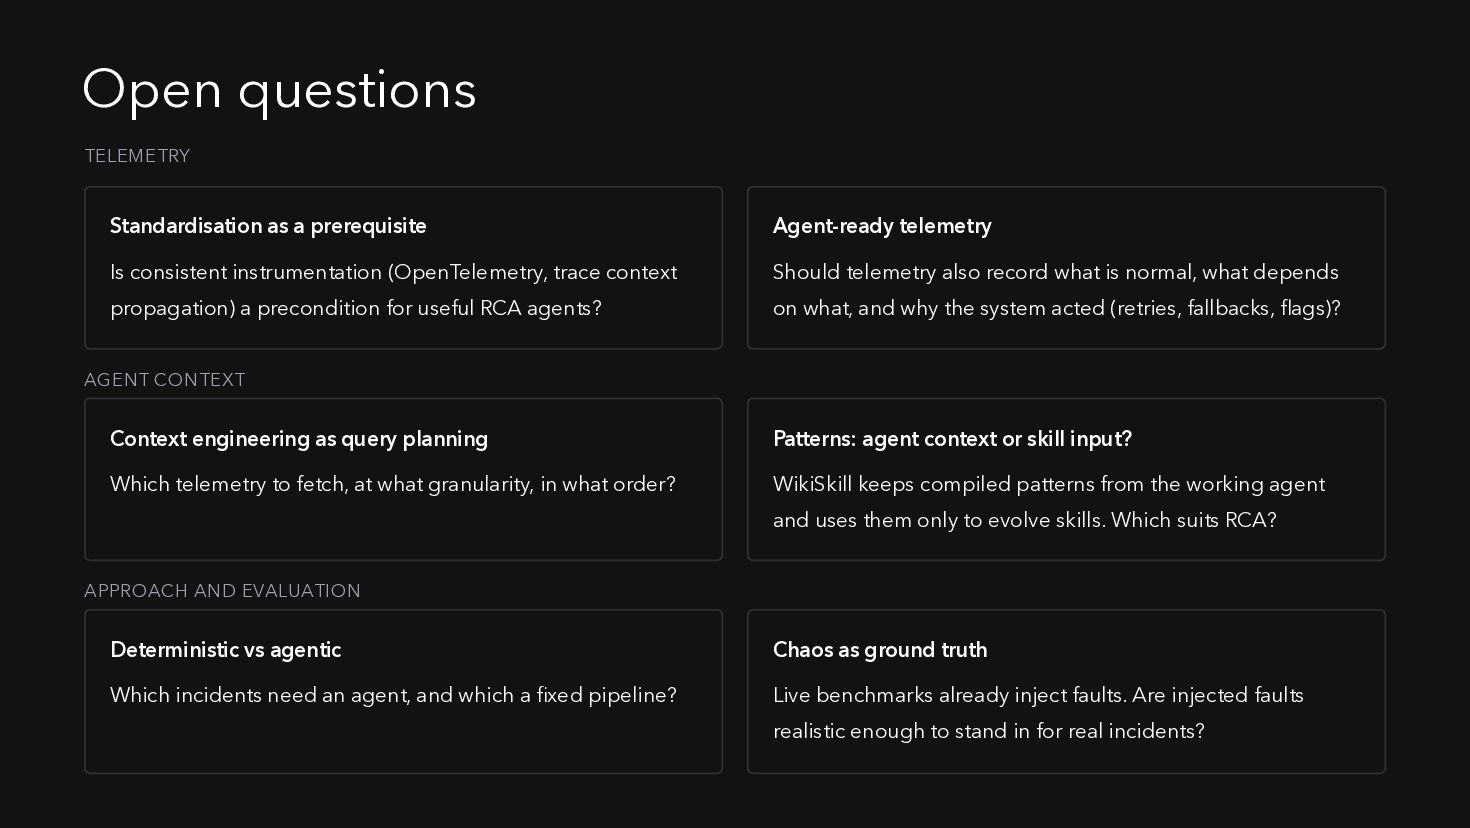
    consistent instrumentation (OpenTelemetry, trace context Should telemetry also record what is normal, what depends propagation) a precondition for useful RCA agents? on what, and why the system acted (retries, fallbacks, flags)? AGENT CONTEXT Context engineering as query planning Patterns: agent context or skill input? Which telemetry to fetch, at what granularity, in what order? WikiSkill keeps compiled patterns from the working agent and uses them only to evolve skills. Which suits RCA? APPROACH AND EVALUATION Deterministic vs agentic Chaos as ground truth Which incidents need an agent, and which a fixed pipeline? Live benchmarks already inject faults. Are injected faults realistic enough to stand in for real incidents?
  30. Appendix: references Background Compute platform Beyer et al., Site Reliability

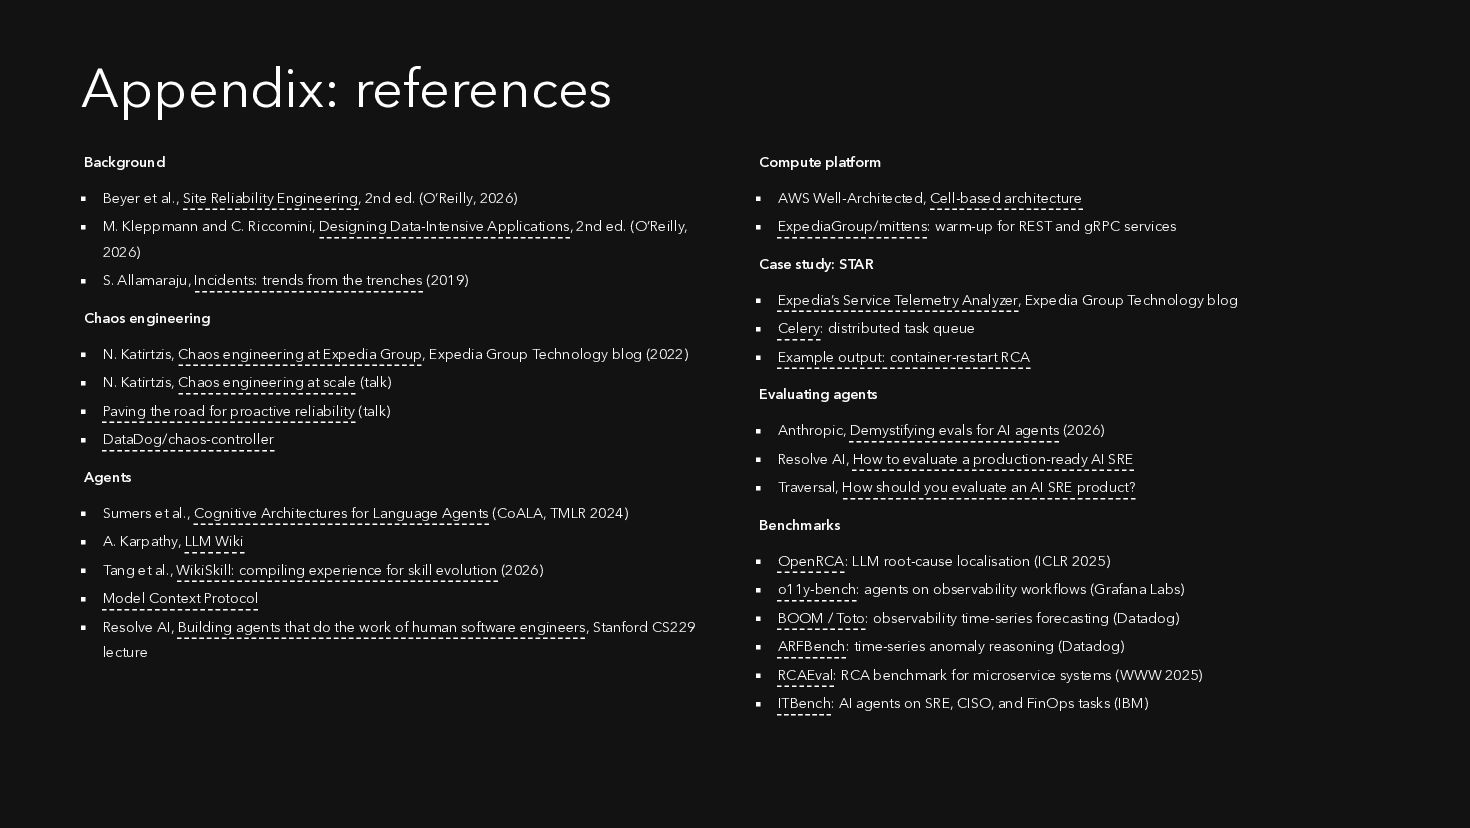
    Engineering, 2nd ed. (O’Reilly, 2026) AWS Well-Architected, Cell-based architecture M. Kleppmann and C. Riccomini, Designing Data-Intensive Applications, 2nd ed. (O’Reilly, ExpediaGroup/mittens: warm-up for REST and gRPC services 2026) S. Allamaraju, Incidents: trends from the trenches (2019) Chaos engineering N. Katirtzis, Chaos engineering at Expedia Group, Expedia Group Technology blog (2022) N. Katirtzis, Chaos engineering at scale (talk) Paving the road for proactive reliability (talk) DataDog/chaos-controller Agents Sumers et al., Cognitive Architectures for Language Agents (CoALA, TMLR 2024) A. Karpathy, LLM Wiki Tang et al., WikiSkill: compiling experience for skill evolution (2026) Model Context Protocol Resolve AI, Building agents that do the work of human software engineers, Stanford CS229 lecture Case study: STAR Expedia’s Service Telemetry Analyzer, Expedia Group Technology blog Celery: distributed task queue Example output: container-restart RCA Evaluating agents Anthropic, Demystifying evals for AI agents (2026) Resolve AI, How to evaluate a production-ready AI SRE Traversal, How should you evaluate an AI SRE product? Benchmarks OpenRCA: LLM root-cause localisation (ICLR 2025) o11y-bench: agents on observability workflows (Grafana Labs) BOOM / Toto: observability time-series forecasting (Datadog) ARFBench: time-series anomaly reasoning (Datadog) RCAEval: RCA benchmark for microservice systems (WWW 2025) ITBench: AI agents on SRE, CISO, and FinOps tasks (IBM)
  31. Appendix: recent research (2026) Benchmarks Failure analysis and approaches Fang

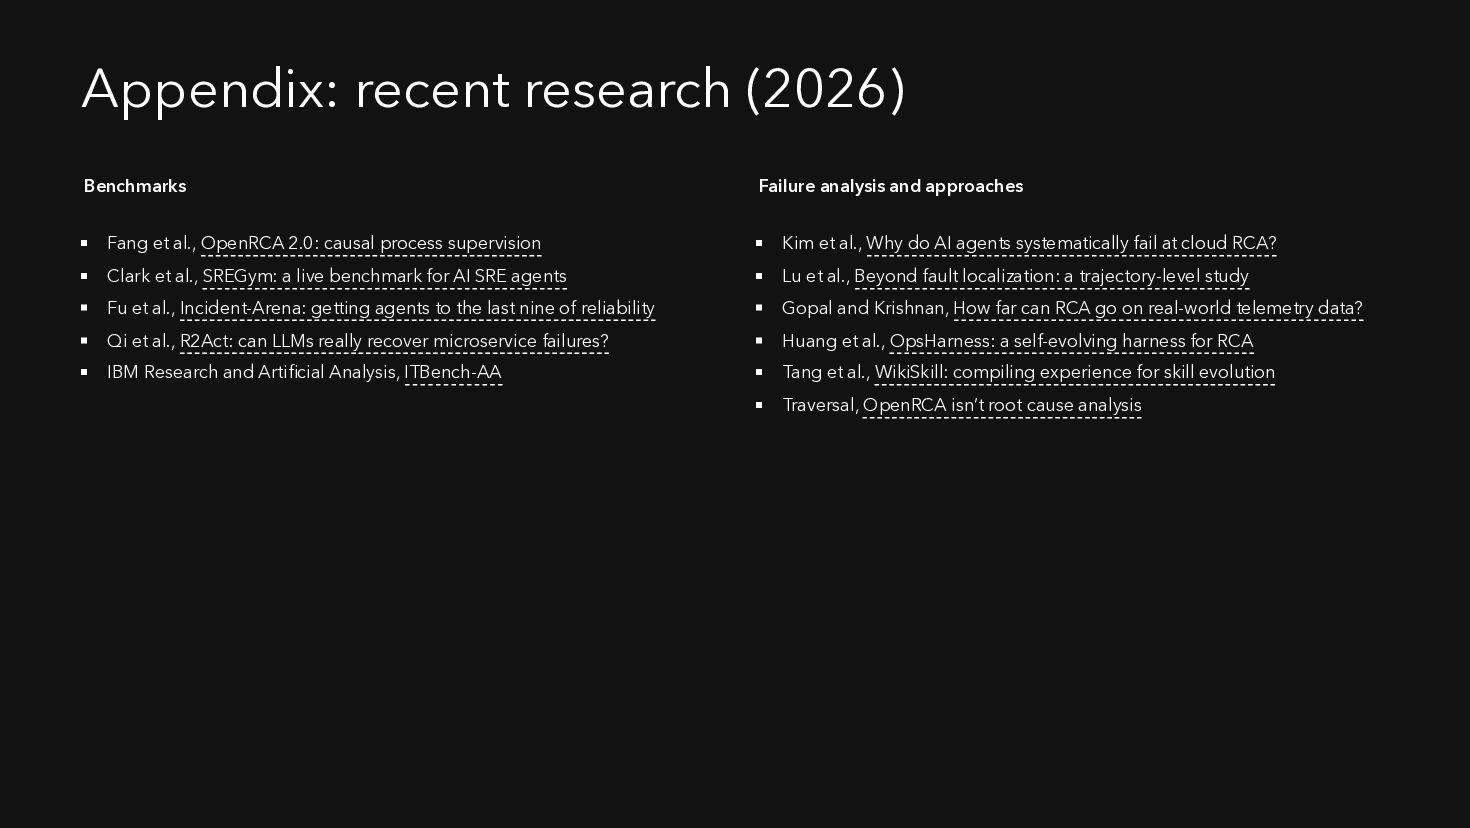
    et al., OpenRCA 2.0: causal process supervision Kim et al., Why do AI agents systematically fail at cloud RCA? Clark et al., SREGym: a live benchmark for AI SRE agents Lu et al., Beyond fault localization: a trajectory-level study Fu et al., Incident-Arena: getting agents to the last nine of reliability Gopal and Krishnan, How far can RCA go on real-world telemetry data? Qi et al., R2Act: can LLMs really recover microservice failures? Huang et al., OpsHarness: a self-evolving harness for RCA IBM Research and Artificial Analysis, ITBench-AA Tang et al., WikiSkill: compiling experience for skill evolution Traversal, OpenRCA isn’t root cause analysis