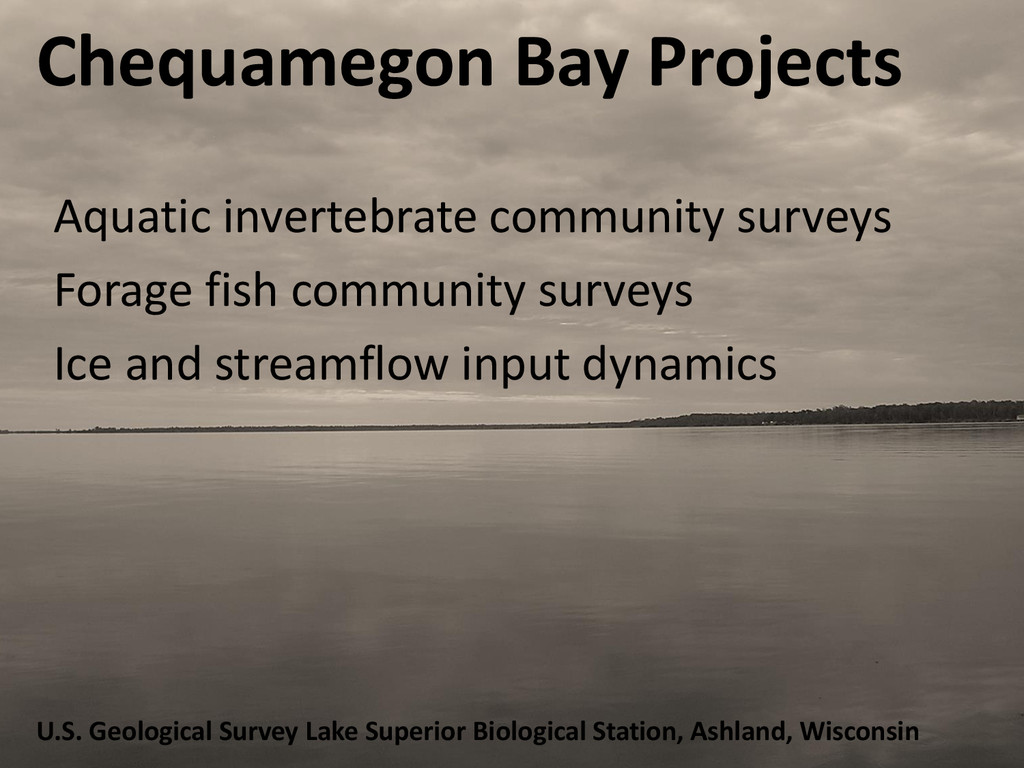
Chequamegon Bay Projects: Aquatic invertebrate community surveys, forage fish community surveys, ice and streamflow input dynamics (USGS Provisional Data)
Mark Vinson, US Geological Survey, Ashland, WI
Presentation at the Chequamegon Bay Research Symposium, April 14, 2015
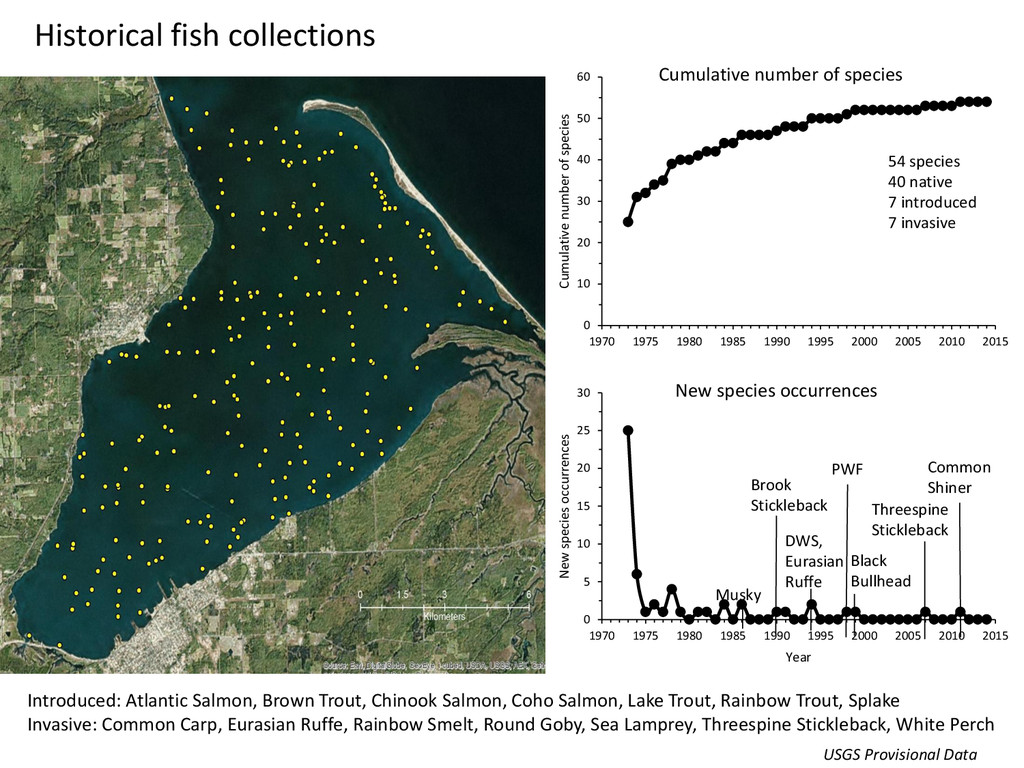
1970 1975 1980 1985 1990 1995 2000 2005 2010 2015 Cumulative number of species Cumulative number of species 0 5 10 15 20 25 30 1970 1975 1980 1985 1990 1995 2000 2005 2010 2015 New species occurrences Year New species occurrences Common Shiner Threespine Stickleback DWS, Eurasian Ruffe PWF Black Bullhead Musky Brook Stickleback 54 species 40 native 7 introduced 7 invasive Introduced: Atlantic Salmon, Brown Trout, Chinook Salmon, Coho Salmon, Lake Trout, Rainbow Trout, Splake Invasive: Common Carp, Eurasian Ruffe, Rainbow Smelt, Round Goby, Sea Lamprey, Threespine Stickleback, White Perch USGS Provisional Data
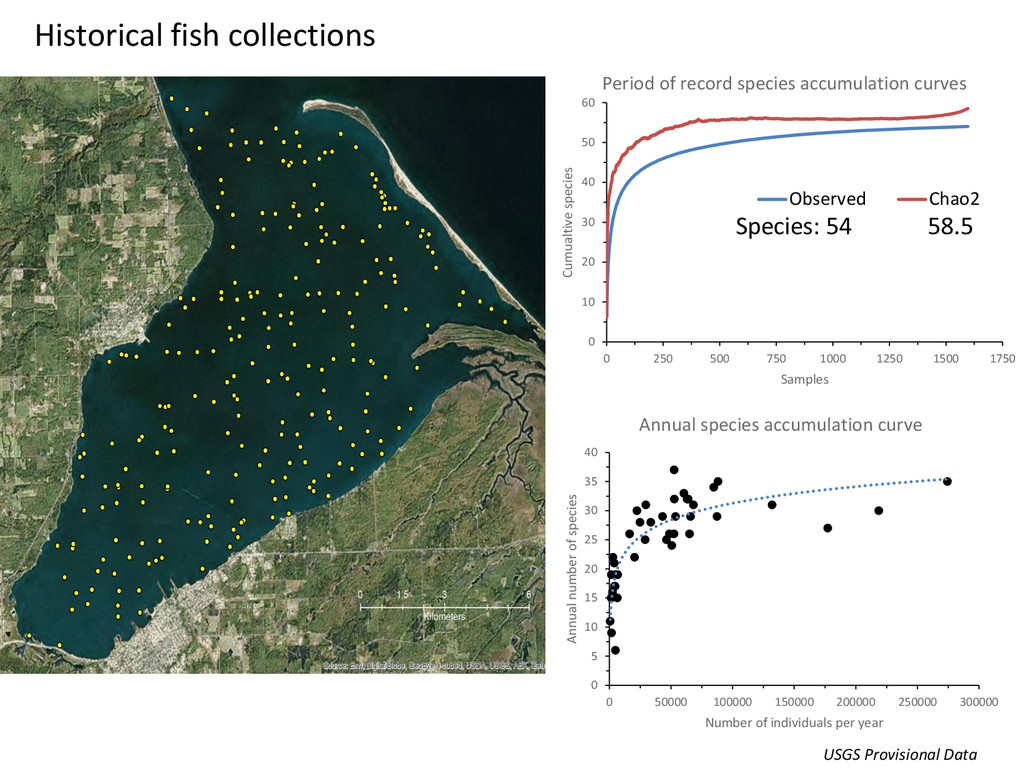
35 40 0 50000 100000 150000 200000 250000 300000 Annual number of species Number of individuals per year Annual species accumulation curve 0 10 20 30 40 50 60 0 250 500 750 1000 1250 1500 1750 Cumualtive species Samples Period of record species accumulation curves Observed Chao2 Species: 54 58.5 USGS Provisional Data
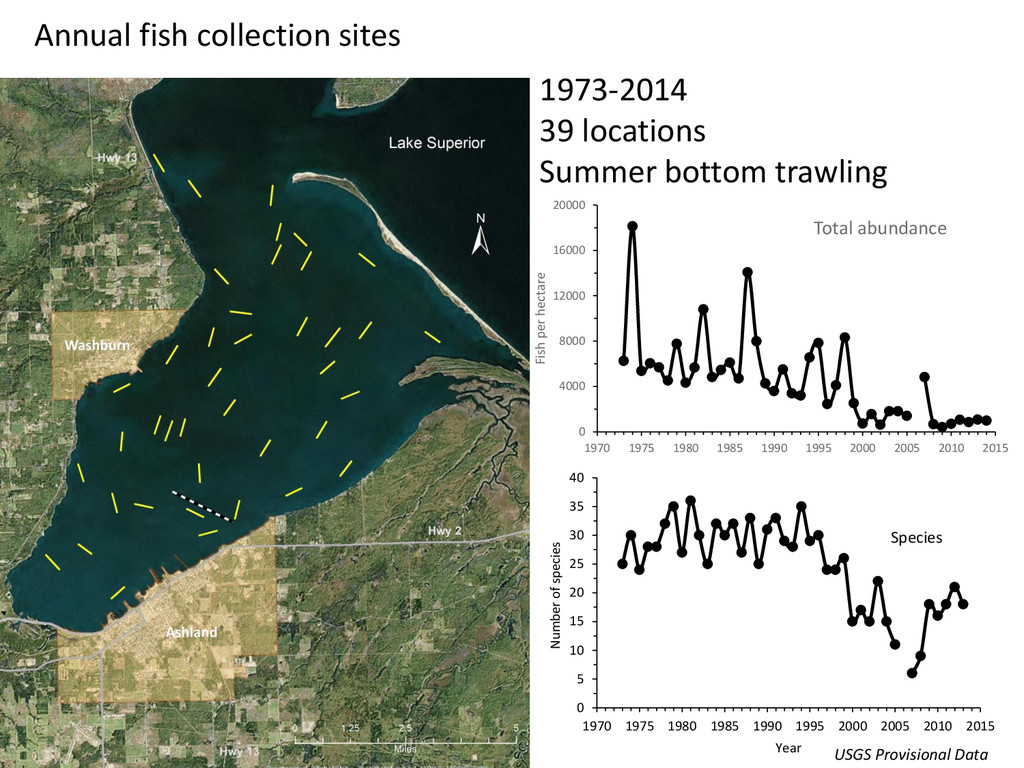
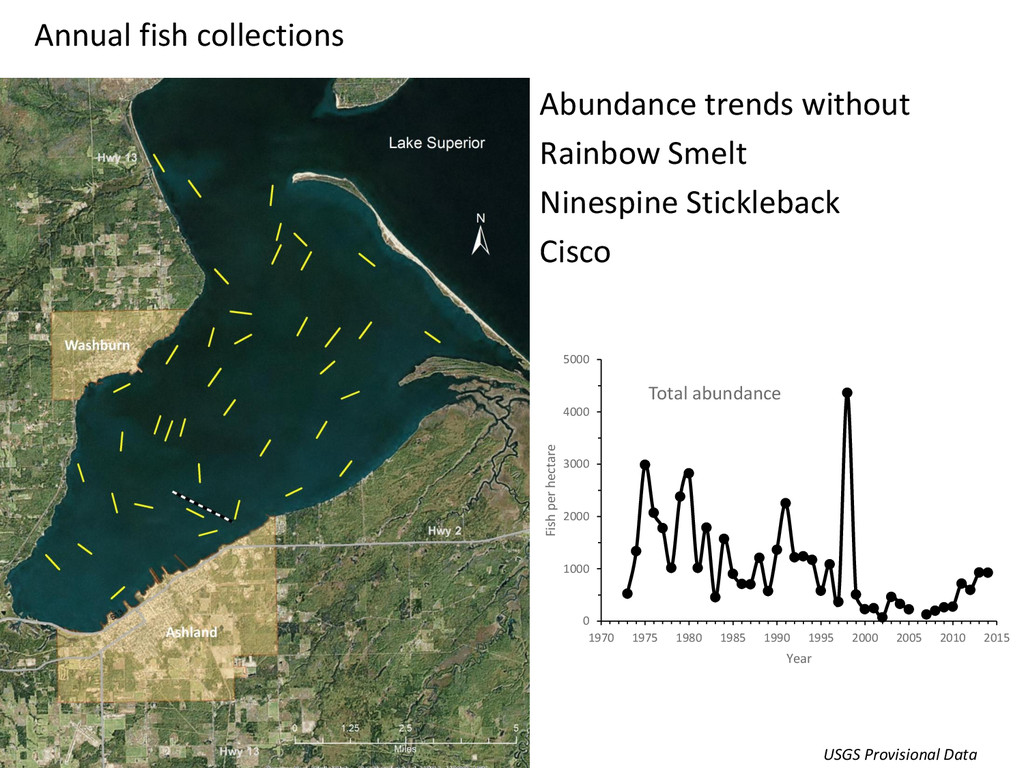
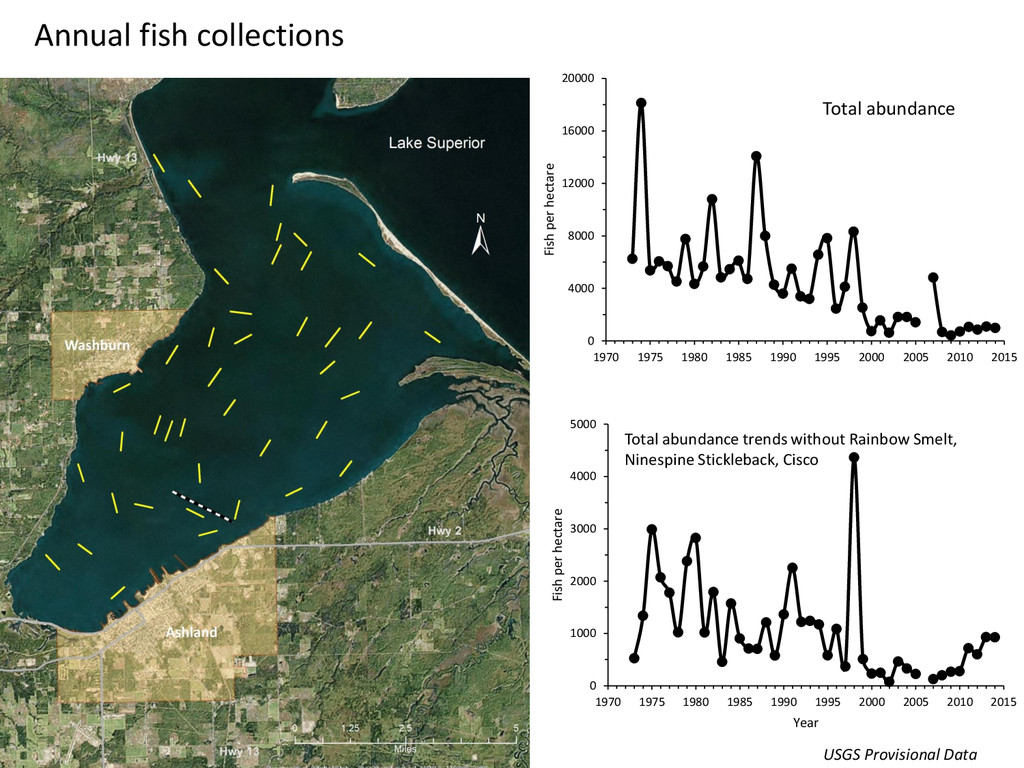
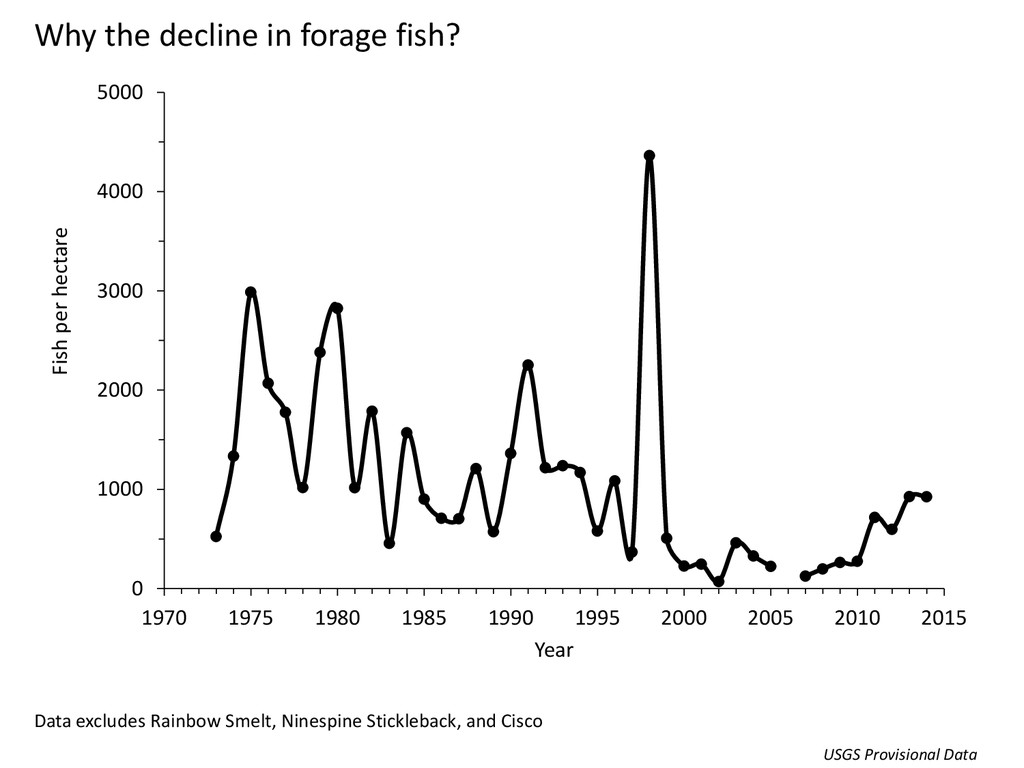
1990 1995 2000 2005 2010 2015 Fish per hectare Year Why the decline in forage fish? Data excludes Rainbow Smelt, Ninespine Stickleback, and Cisco USGS Provisional Data
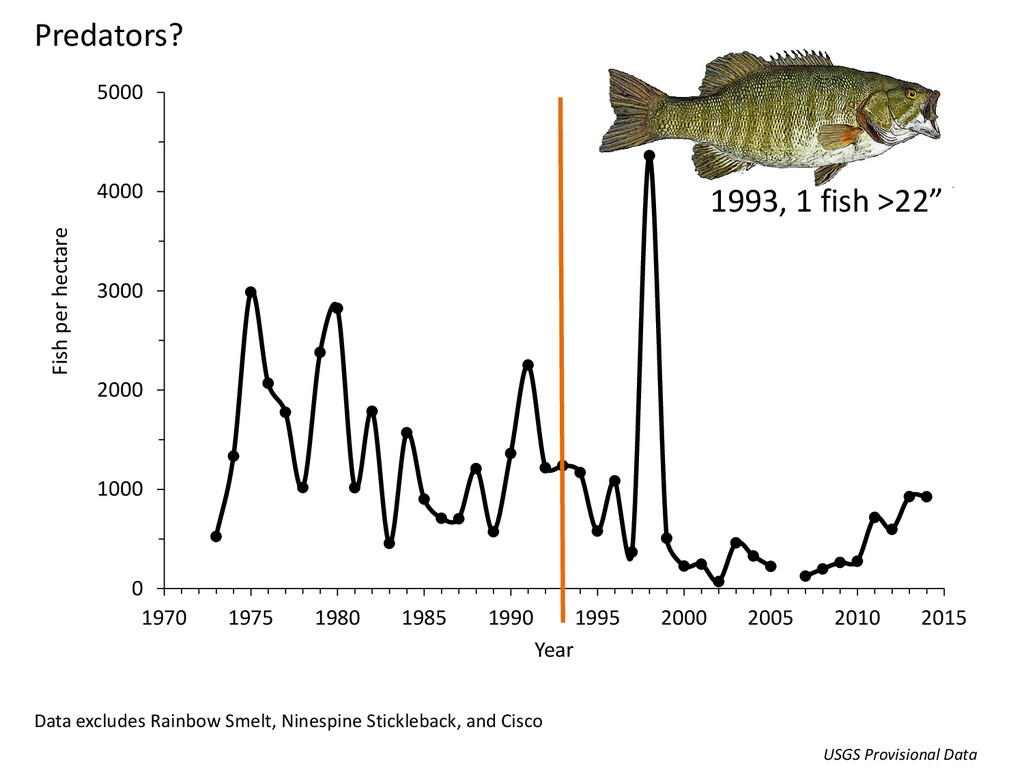
1990 1995 2000 2005 2010 2015 Fish per hectare Year 1993, 1 fish >22” Predators? Data excludes Rainbow Smelt, Ninespine Stickleback, and Cisco USGS Provisional Data
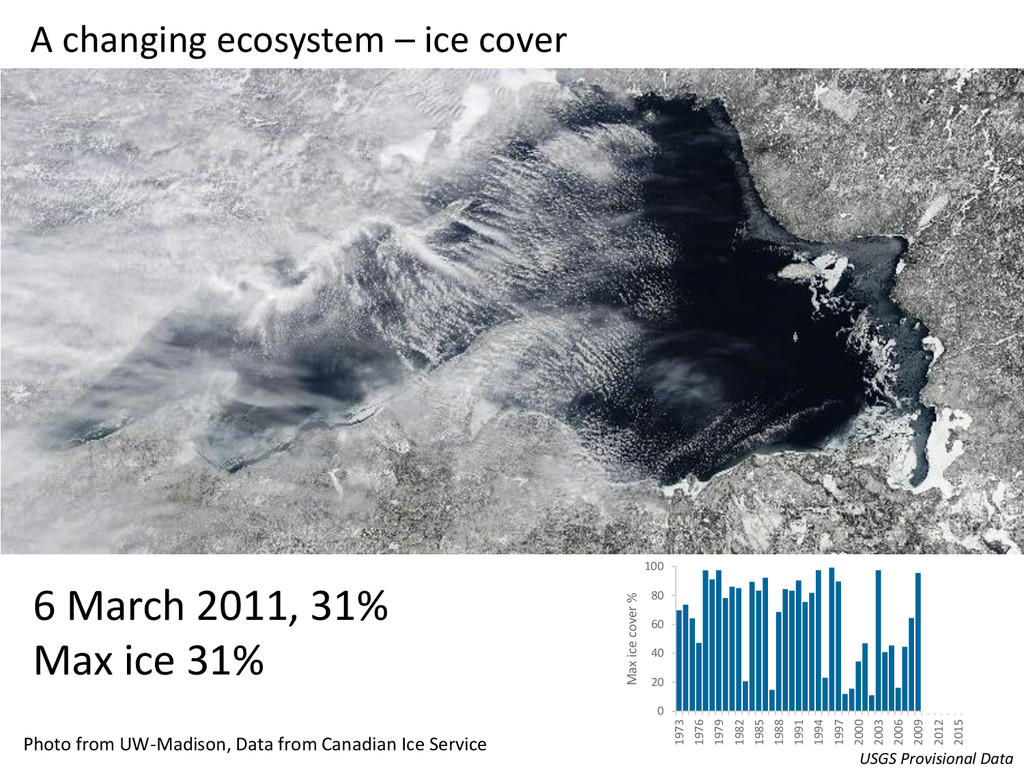
Max ice 31% 0 20 40 60 80 100 1973 1976 1979 1982 1985 1988 1991 1994 1997 2000 2003 2006 2009 2012 2015 Max ice cover % Photo from UW-Madison, Data from Canadian Ice Service USGS Provisional Data
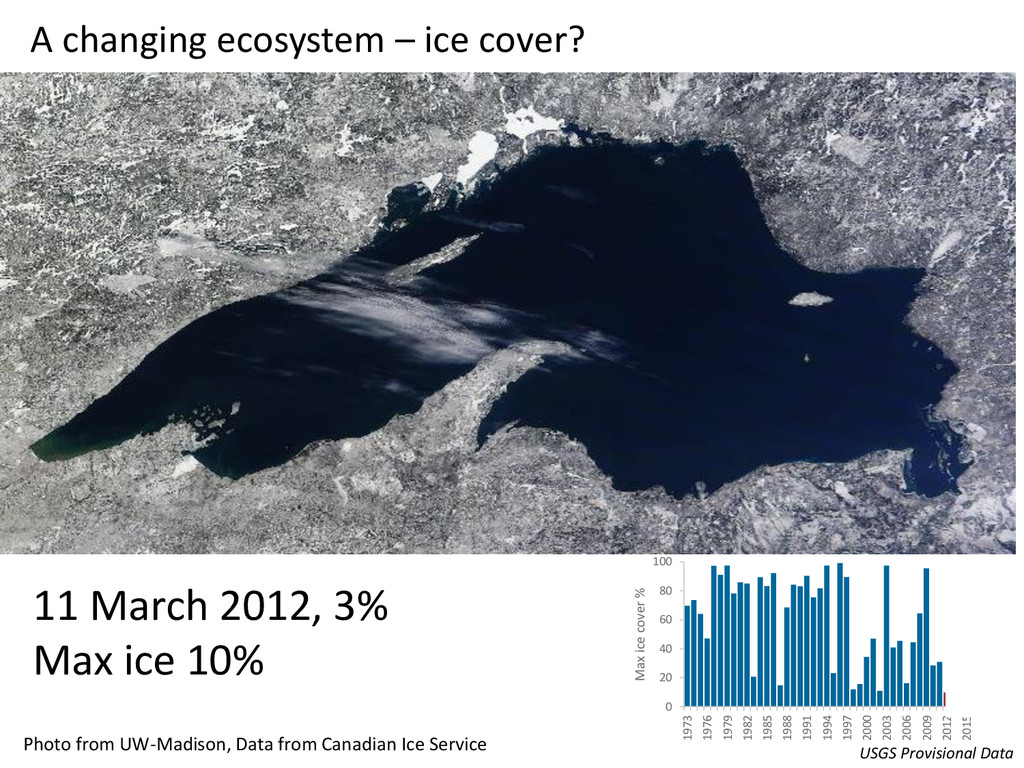
Max ice 10% 0 20 40 60 80 100 1973 1976 1979 1982 1985 1988 1991 1994 1997 2000 2003 2006 2009 2012 2015 Max ice cover % Photo from UW-Madison, Data from Canadian Ice Service USGS Provisional Data
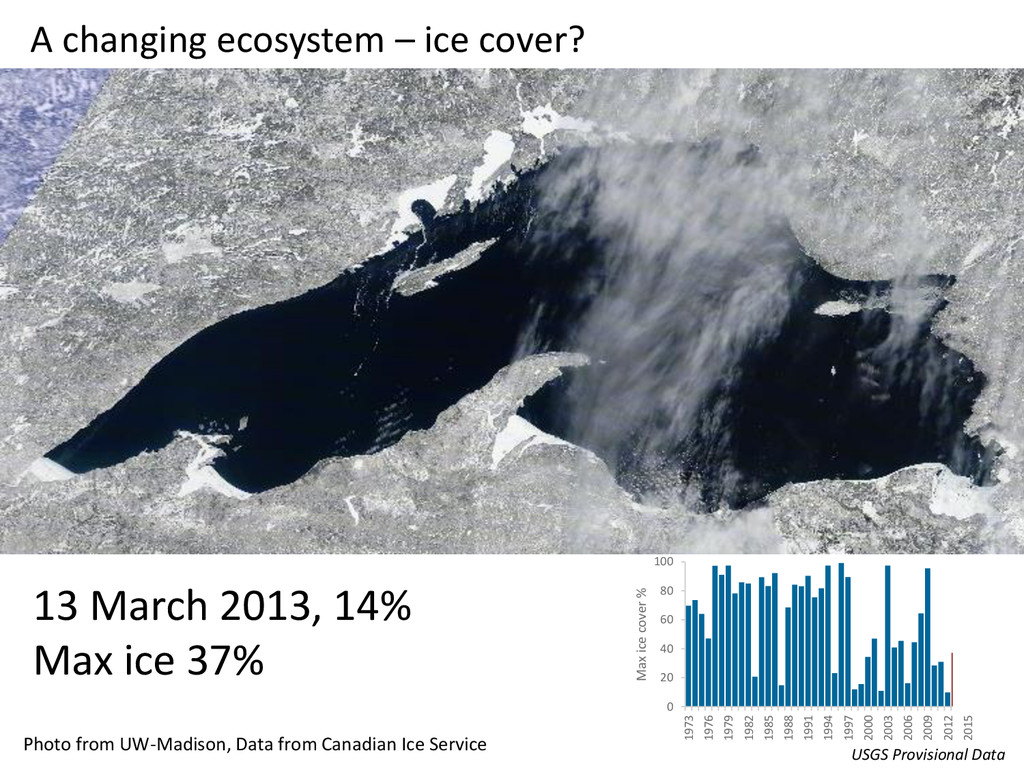
Max ice 37% 0 20 40 60 80 100 1973 1976 1979 1982 1985 1988 1991 1994 1997 2000 2003 2006 2009 2012 2015 Max ice cover % Photo from UW-Madison, Data from Canadian Ice Service USGS Provisional Data
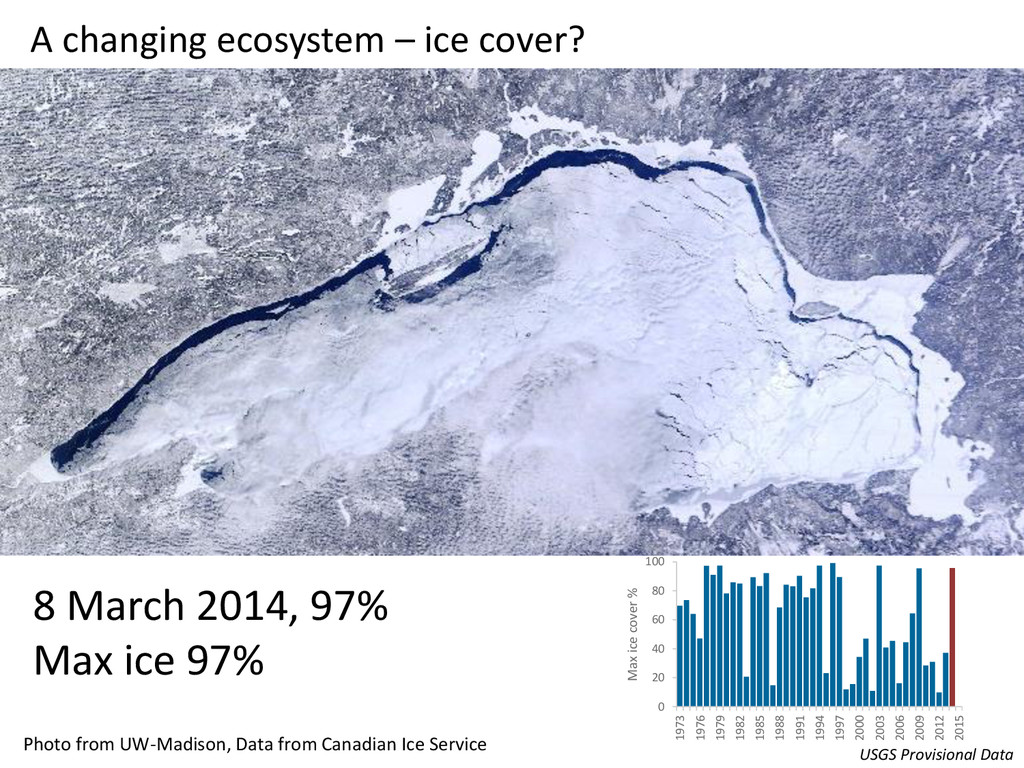
Max ice 97% 0 20 40 60 80 100 1973 1976 1979 1982 1985 1988 1991 1994 1997 2000 2003 2006 2009 2012 2015 Max ice cover % Photo from UW-Madison, Data from Canadian Ice Service USGS Provisional Data
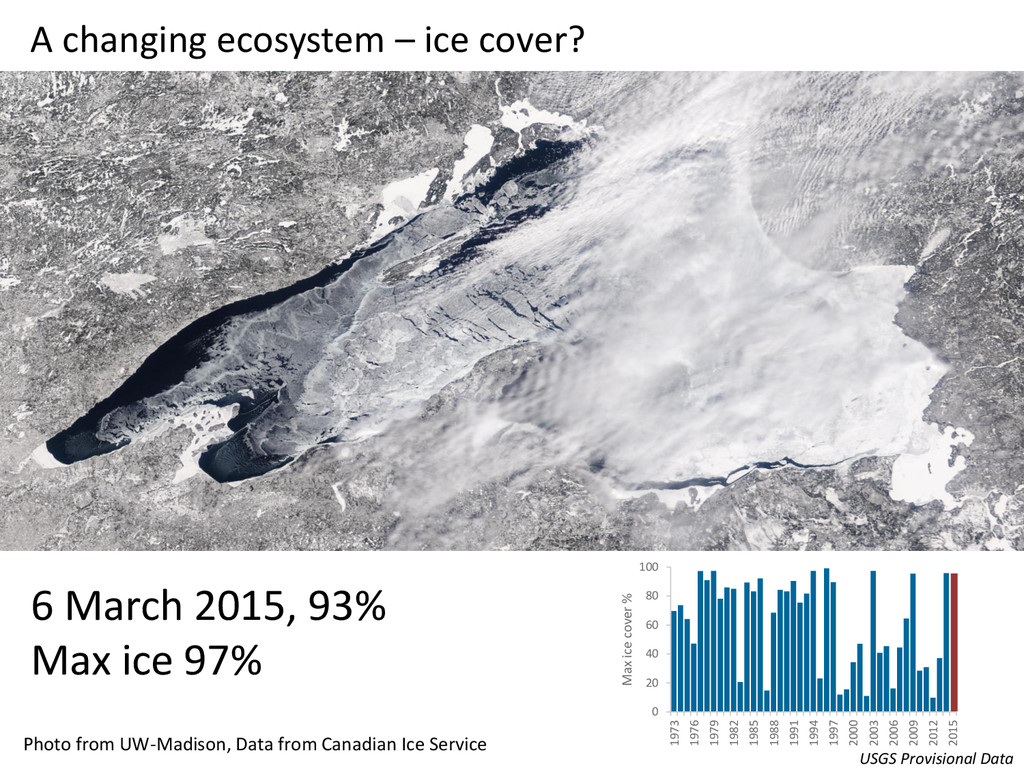
80 100 1973 1976 1979 1982 1985 1988 1991 1994 1997 2000 2003 2006 2009 2012 2015 Max ice cover % 6 March 2015, 93% Max ice 97% Photo from UW-Madison, Data from Canadian Ice Service USGS Provisional Data
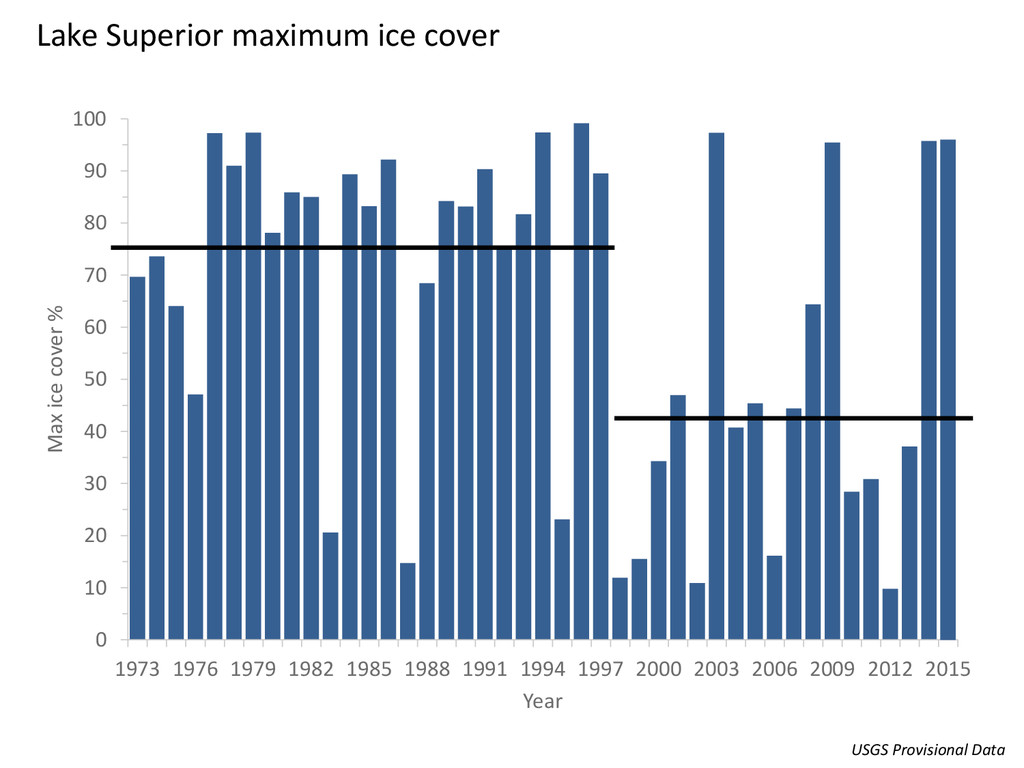
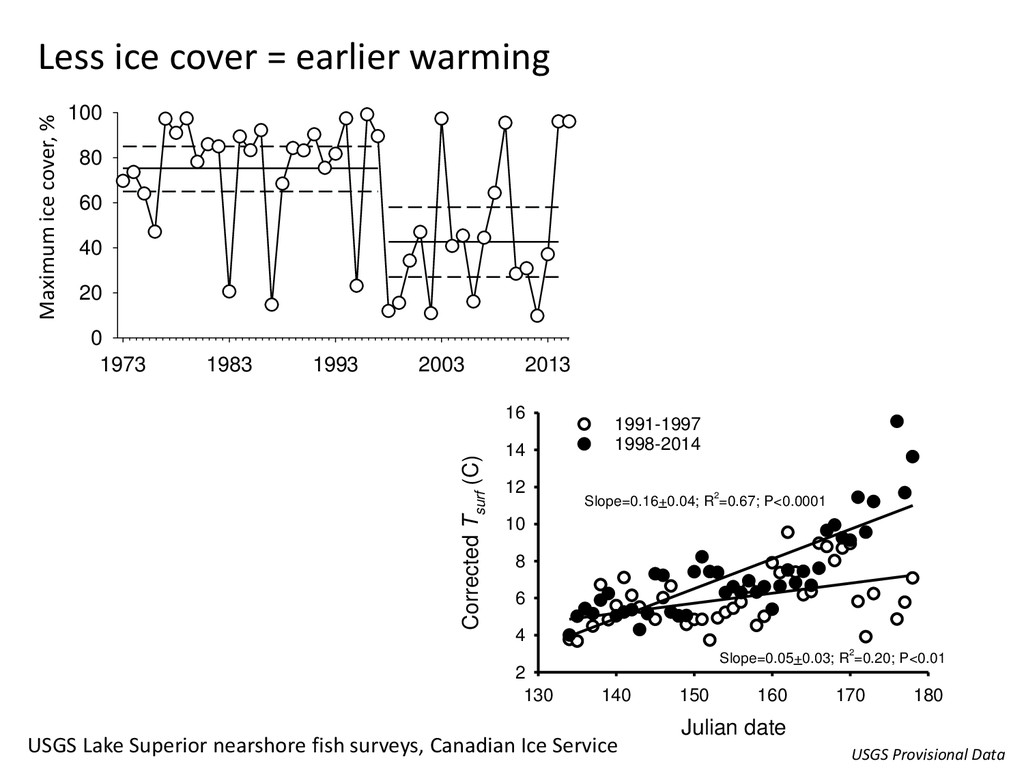
100 1973 1976 1979 1982 1985 1988 1991 1994 1997 2000 2003 2006 2009 2012 2015 Max ice cover % Year Lake Superior maximum ice cover USGS Provisional Data
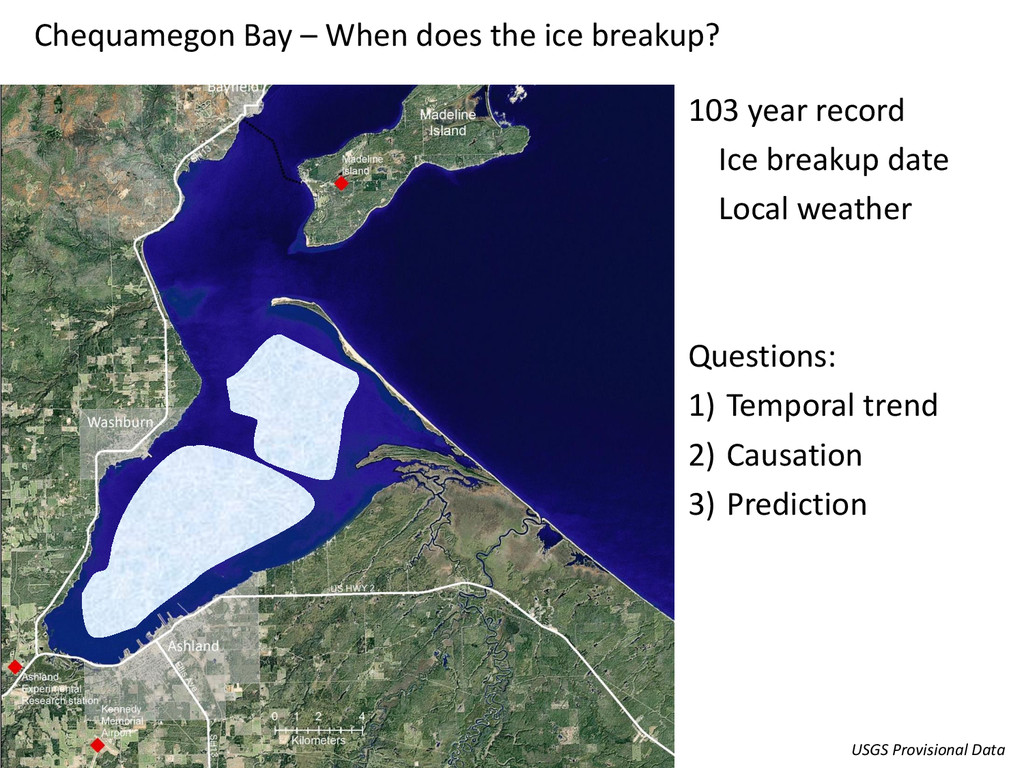
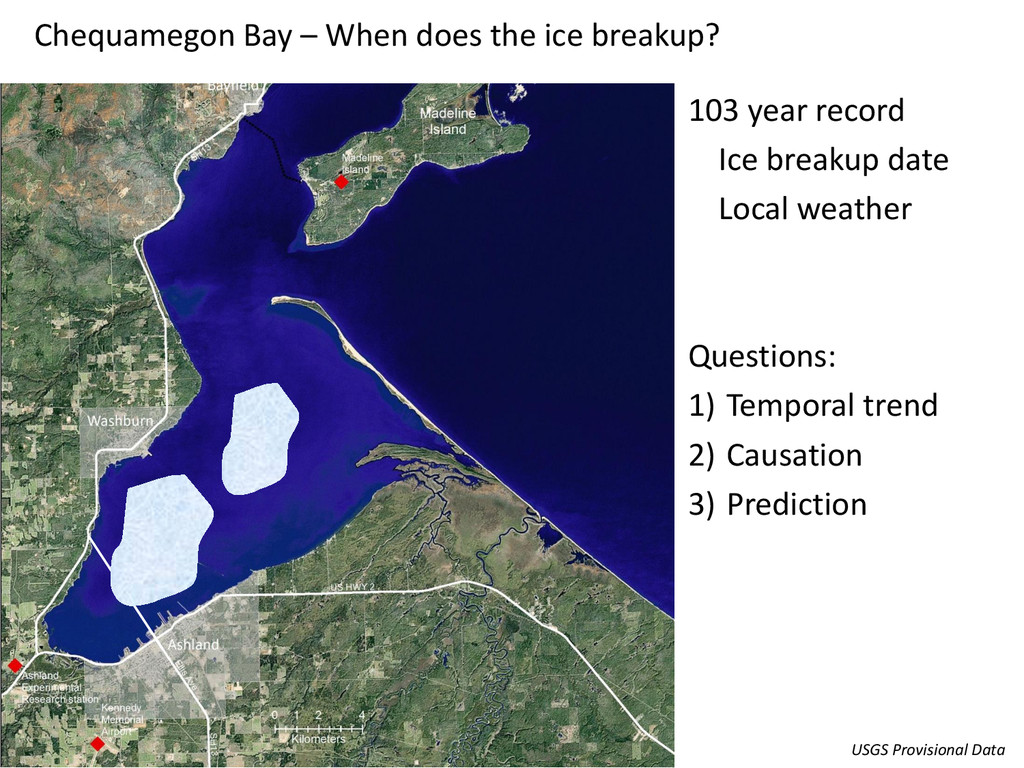
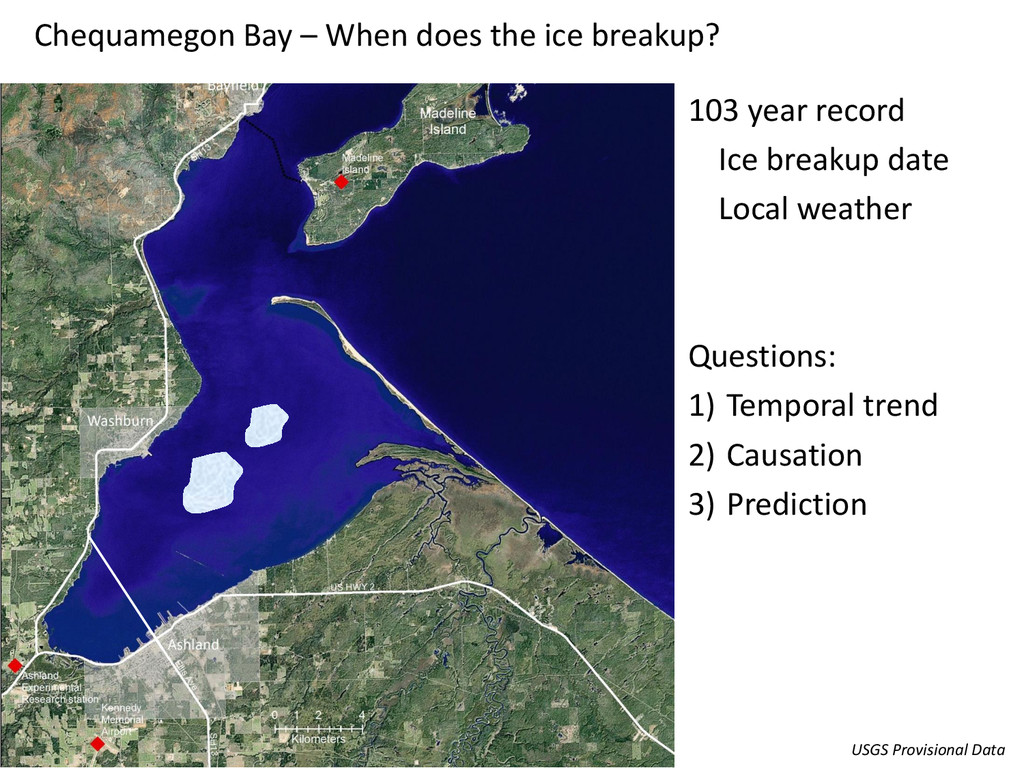
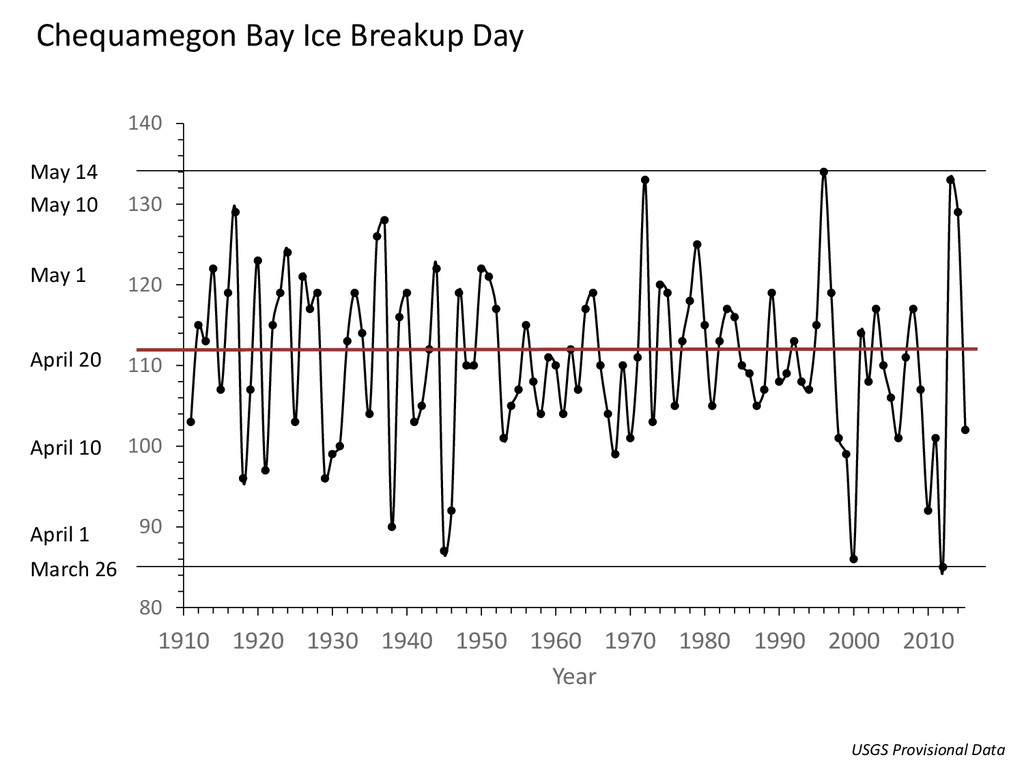
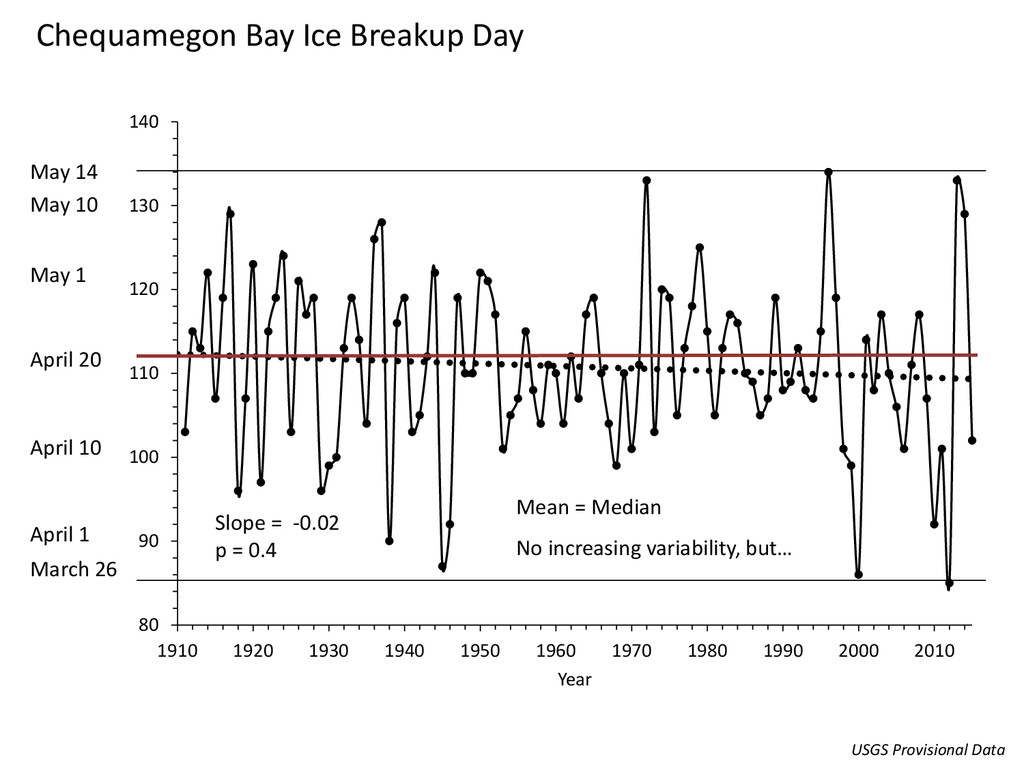
130 140 1910 1920 1930 1940 1950 1960 1970 1980 1990 2000 2010 Year April 10 April 20 May 1 May 10 April 1 March 26 May 14 Slope = -0.02 p = 0.4 Mean = Median No increasing variability, but… USGS Provisional Data
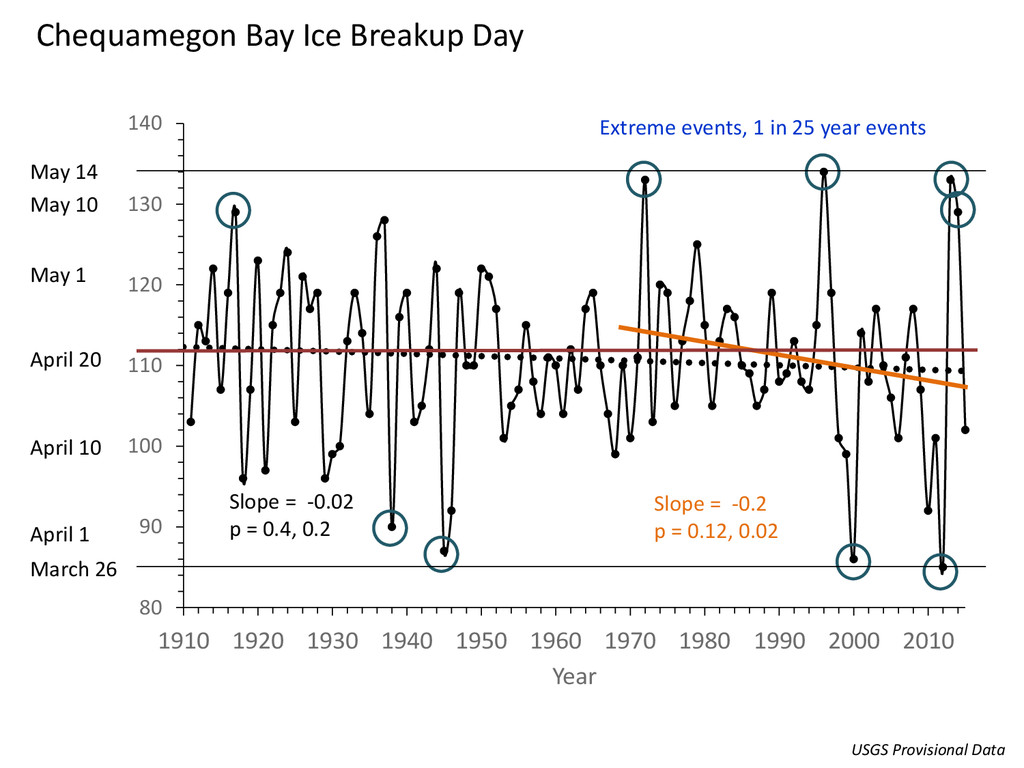
130 140 1910 1920 1930 1940 1950 1960 1970 1980 1990 2000 2010 Year Slope = -0.02 p = 0.4, 0.2 Slope = -0.2 p = 0.12, 0.02 Extreme events, 1 in 25 year events April 10 April 20 May 1 May 10 April 1 March 26 May 14 USGS Provisional Data
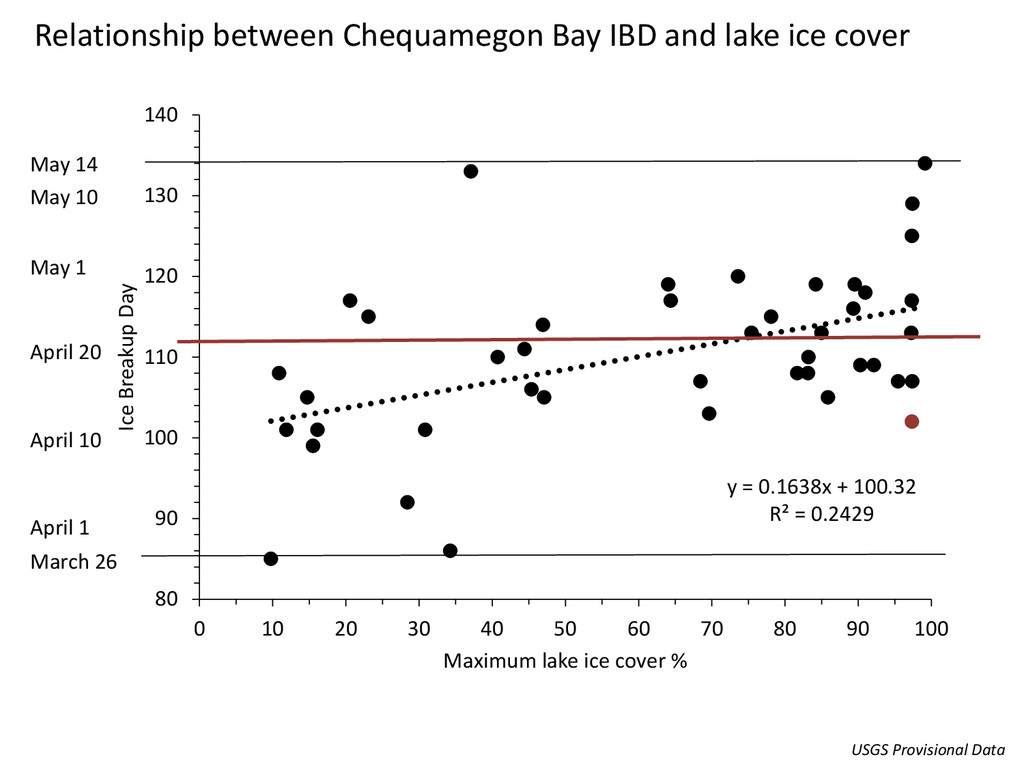
= 0.1638x + 100.32 R² = 0.2429 80 90 100 110 120 130 140 0 10 20 30 40 50 60 70 80 90 100 Ice Breakup Day Maximum lake ice cover % April 10 April 20 May 1 May 10 April 1 March 26 May 14 USGS Provisional Data
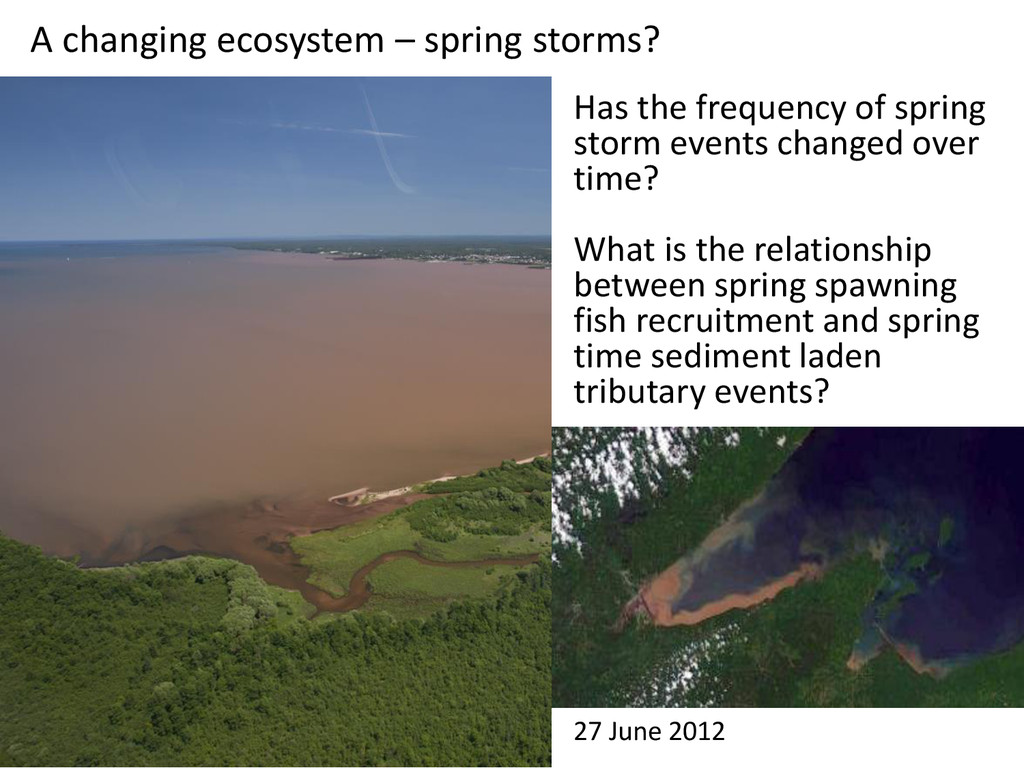
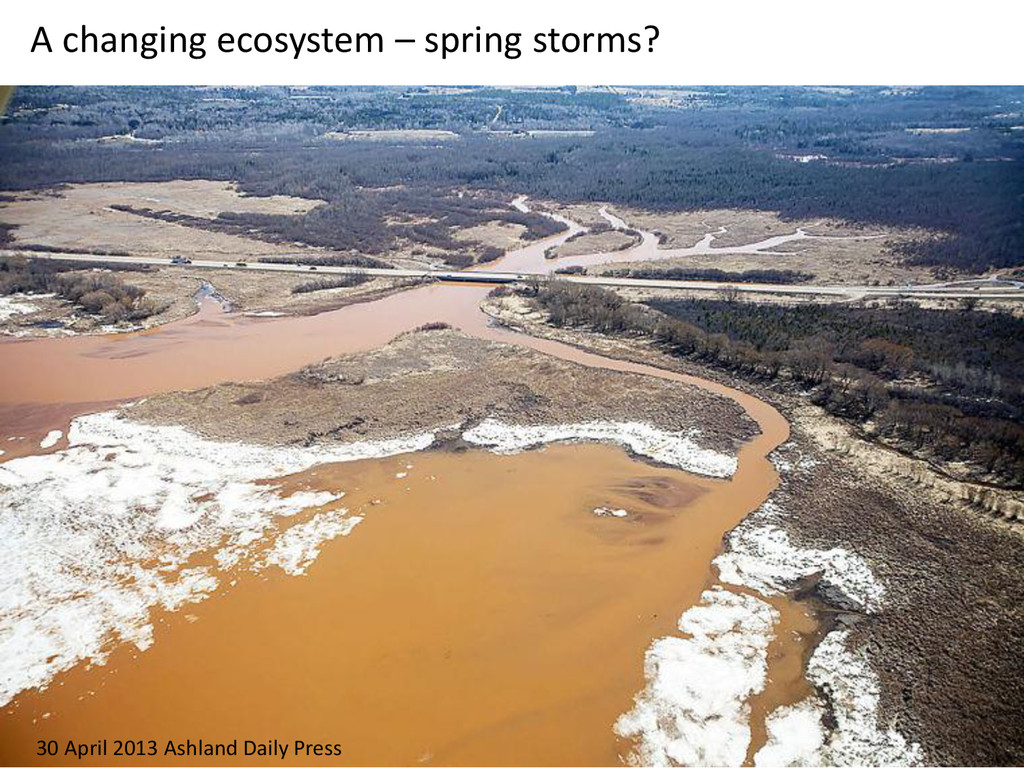
the frequency of spring storm events changed over time? What is the relationship between spring spawning fish recruitment and spring time sediment laden tributary events?