Water quality conditions and food web structure in Chequamegon Bay
Joel Hoffman, US Environmental Protection Agency Mid-Continental Ecology Division, Duluth, MN
Presentation at the Chequamegon Bay Research Symposium, April 14, 2015
can be masked by a collage strip of one, two or three images. The photo image area is located 3.19” from left and 3.81” from top of page. Each image used in collage should be reduced or cropped to a maximum of 2” high, stroked with a 1.5 pt white frame and positioned edge-to-edge with accompanying images. Joel C Hoffman*, John R Kelly, Greg S Peterson, Anne M. Cotter, Matthew A. Starry, Michael E. Sierszen Water quality conditions and food web structure in Chequamegon Bay Office of Research and Development National Health and Environmental Effects Research Lab Chequamegon Bay Symposium April 14, 2015
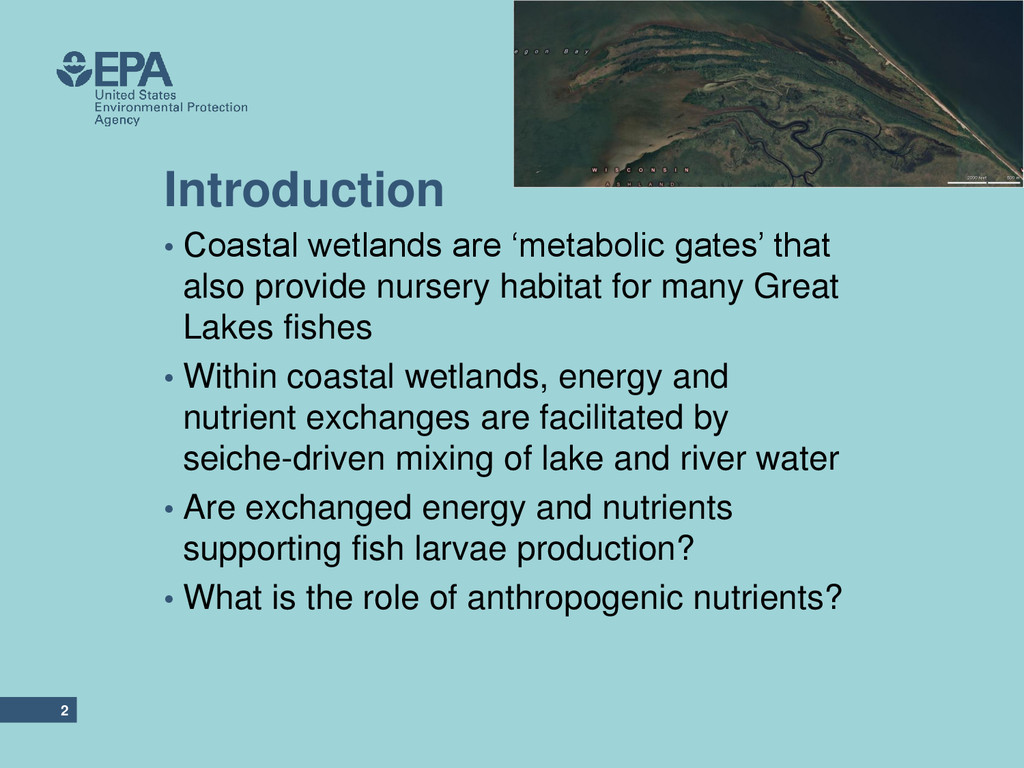
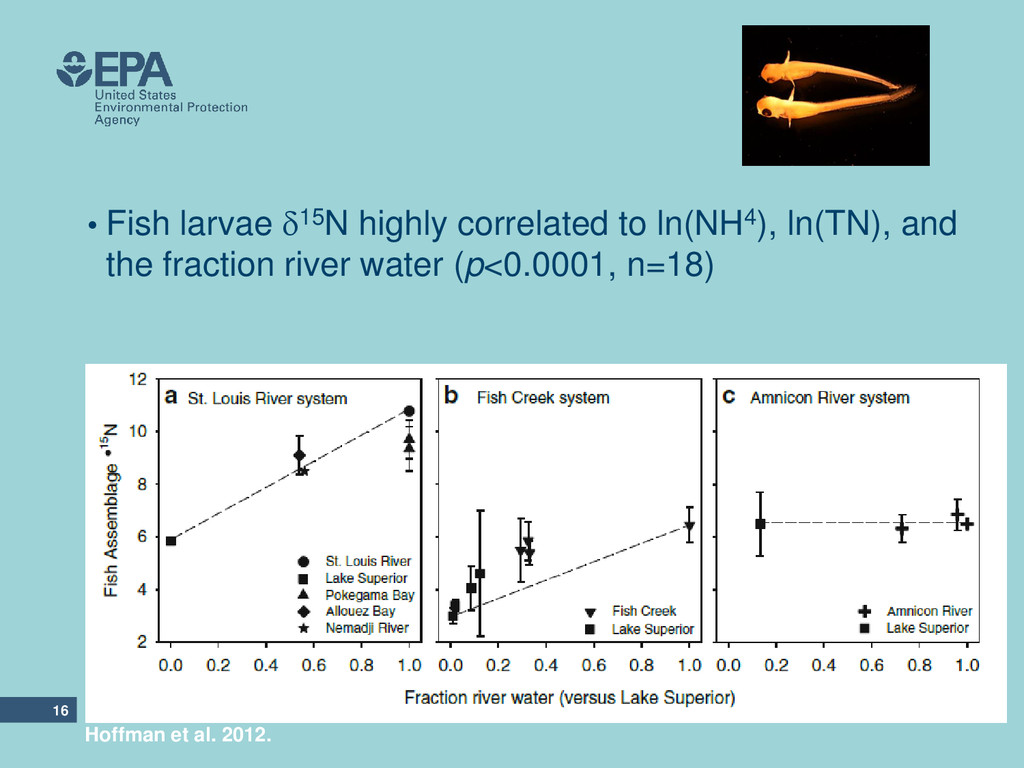
provide nursery habitat for many Great Lakes fishes • Within coastal wetlands, energy and nutrient exchanges are facilitated by seiche-driven mixing of lake and river water • Are exchanged energy and nutrients supporting fish larvae production? • What is the role of anthropogenic nutrients?
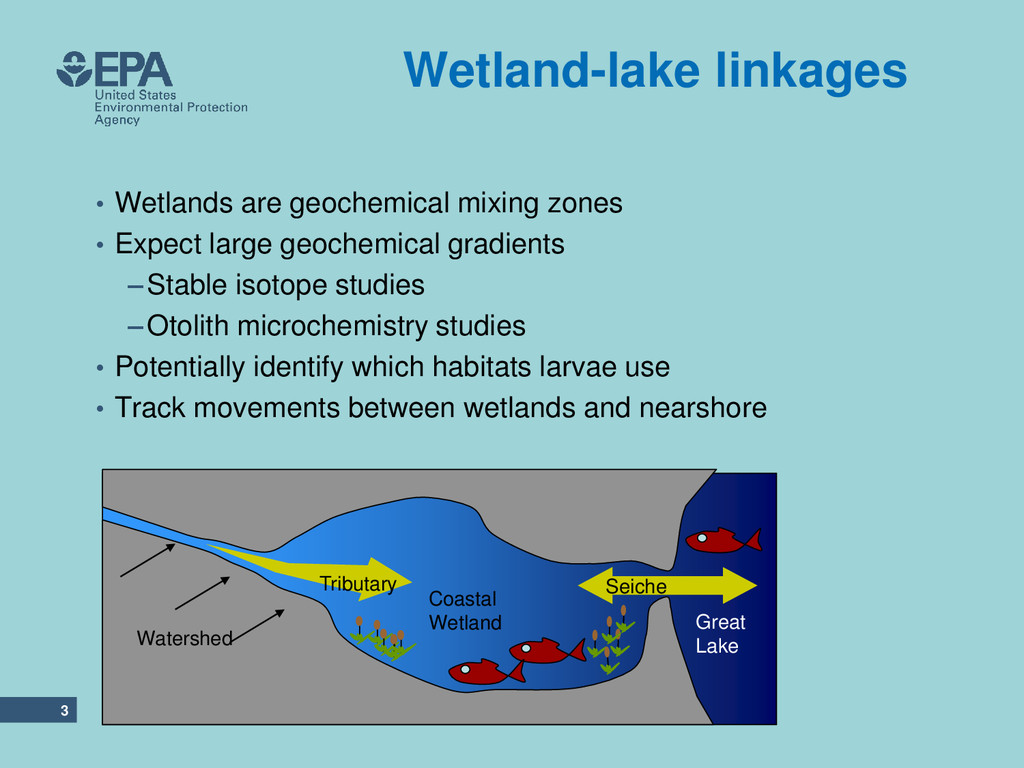
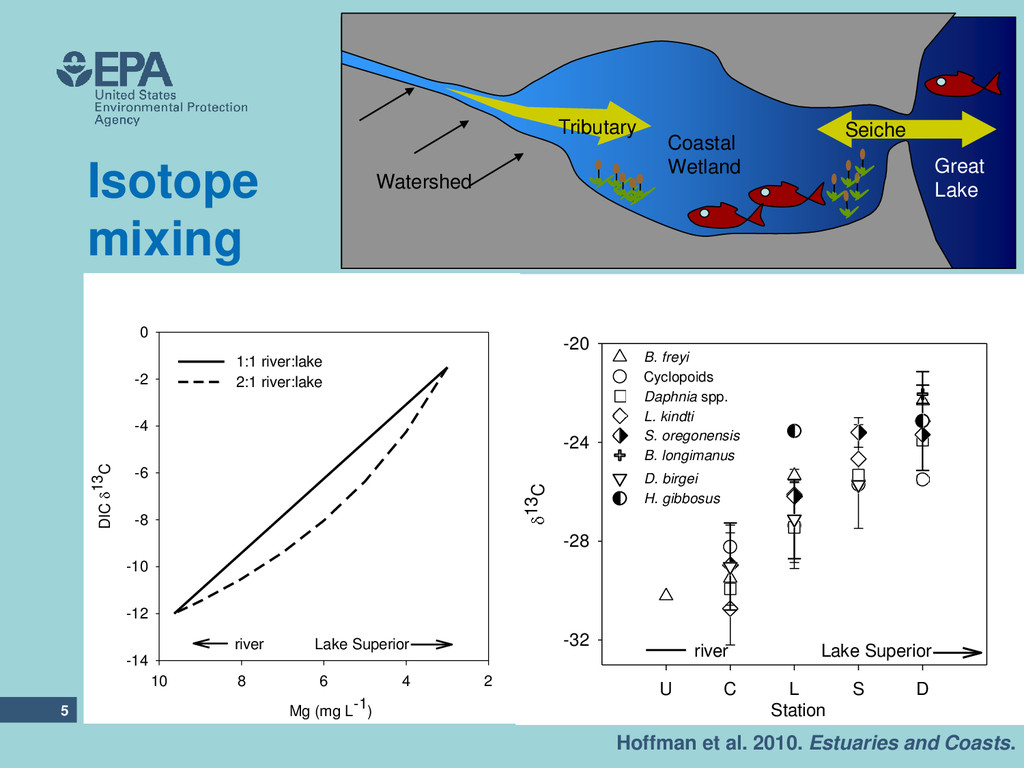
large geochemical gradients –Stable isotope studies –Otolith microchemistry studies • Potentially identify which habitats larvae use • Track movements between wetlands and nearshore 3 Seiche Tributary Watershed Great Lake Coastal Wetland
Station U C L S D 13C -32 -28 -24 -20 B. freyi Cyclopoids Daphnia spp. L. kindti S. oregonensis B. longimanus D. birgei H. gibbosus Lake Superior river Seiche Tributary Watershed Great Lake Coastal Wetland Mg (mg L-1) 2 4 6 8 10 DIC 13 C -14 -12 -10 -8 -6 -4 -2 0 1:1 river:lake 2:1 river:lake Lake Superior river
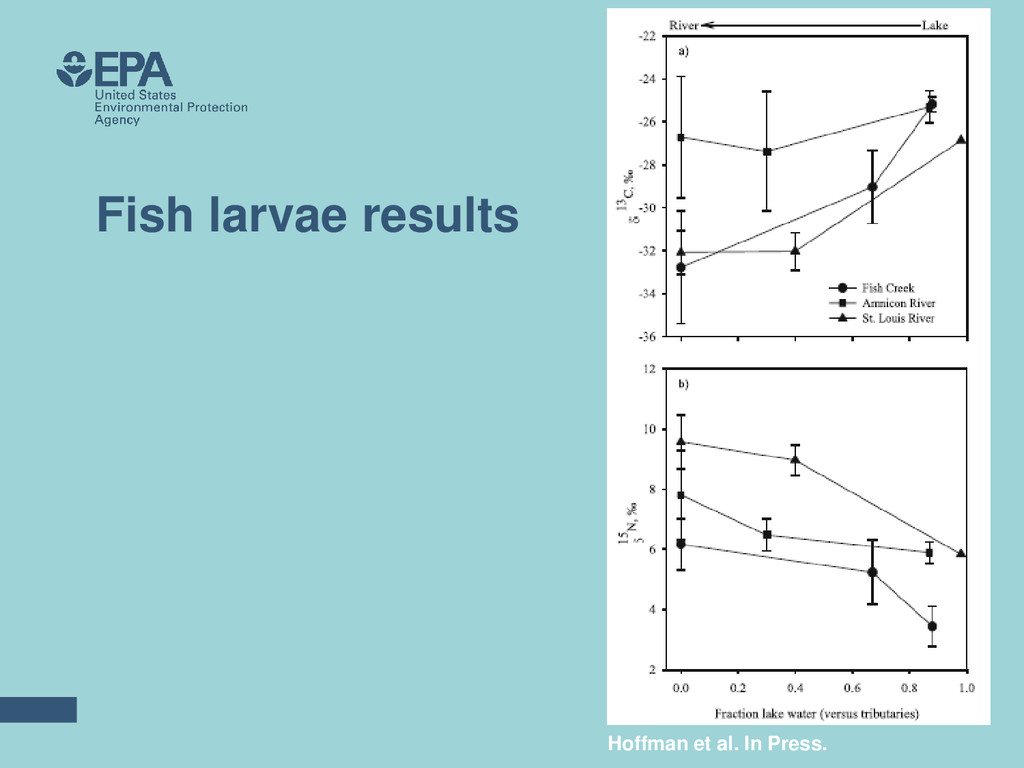
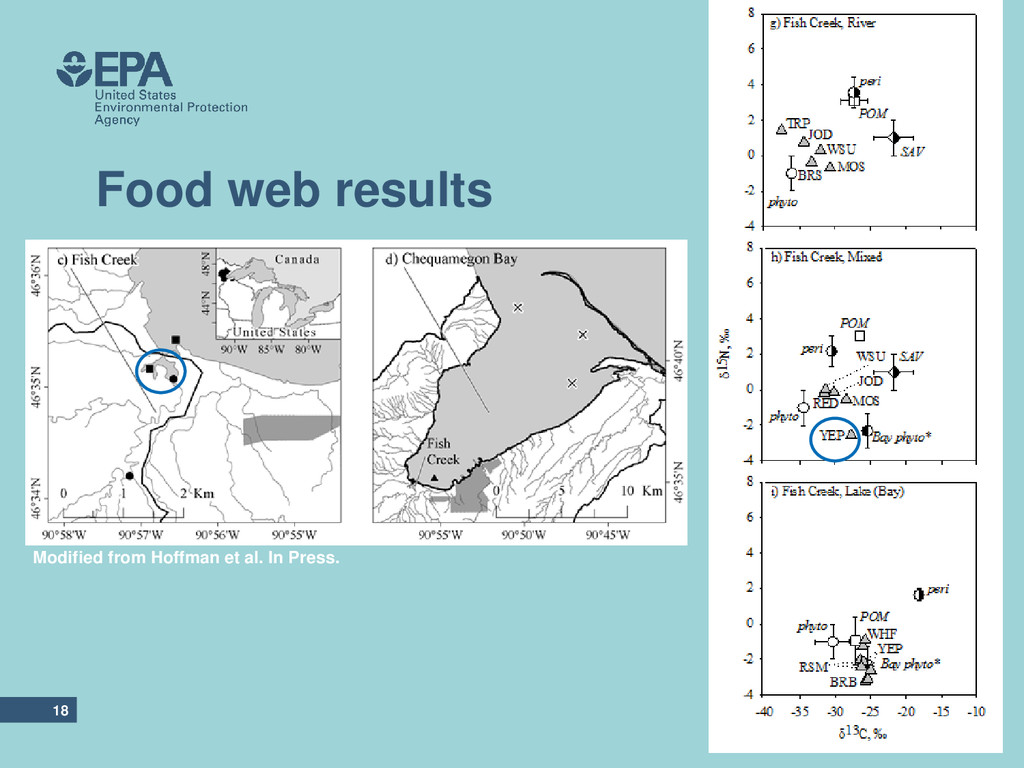
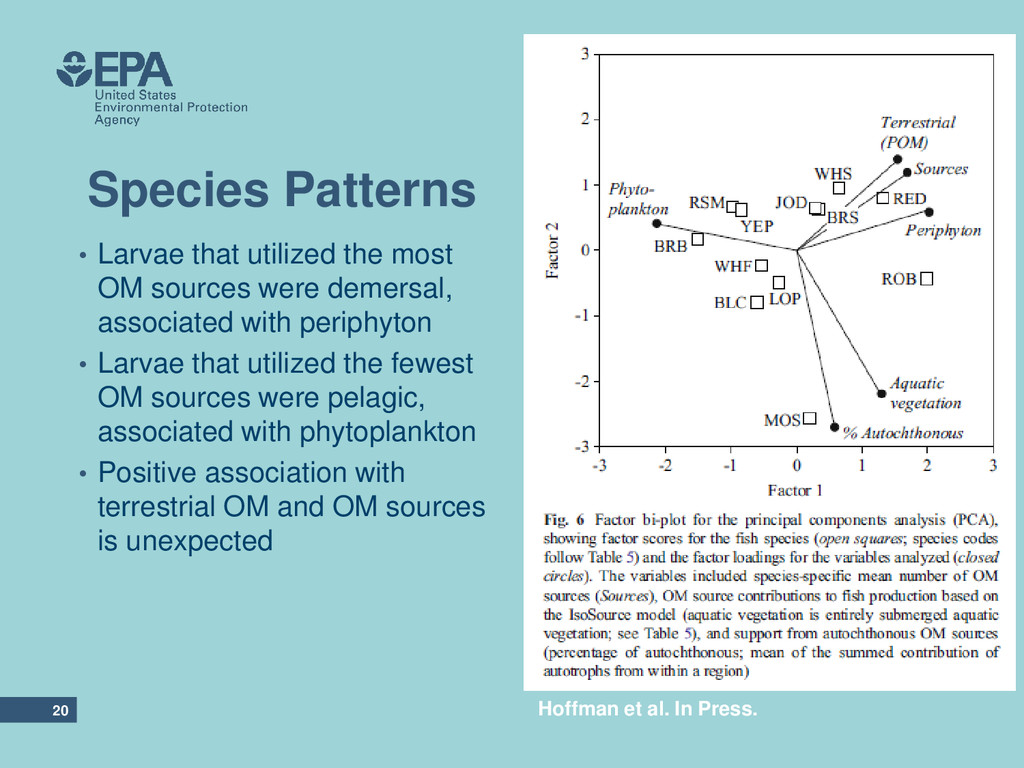
were demersal, associated with periphyton • Larvae that utilized the fewest OM sources were pelagic, associated with phytoplankton • Positive association with terrestrial OM and OM sources is unexpected Hoffman et al. In Press. 20
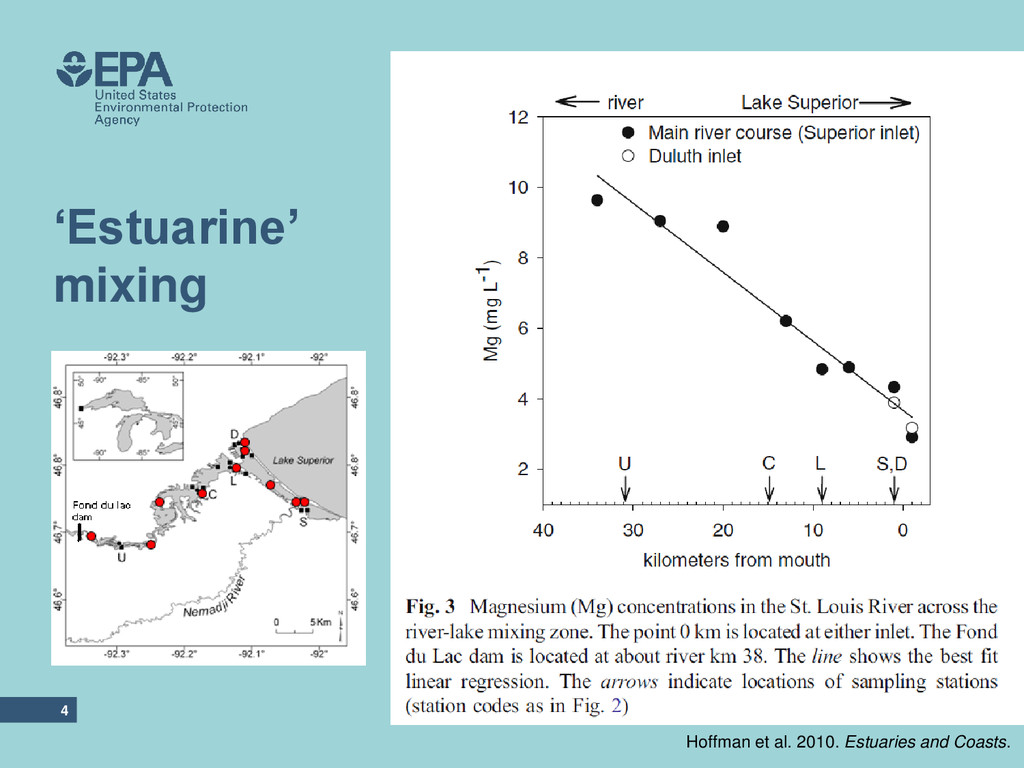
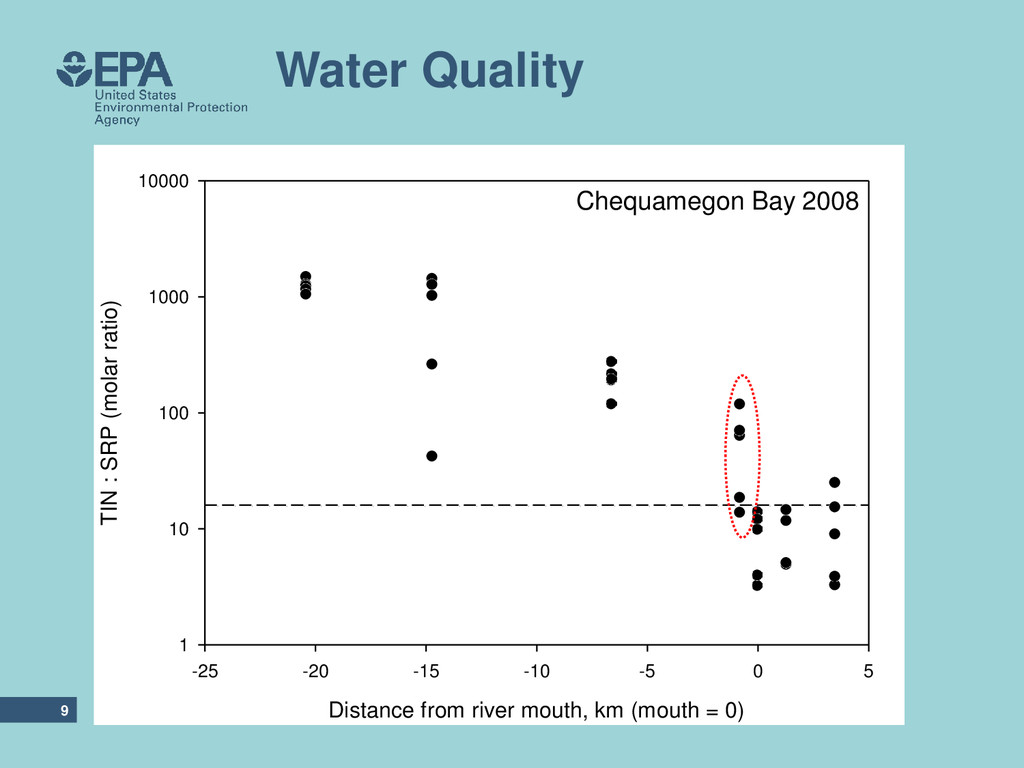
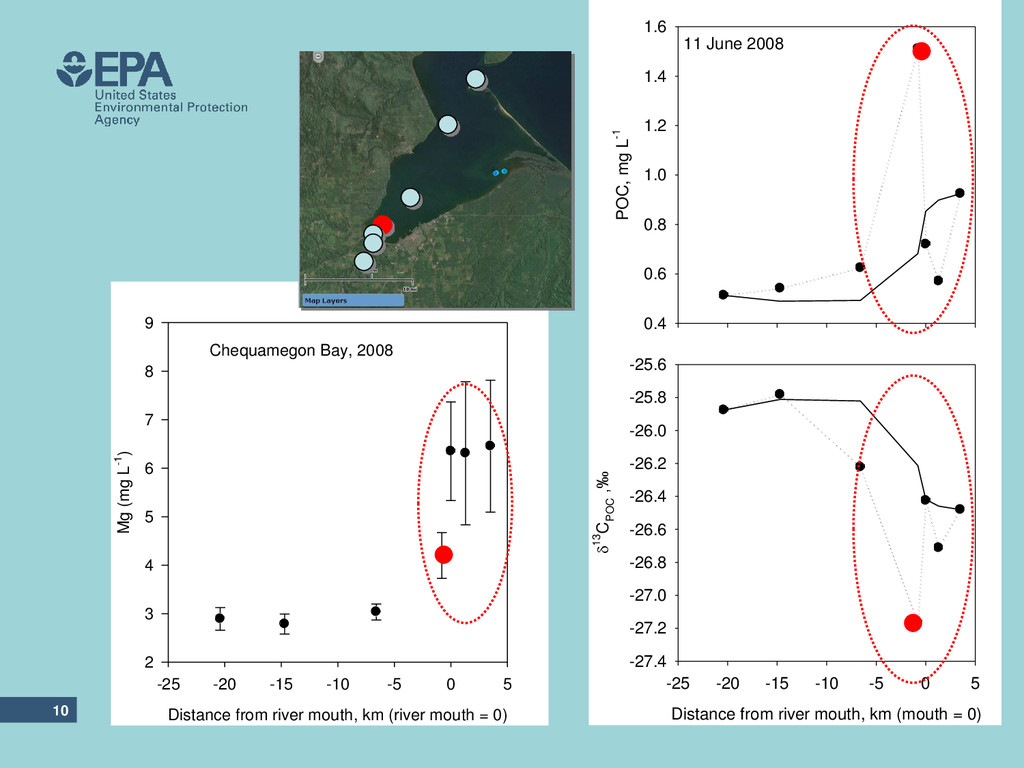
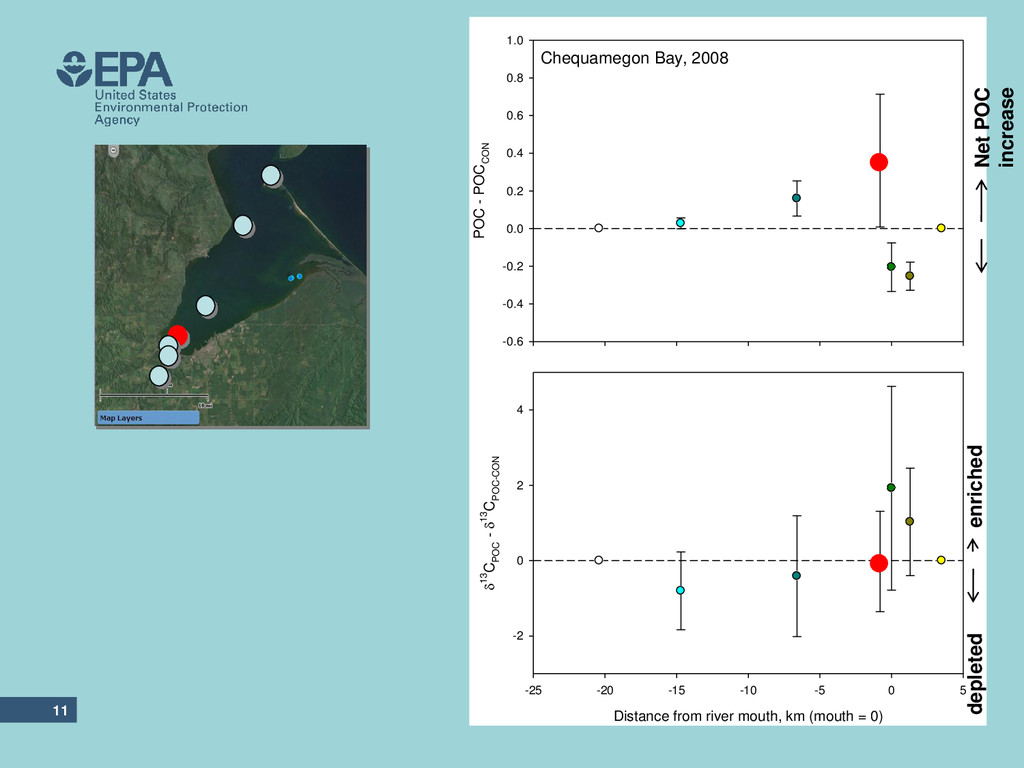
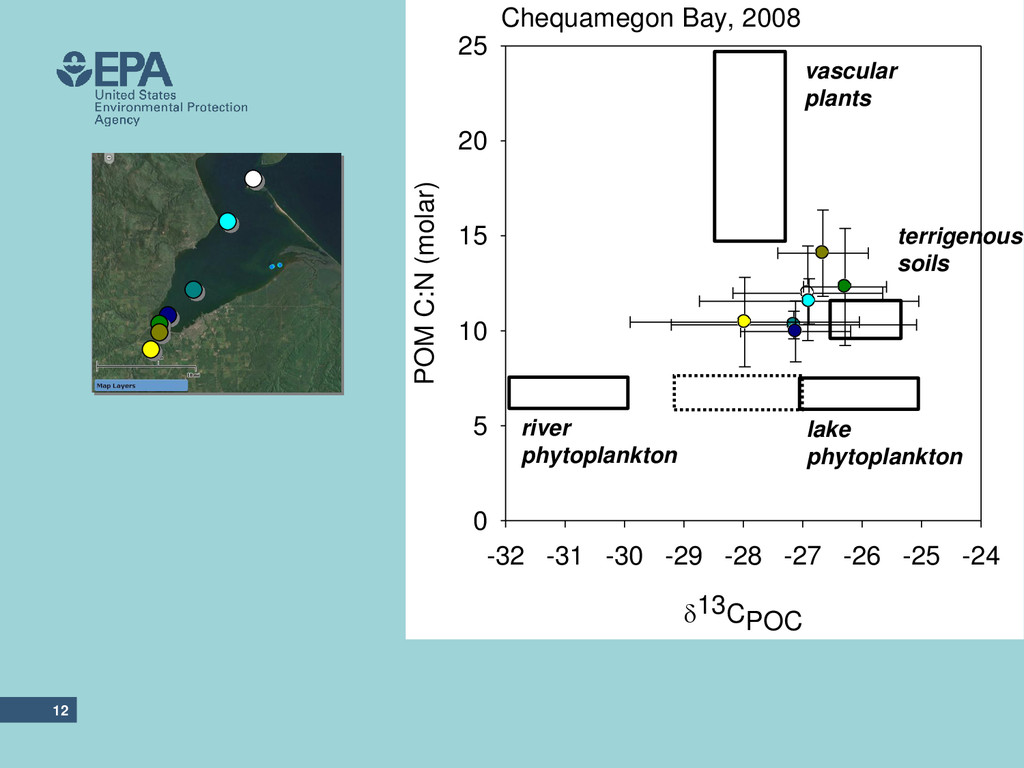
need a conservative tracer: •Identify nutrient sources and sinks •Characterize POM sources •Explain underlying stable isotope gradients •Evidence for energy and nutrient exchange between lake and river in mixing zones •Lake-river mixing may establish productive region of N-P co-limitation
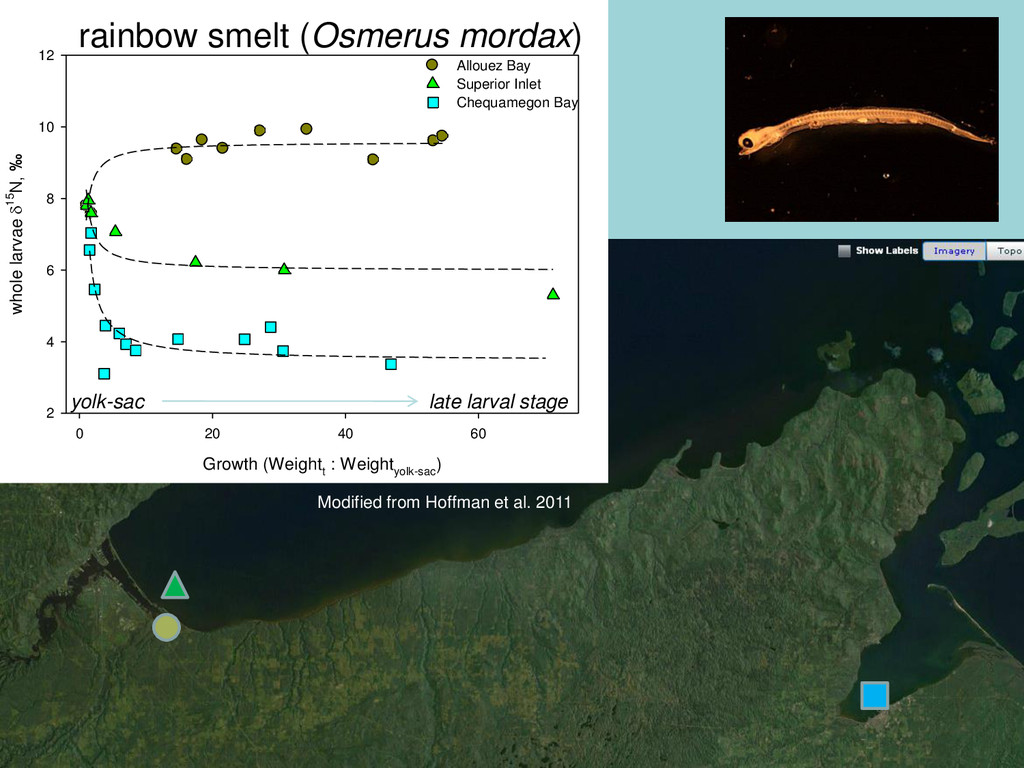
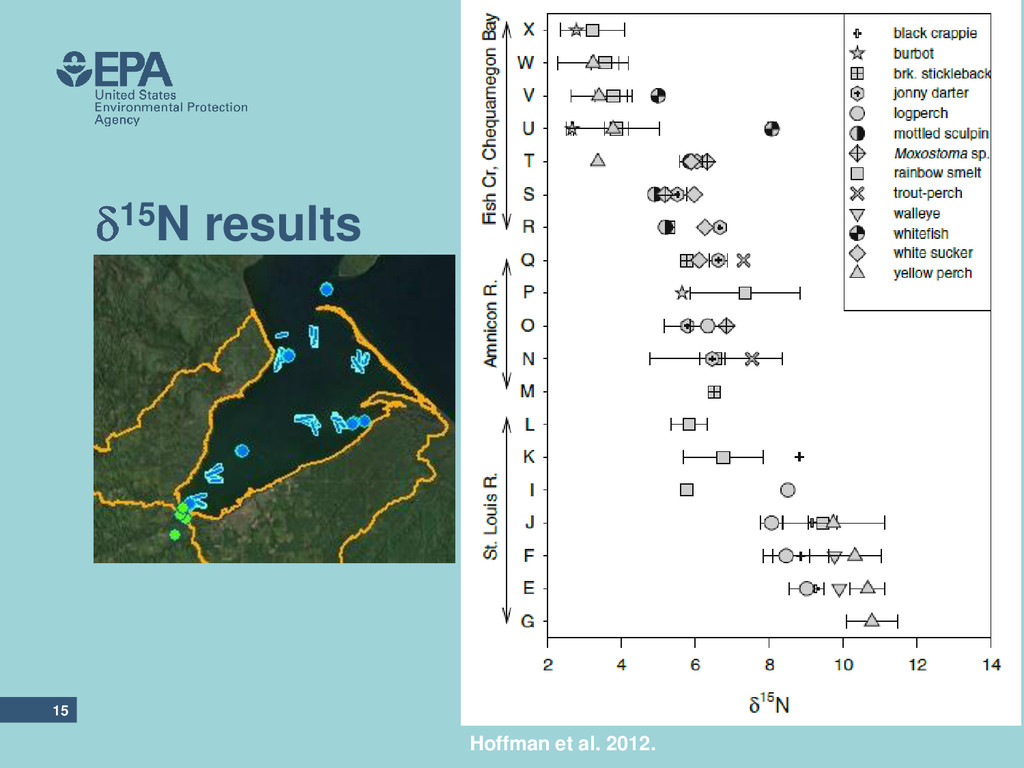
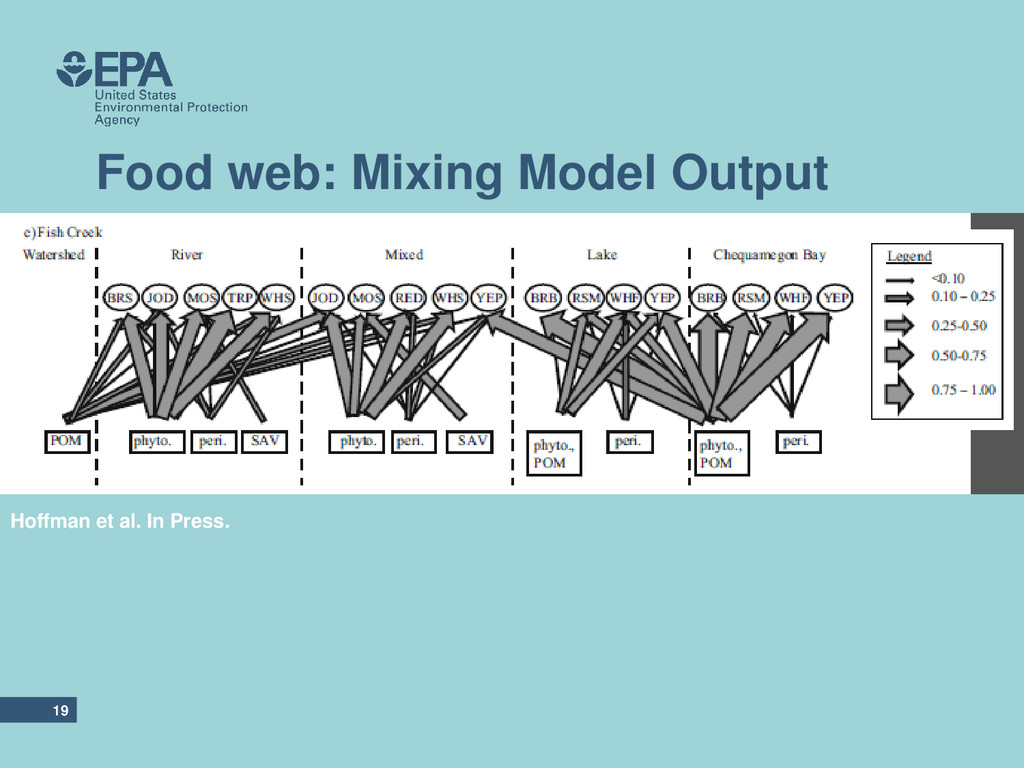
from multiple OM sources; most obtained some energy originating outside the region where they were collected •PCA revealed that the number of OM sources was positively correlated with terrestrial OM contribution and greatest in demersal fish larvae captured in the mixed region •These coastal habitats function as a “mosaic”, wherein both adjacent and distant habitats and ecosystems contribute to fish growth during a critical life stage