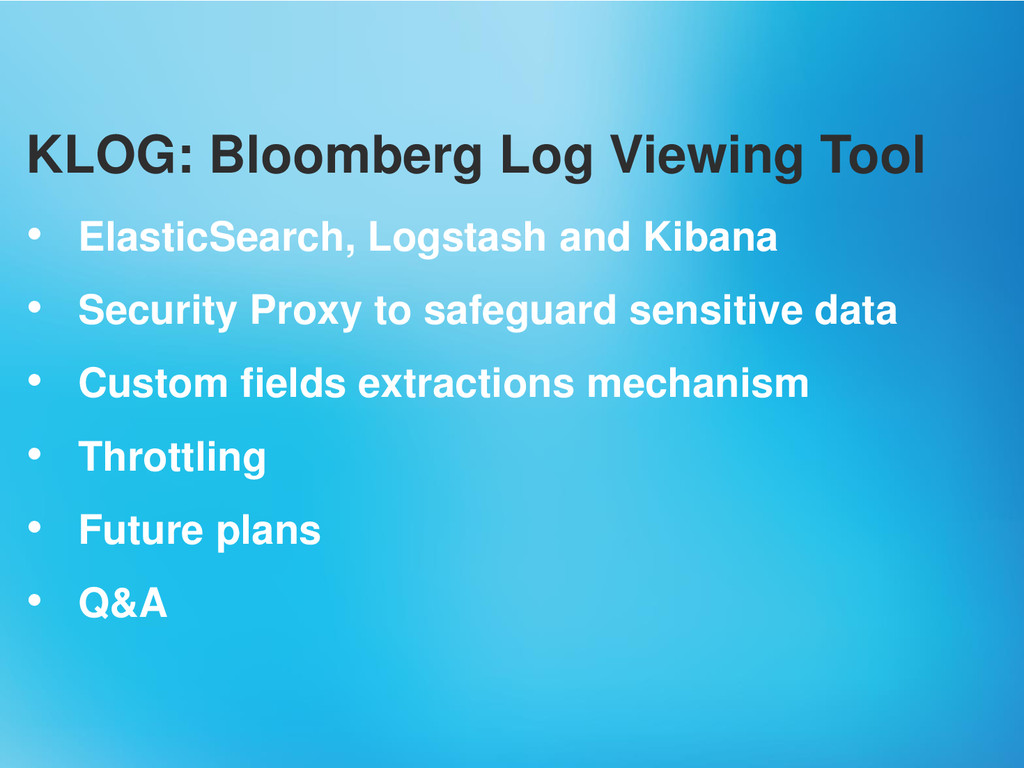
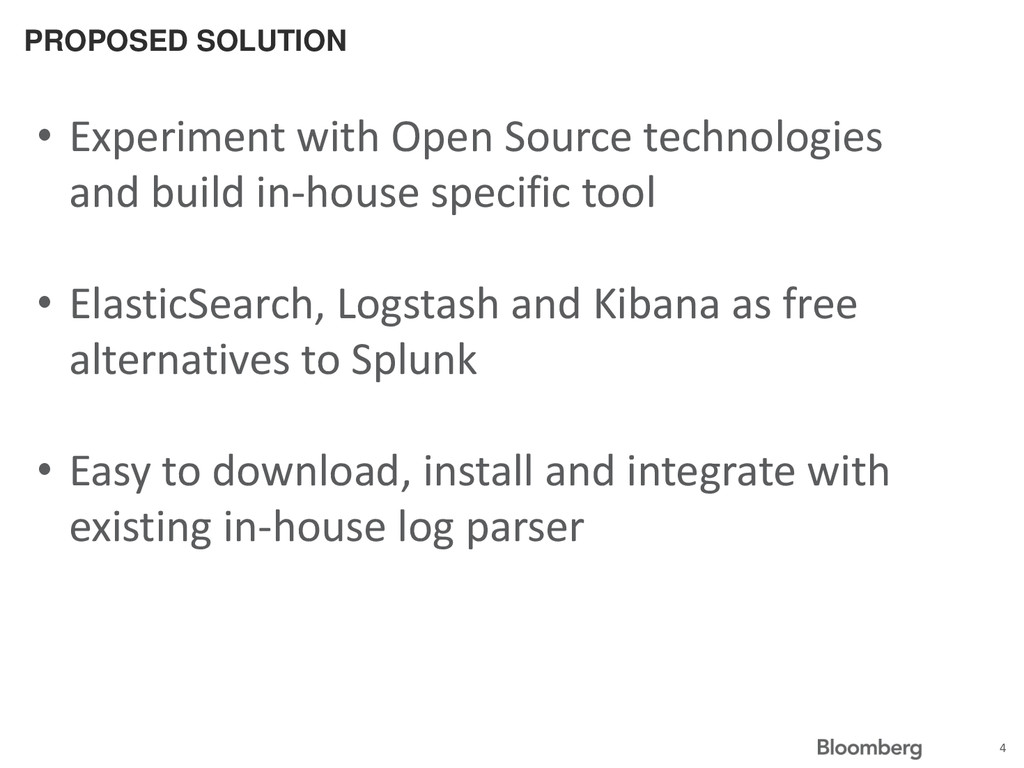
required to inspect log files to troubleshoot issues • No in-house tool to view and search through production log files • Splunk is very powerful, but very costly 3
and build in-house specific tool • ElasticSearch, Logstash and Kibana as free alternatives to Splunk • Easy to download, install and integrate with existing in-house log parser 4
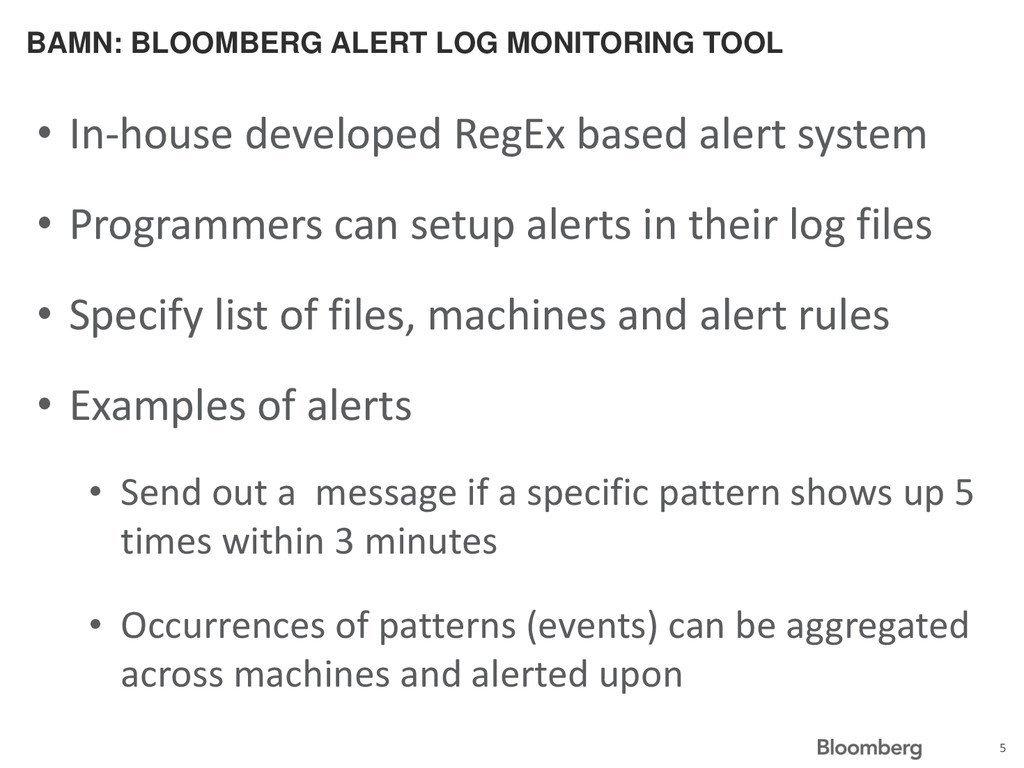
developed RegEx based alert system • Programmers can setup alerts in their log files • Specify list of files, machines and alert rules • Examples of alerts • Send out a message if a specific pattern shows up 5 times within 3 minutes • Occurrences of patterns (events) can be aggregated across machines and alerted upon 5
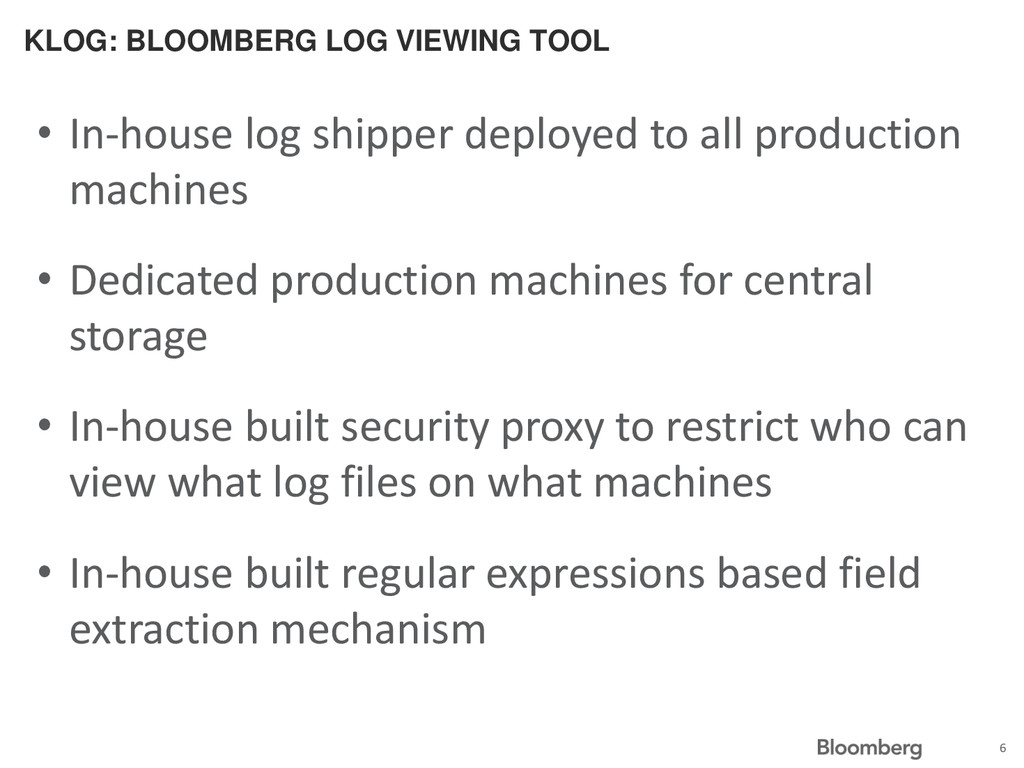
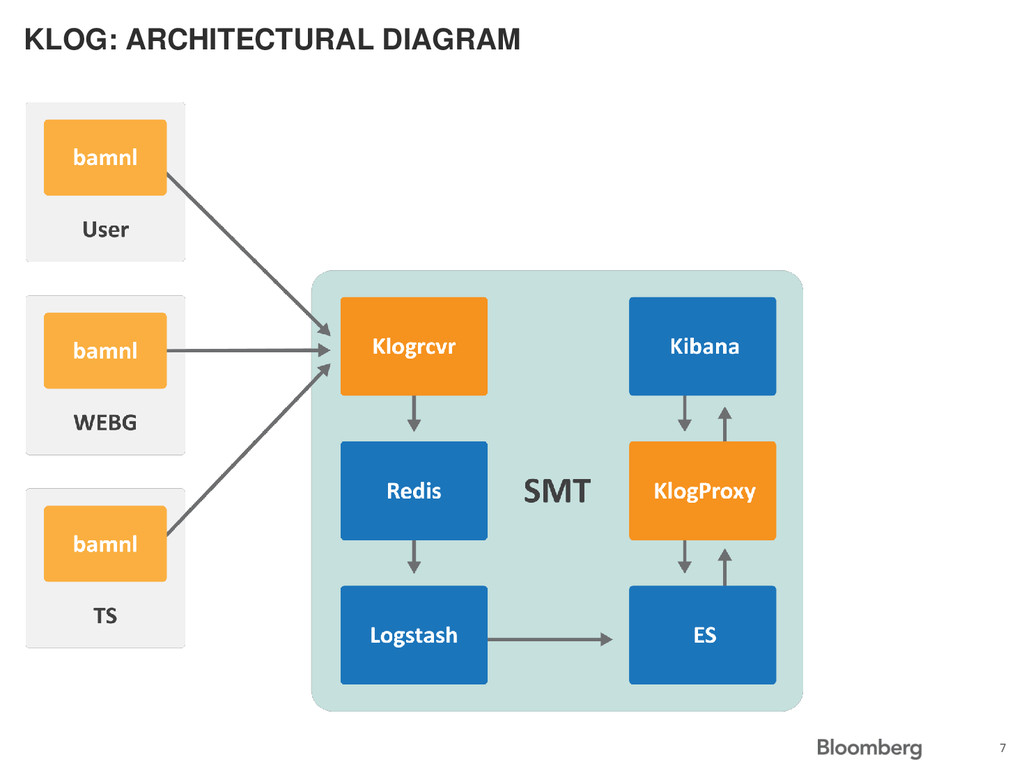
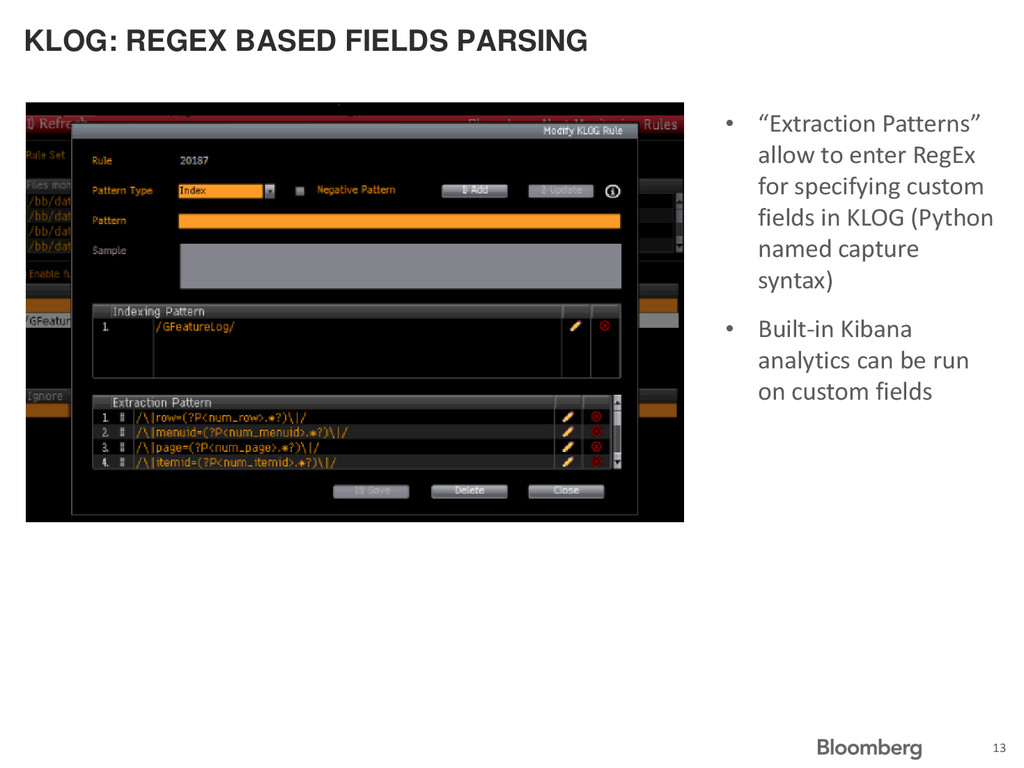
shipper deployed to all production machines • Dedicated production machines for central storage • In-house built security proxy to restrict who can view what log files on what machines • In-house built regular expressions based field extraction mechanism 6
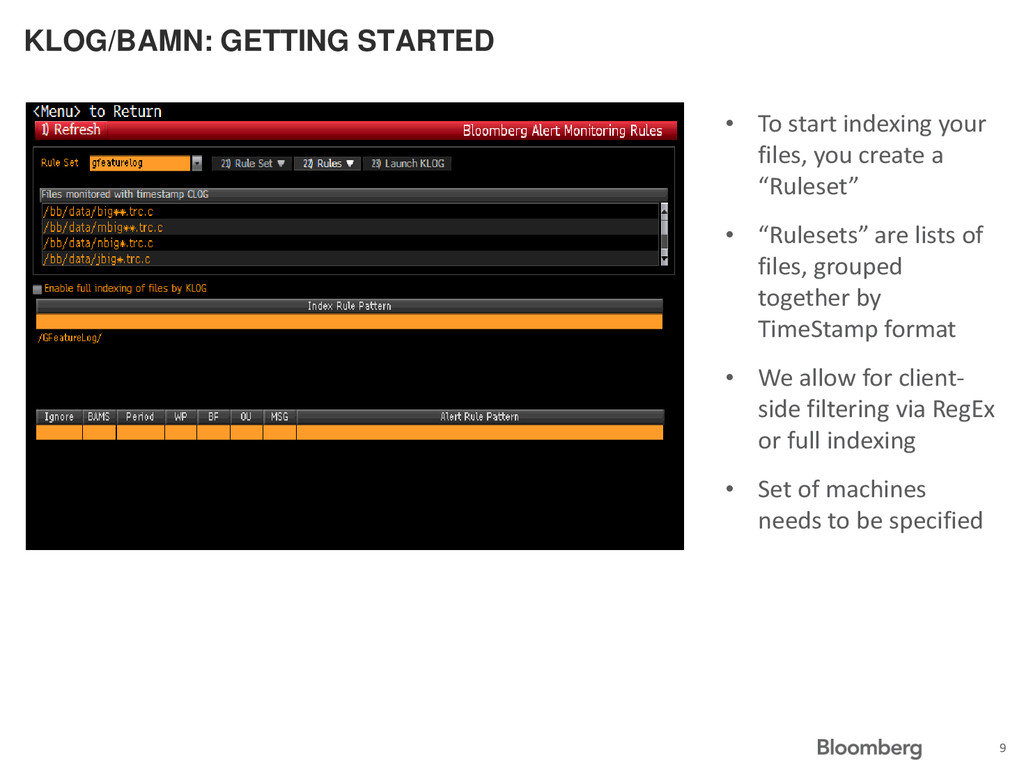
files, you create a “Ruleset” • “Rulesets” are lists of files, grouped together by TimeStamp format • We allow for client- side filtering via RegEx or full indexing • Set of machines needs to be specified 9
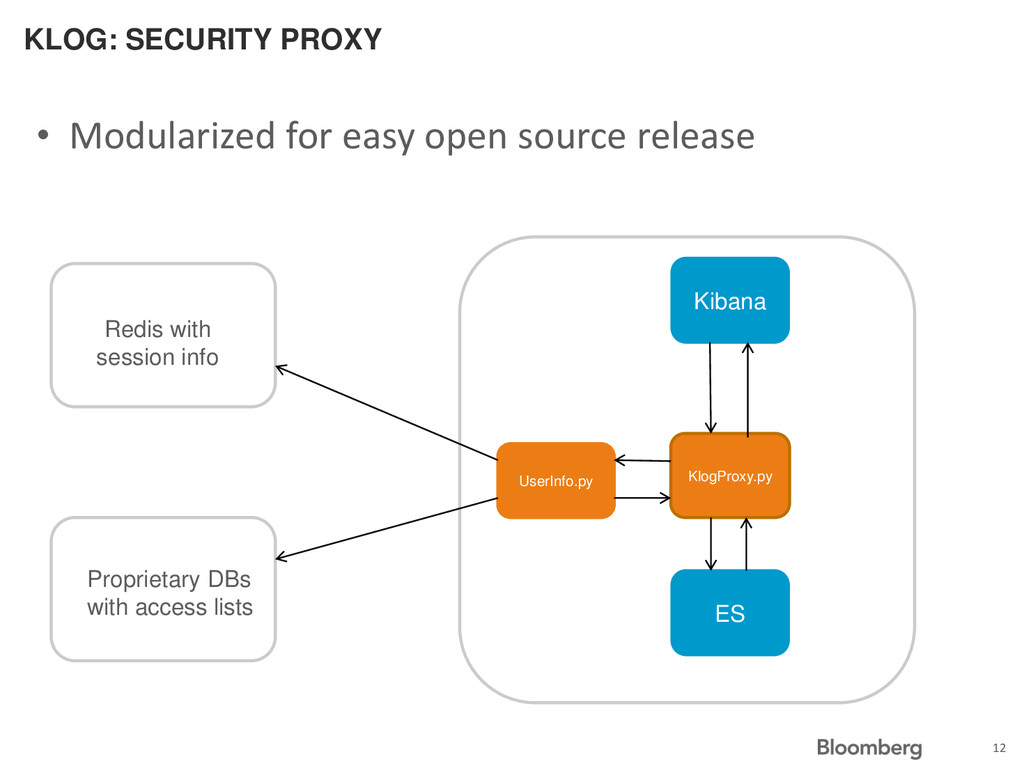
tagged with “Ruleset” name of file it belongs to • Each “Ruleset” has list of “Authorized Users” • The Python program “KlogProxy” resides between ElasticSearch and Kibana • Makes sure the current user (authenticated by OpenId) is on the list of “Authorized Users” for returned log lines 10
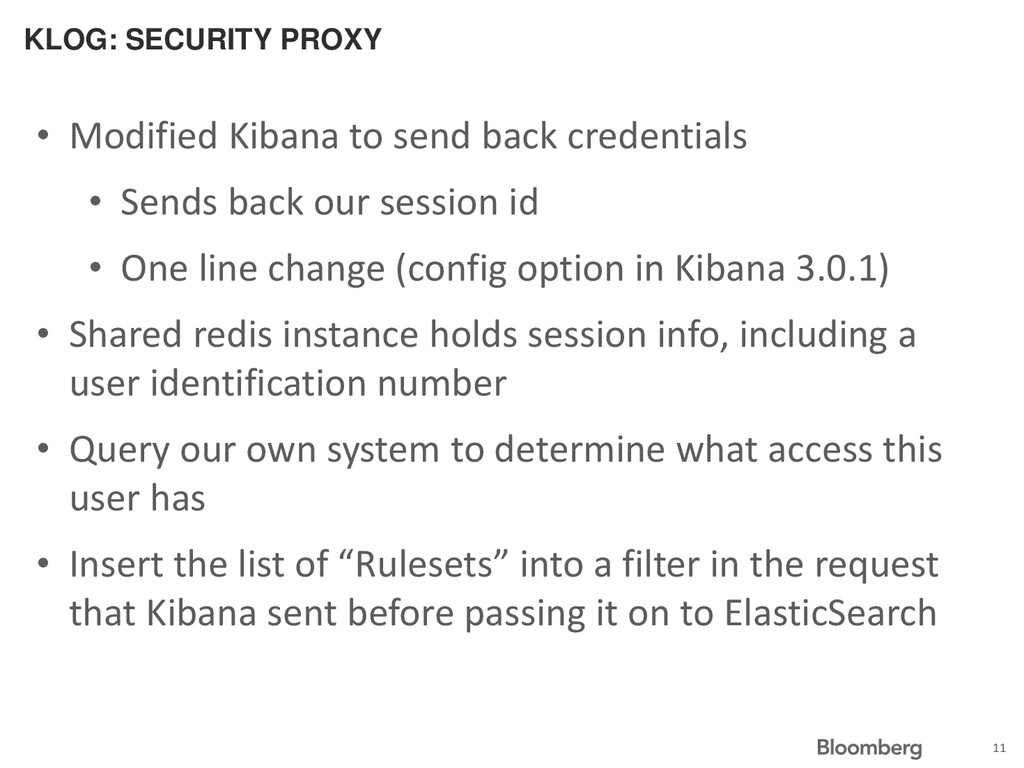
send back credentials • Sends back our session id • One line change (config option in Kibana 3.0.1) • Shared redis instance holds session info, including a user identification number • Query our own system to determine what access this user has • Insert the list of “Rulesets” into a filter in the request that Kibana sent before passing it on to ElasticSearch
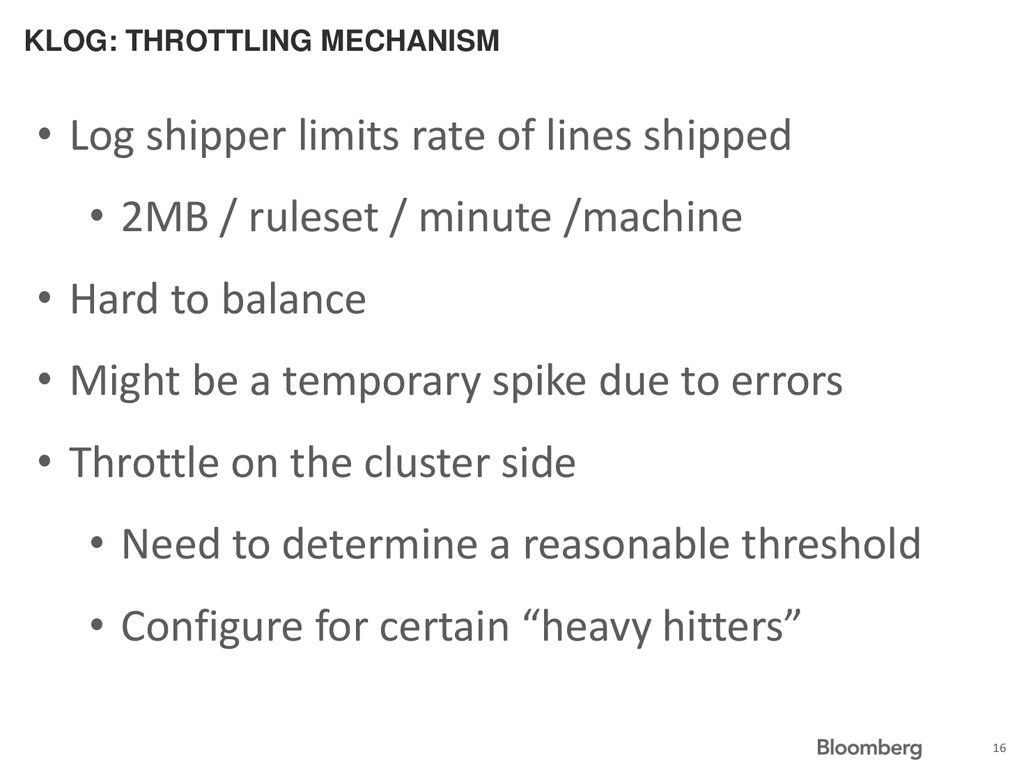
rate of lines shipped • 2MB / ruleset / minute /machine • Hard to balance • Might be a temporary spike due to errors • Throttle on the cluster side • Need to determine a reasonable threshold • Configure for certain “heavy hitters”
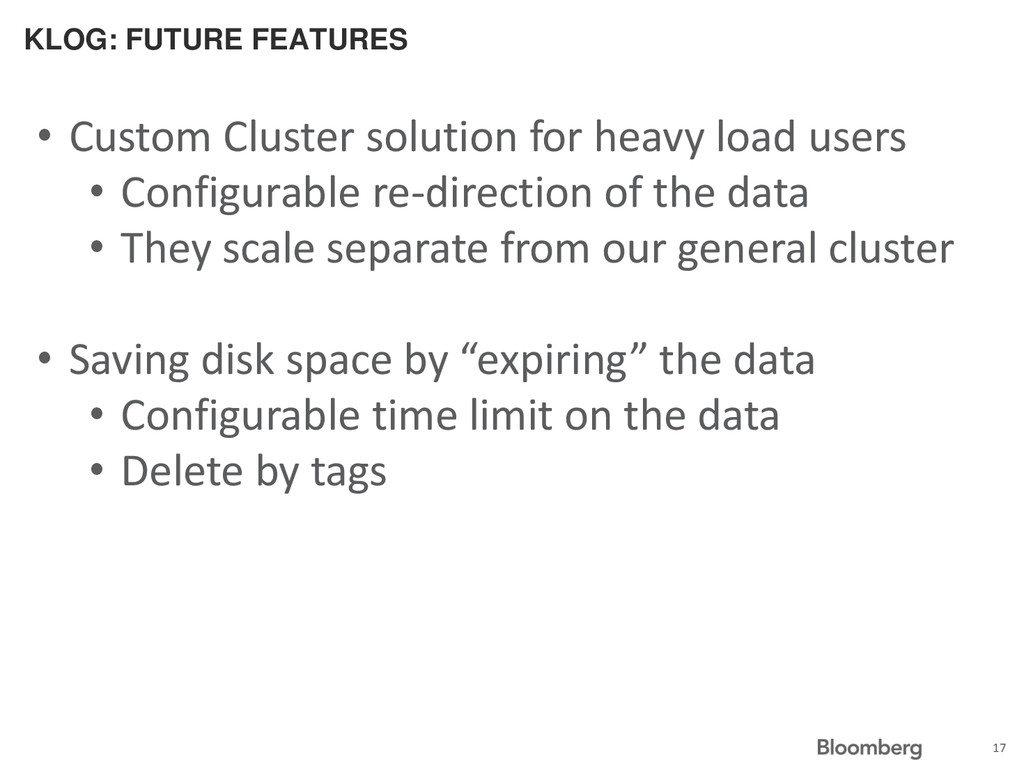
heavy load users • Configurable re-direction of the data • They scale separate from our general cluster • Saving disk space by “expiring” the data • Configurable time limit on the data • Delete by tags 17
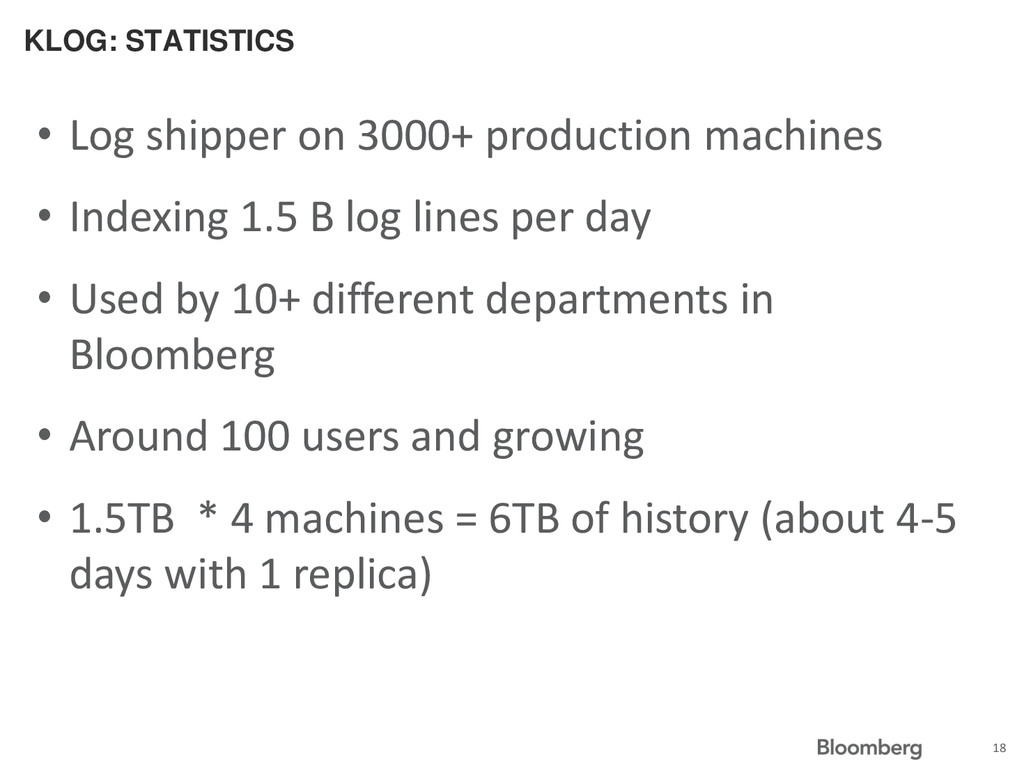
machines • Indexing 1.5 B log lines per day • Used by 10+ different departments in Bloomberg • Around 100 users and growing • 1.5TB * 4 machines = 6TB of history (about 4-5 days with 1 replica) 18
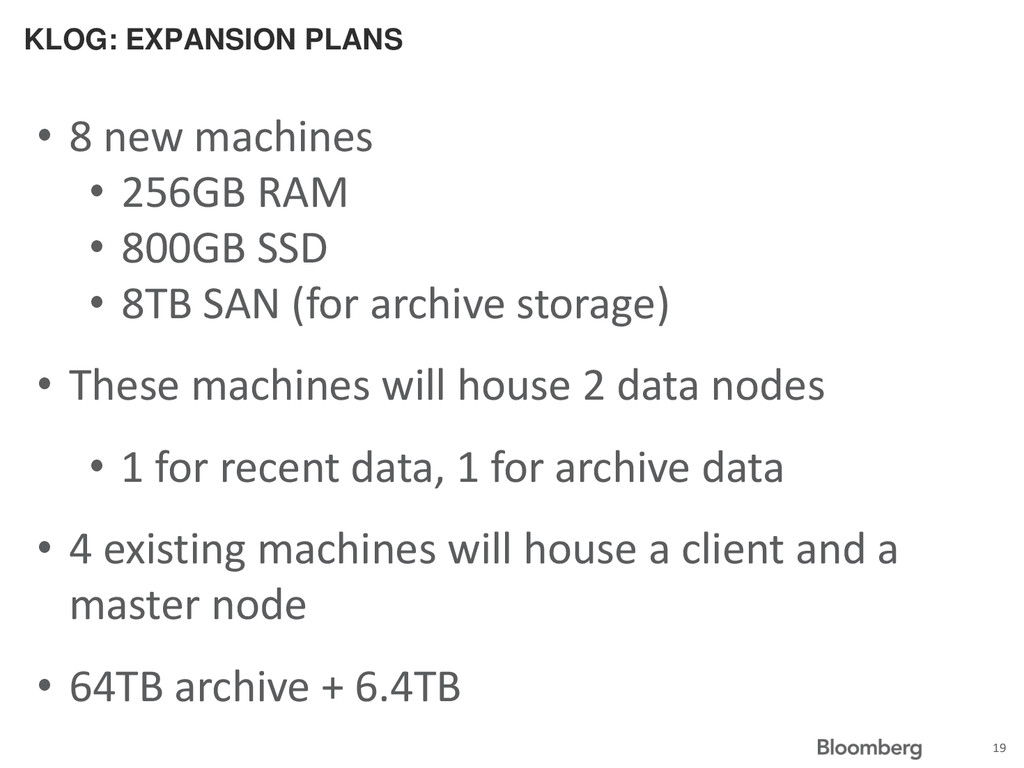
256GB RAM • 800GB SSD • 8TB SAN (for archive storage) • These machines will house 2 data nodes • 1 for recent data, 1 for archive data • 4 existing machines will house a client and a master node • 64TB archive + 6.4TB 19