Upgrade to Pro — share decks privately, control downloads, hide ads and more …

Using GPU-Powered Analytics to Unlock Data Value in the Oil and Gas Industry

OmniSci
February 14, 2019

Using GPU-Powered Analytics to Unlock Data Value in the Oil and Gas Industry

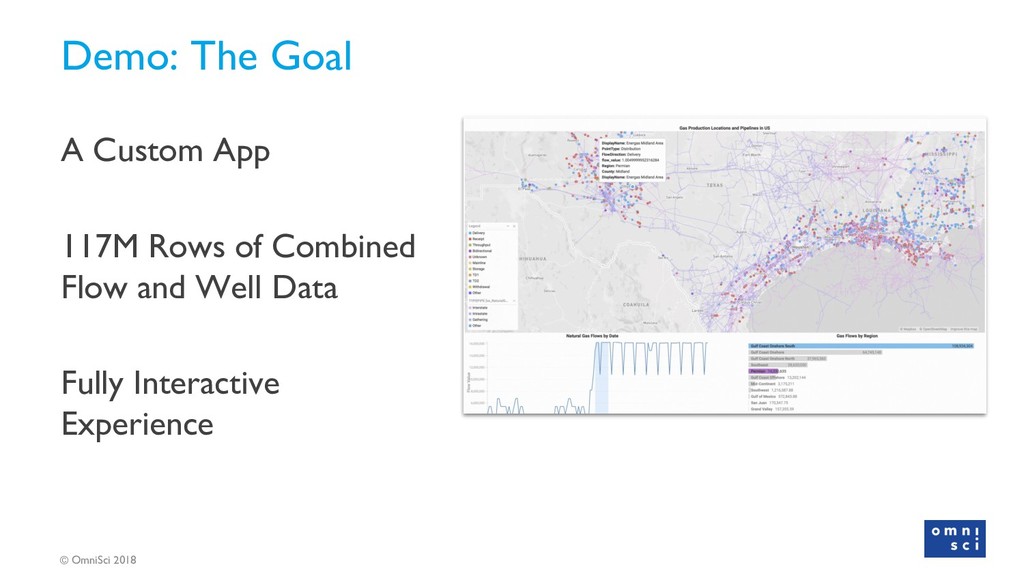
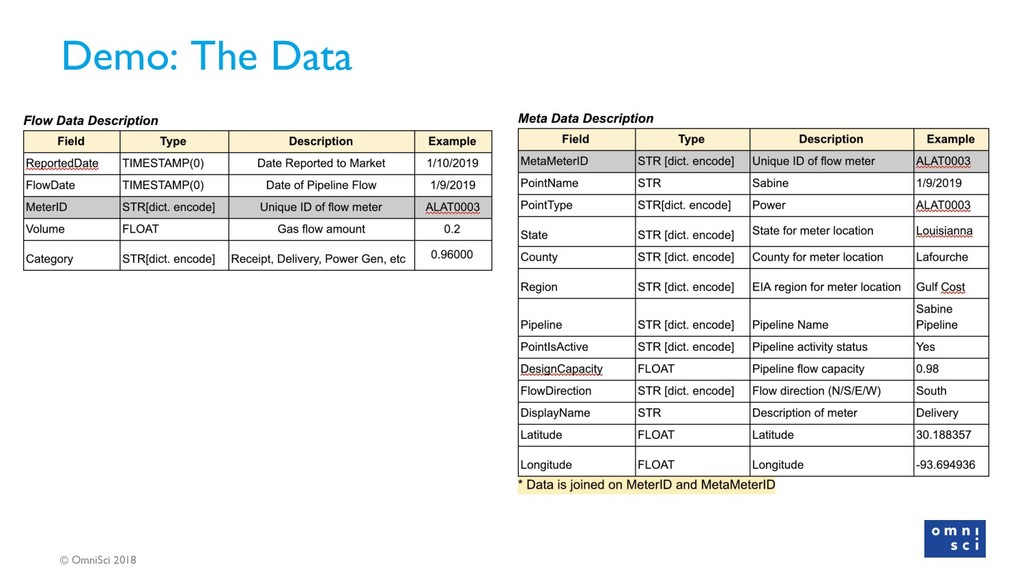
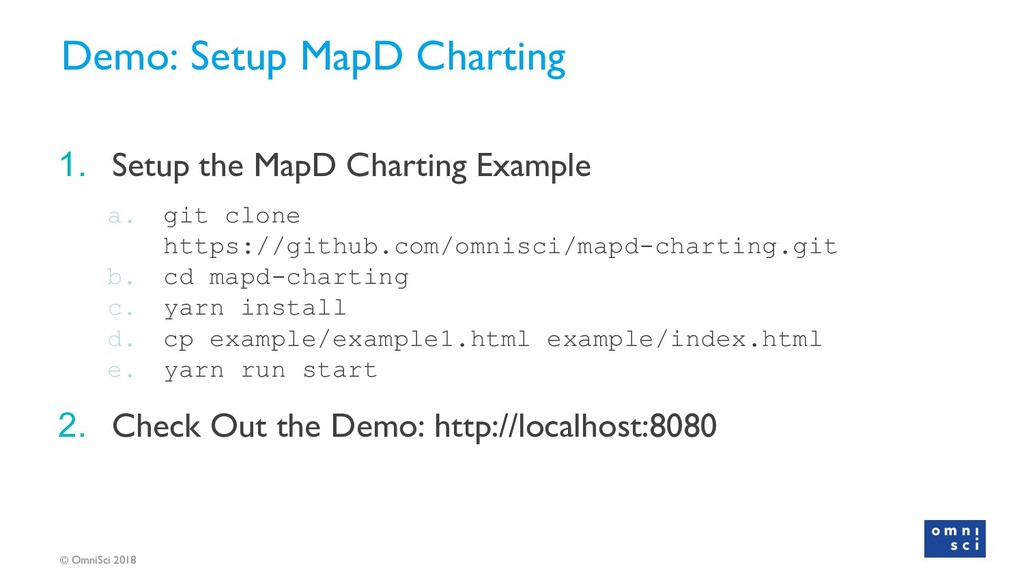
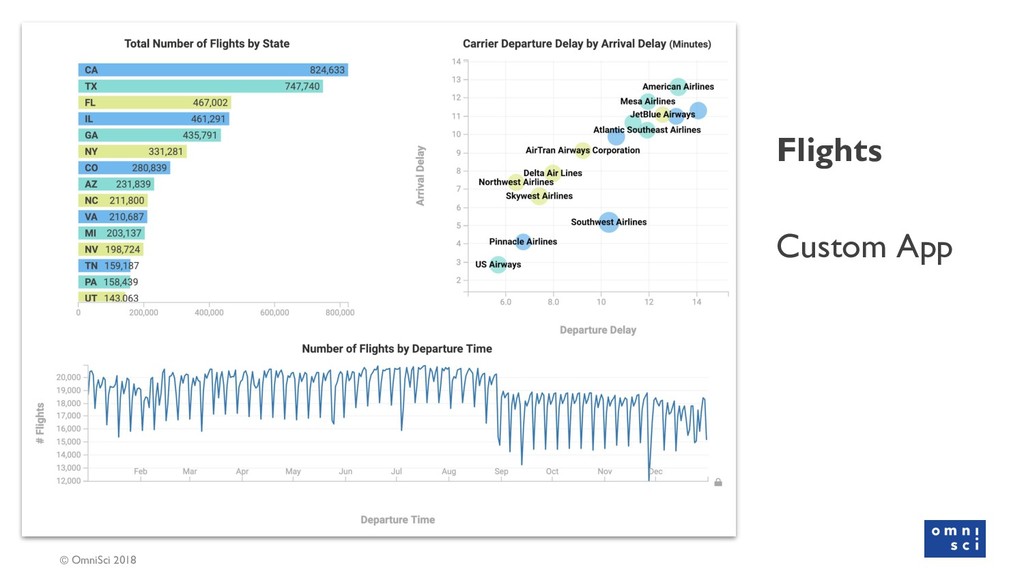
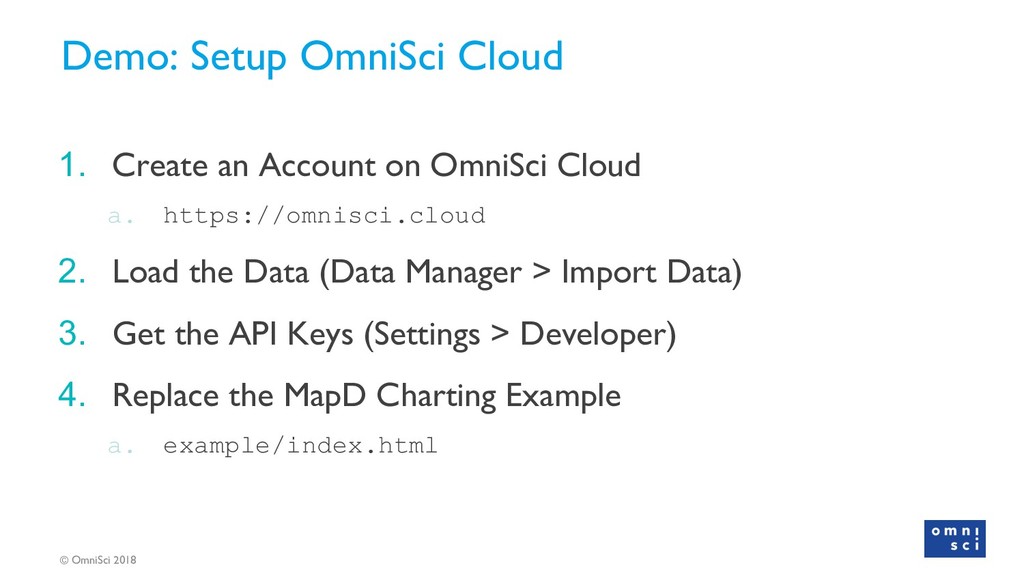
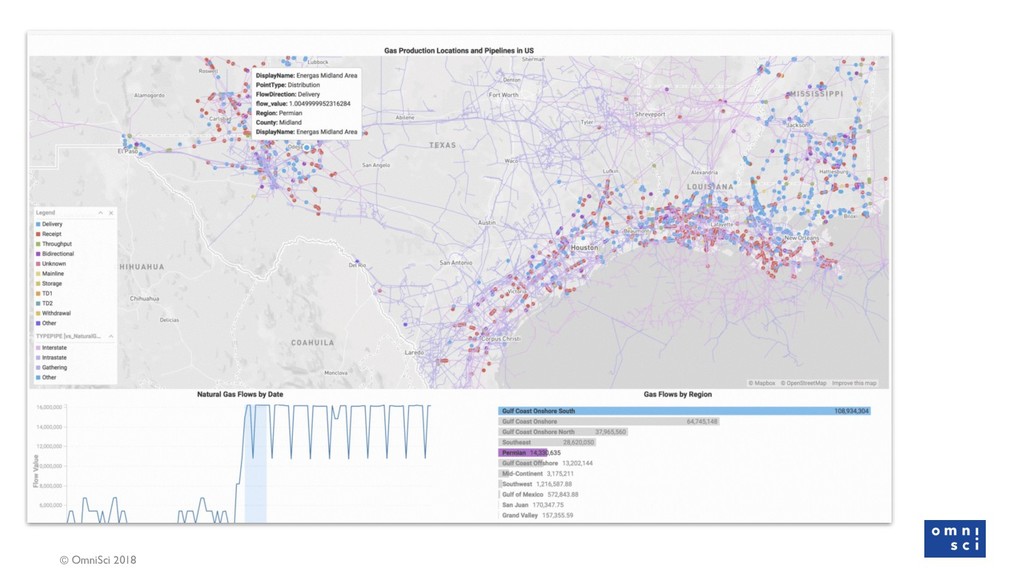
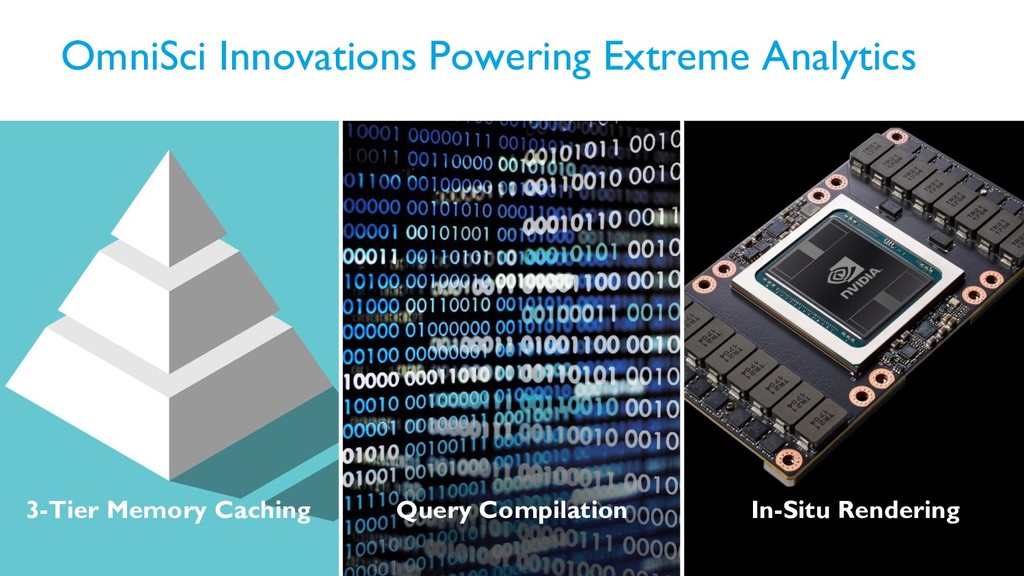
In this talk, I2Enabled and OmniSci (formerly MapD) will demonstrate an example, based on a real-world application used in the oil and gas industry, showing why and how companies are innovating with GPU-powered analytics. We’ll show how the demonstrated application was built, and explain how to use the OmniSci APIs to build a similar application for yourself.

OmniSci

February 14, 2019
Tweet

More Decks by OmniSci

Other Decks in Technology

Transcript

  1. Using GPU-Powered Analytics to Unlock Data Value in the Oil

    and Gas Industry IBM THINK | San Francisco | February 14, 2019 slides: https://speakerdeck.com/omnisci
  2. © OmniSci 2018 Aaron Williams VP, Global Community at OmniSci

    @_arw_ [email protected] /in/aaronwilliams/ /williamsaaron Alan Lipe Principal at i2enabled @alipe01 [email protected] /in/alan-lipe-516417 /alanlipe
  3. © OmniSci 2018 Data in the Oil and Gas Industry

    The Overall Energy Market is Changing • US production continues growing • Developing countries are electrifying with renewables and oil and gas products • Increasing need to measure emissions New Tools are Needed to Meet the Challenge • Technical and operational analysis • Large, spatiotemporal datasets
  4. © OmniSci 2018 Energy Analysis Dimensions Source/Commodity • Oil, Gas,

    Coal, Nuclear • Solar, Wind, Hydro, Geothermal • Fusion? Location • Origin • Destination • Supply Chain Time Period • History • Current • Futures
  5. © OmniSci 2018 Core Density Makes a Huge Difference GPU

    Processing CPU Processing 40,000 Cores 20 Cores Latency Throughput CPU 1 ns per task (1 task/ns) x (20 cores) = 20 tasks/ns GPU 10 ns per task (0.1 task per ns) x (40,000 cores) = 4,000 task per ns Latency: Time to do a task. | Throughput: Number of tasks per unit time. *fictitious example
  6. © OmniSci 2018 Demo: The Goal A Custom App 117M

    Rows of Combined Flow and Well Data Fully Interactive Experience
  7. © OmniSci 2018 Demo: Setup MapD Charting 1. Setup the

    MapD Charting Example a. git clone https://github.com/omnisci/mapd-charting.git b. cd mapd-charting c. yarn install d. cp example/example1.html example/index.html e. yarn run start 2. Check Out the Demo: http://localhost:8080
  8. © OmniSci 2018 Demo: Setup OmniSci Cloud 1. Create an

    Account on OmniSci Cloud a. https://omnisci.cloud 2. Load the Data (Data Manager > Import Data) 3. Get the API Keys (Settings > Developer) 4. Replace the MapD Charting Example a. example/index.html
  9. © OmniSci 2018 14 OmniSci Innovations Powering Extreme Analytics 3-Tier

    Memory Caching Query Compilation In-Situ Rendering
  10. © OmniSci 2018 © OmniSci 2018 • omnisci.com/blog Read the

    oil and gas blog post • omnisci.com/demos Play with our live demos for yourself! • omnisci.cloud Get an OmniSci instance in 60 seconds • omnisci.com/platform/downloads/ Download a 30-day trial of OmniSci • community.omnisci.com Ask questions and share your experiences Next Steps
  11. © OmniSci 2018 Aaron Williams VP, Global Community at OmniSci

    @_arw_ [email protected] /in/aaronwilliams/ /williamsaaron Alan Lipe Principal at i2enabled @alipe01 [email protected] /in/alan-lipe-516417 /alanlipe Thank you! Any Questions? slides: https://speakerdeck.com/omnisci