Making sense of Microsoft's very good, but confusing and complicated business intelligence range of products and cloud services.
I've kept updating this presentation (latest overhaul: March 2019), contact me if you're interested in obtaining it as part of a consultation, as I've put an inordinate amount of research time into it.
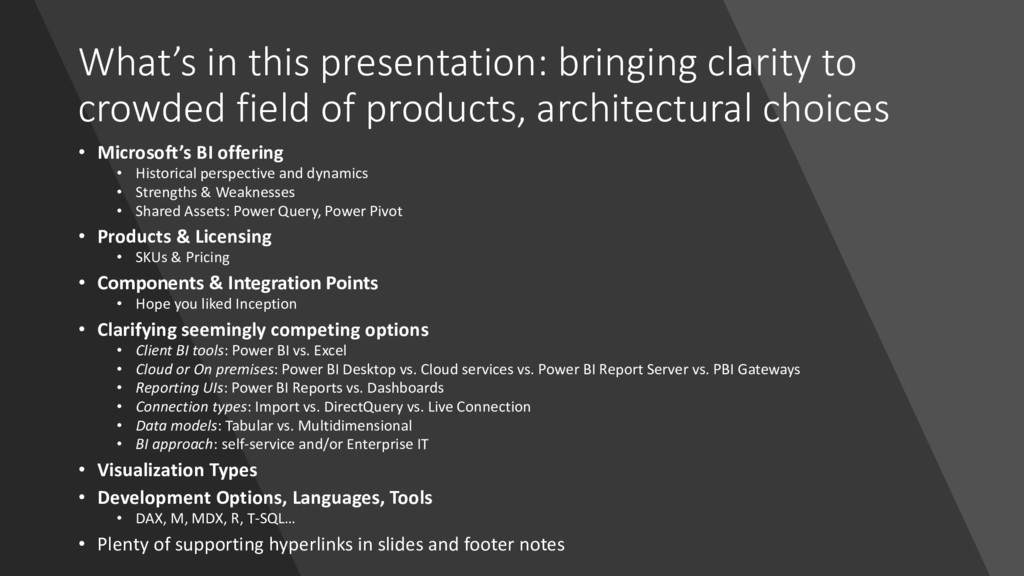
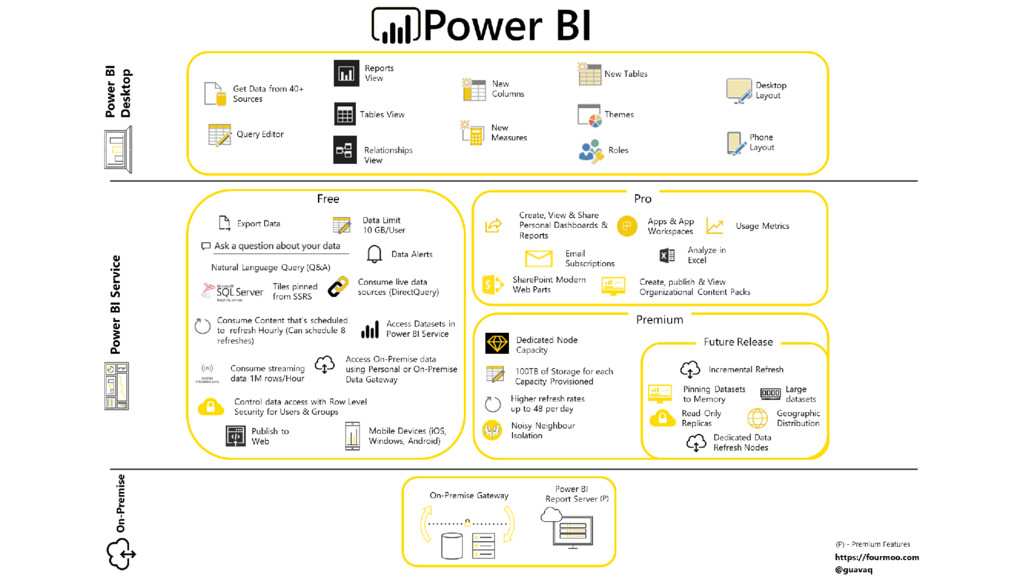
Topics include:
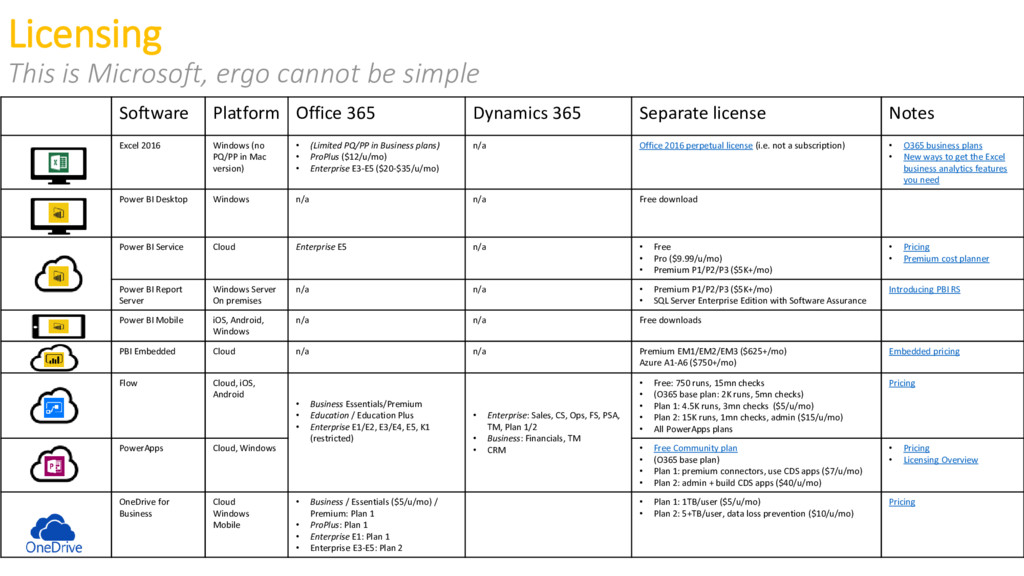
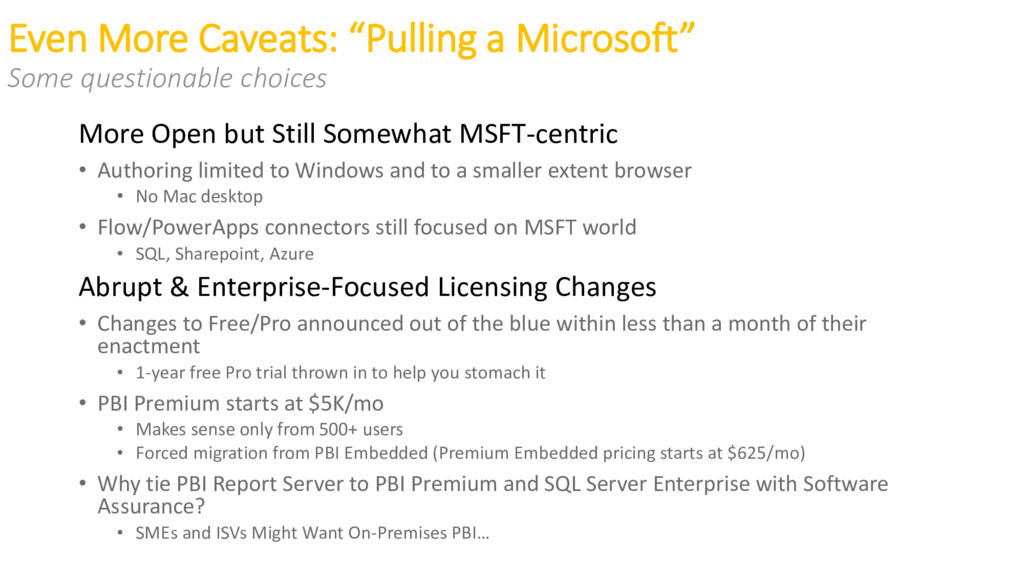
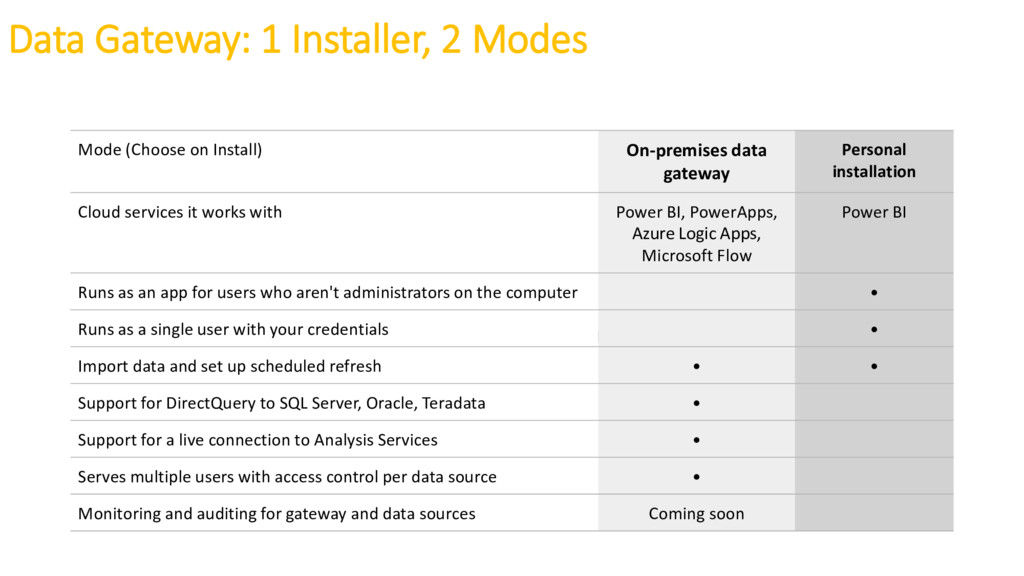
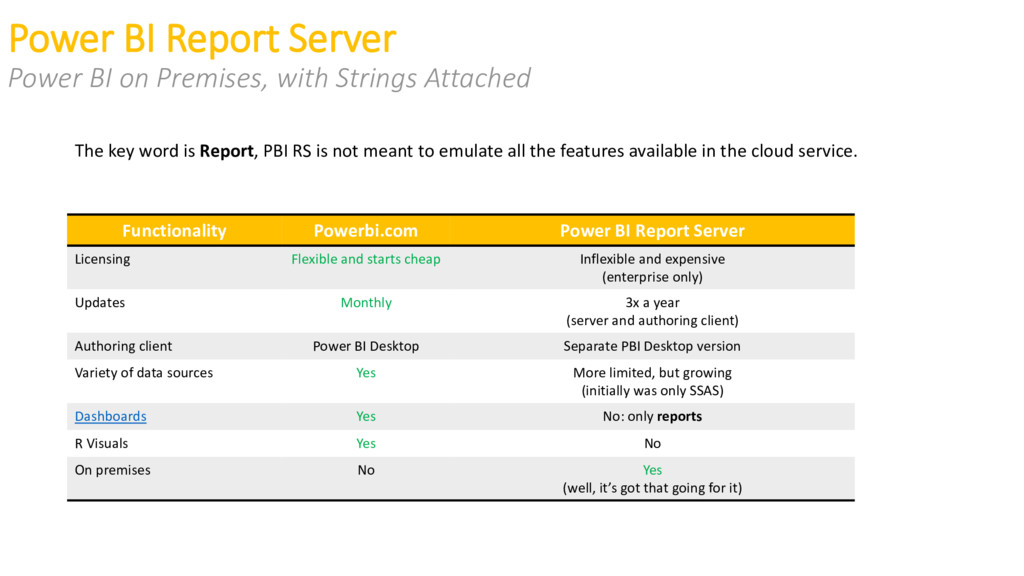
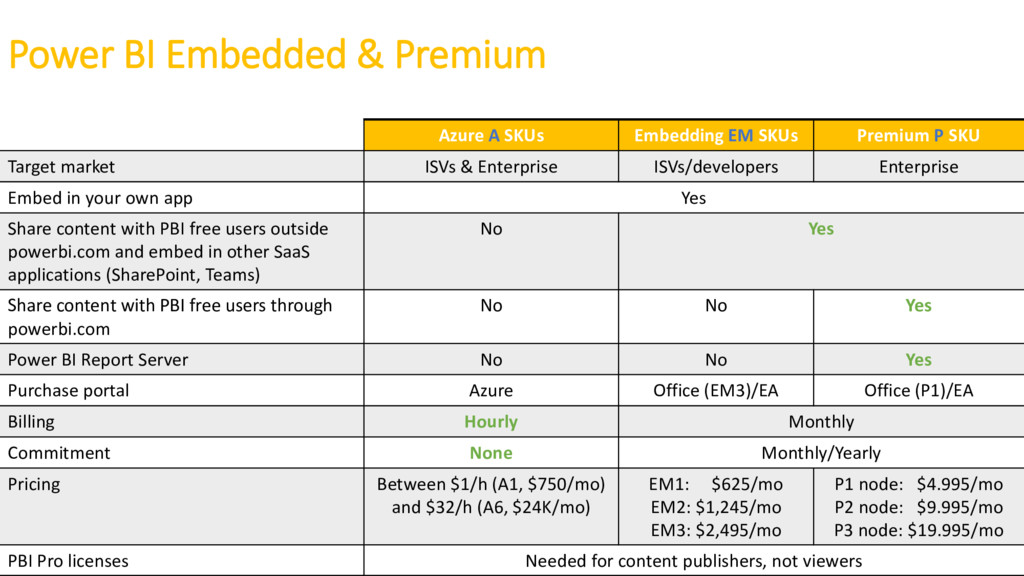
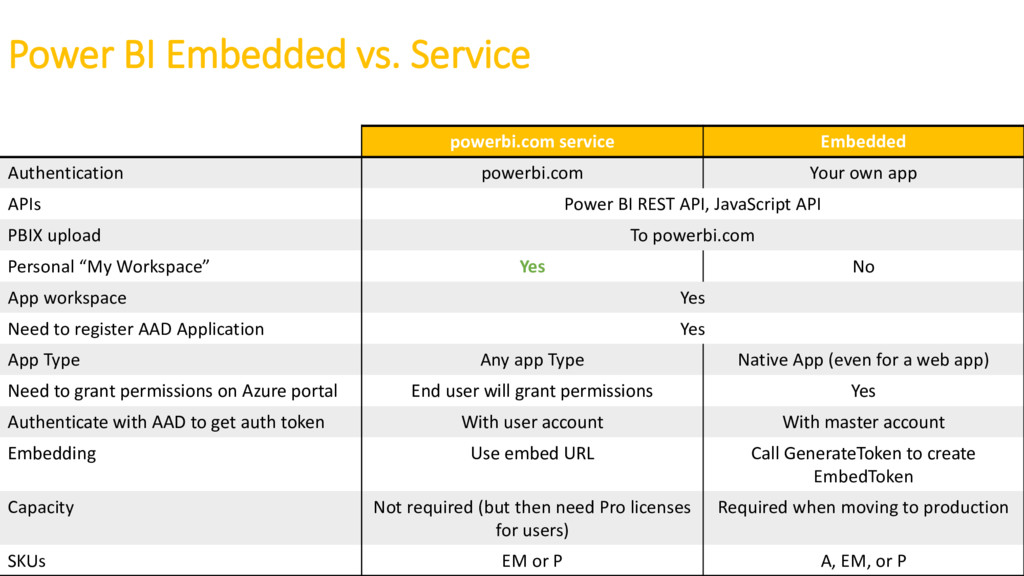
- Licensing
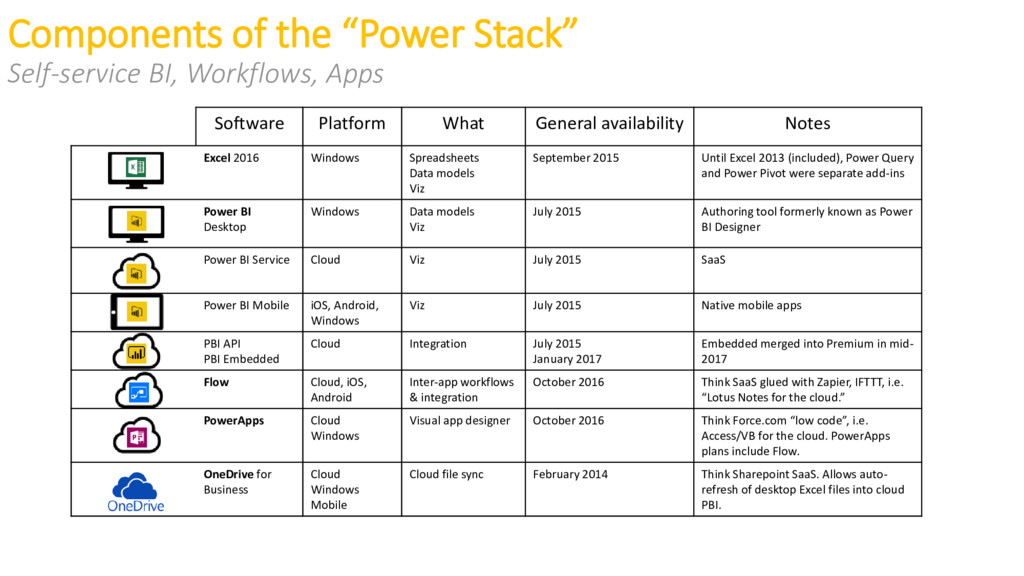
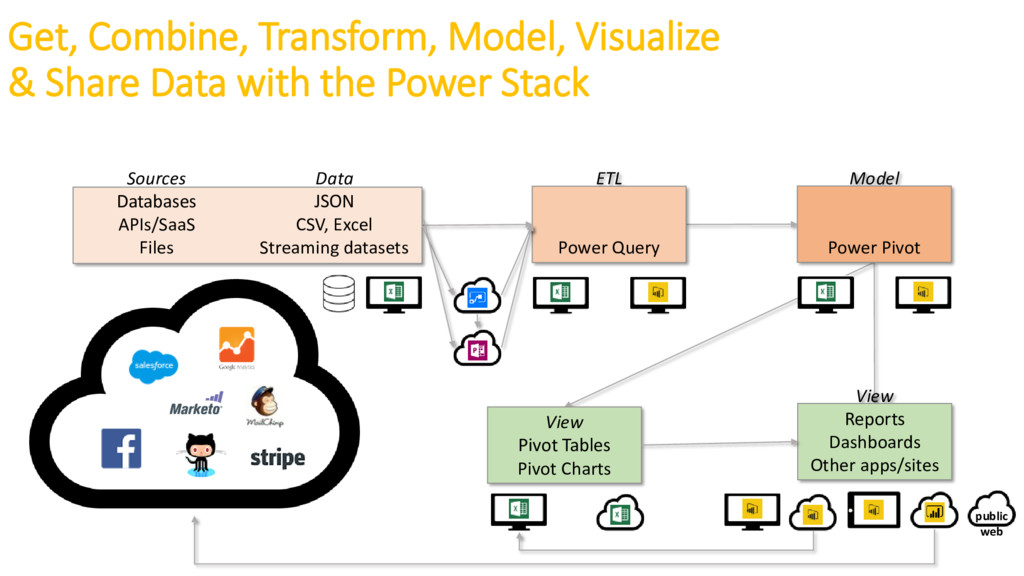
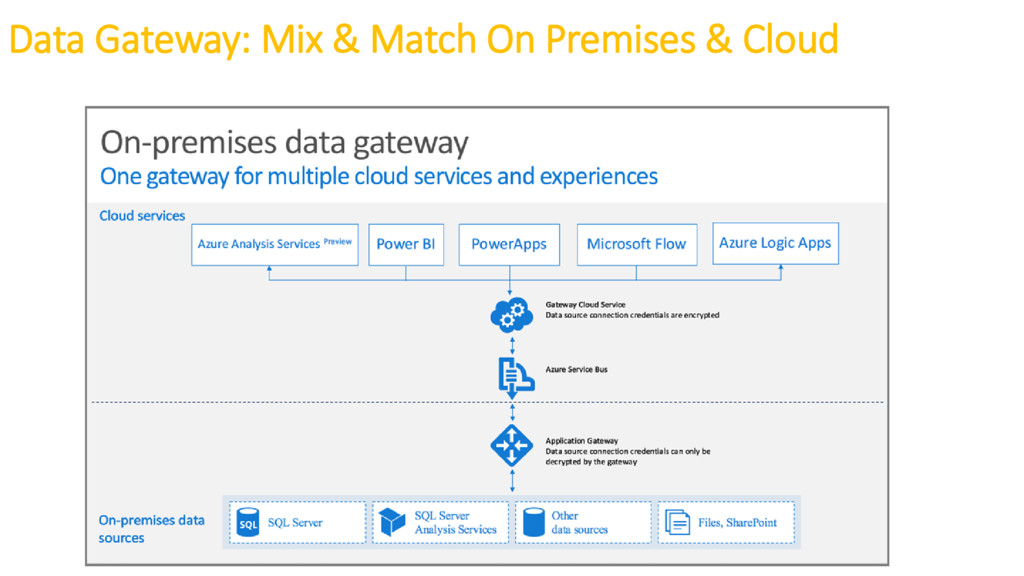
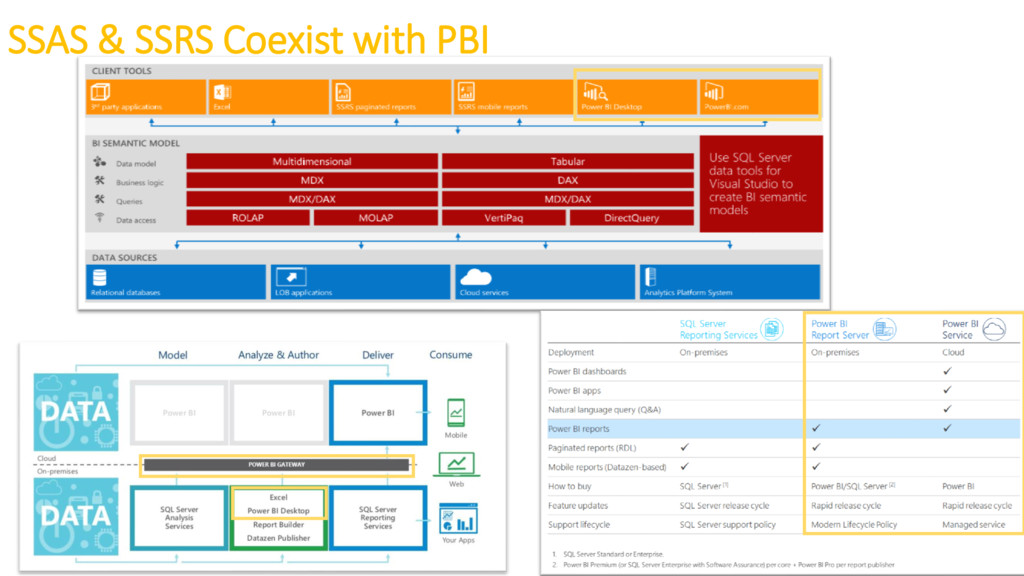
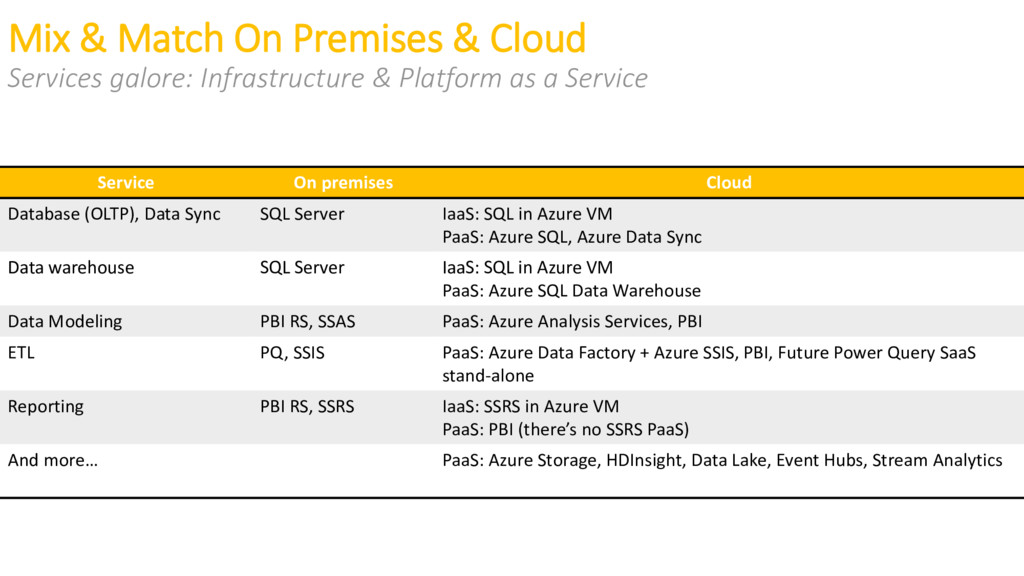
- Architecture
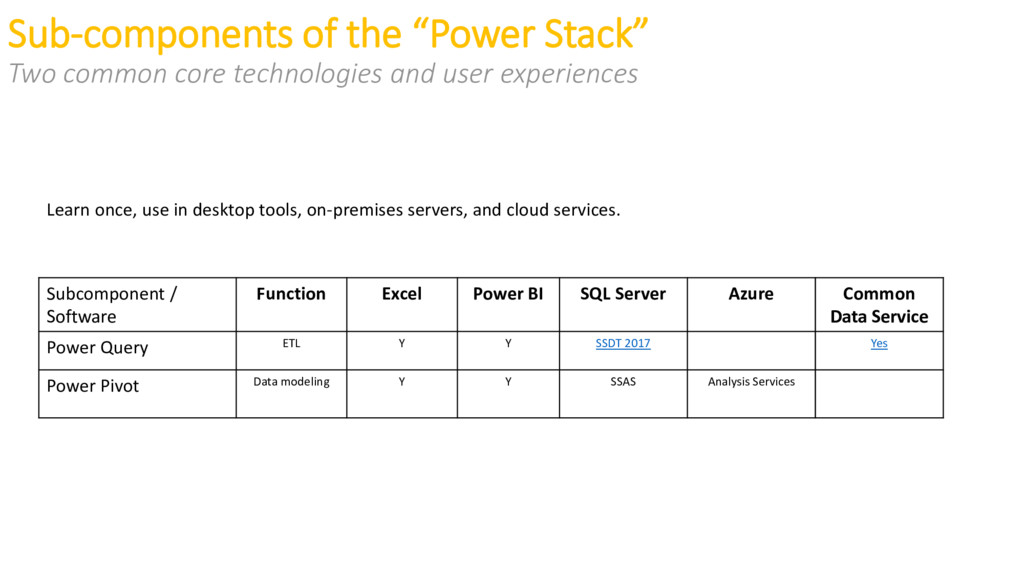
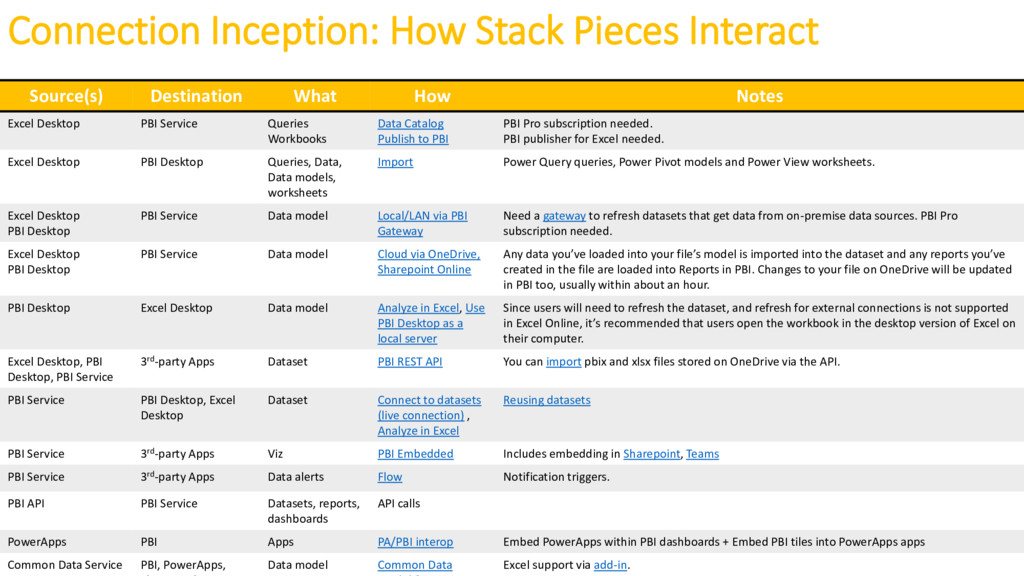
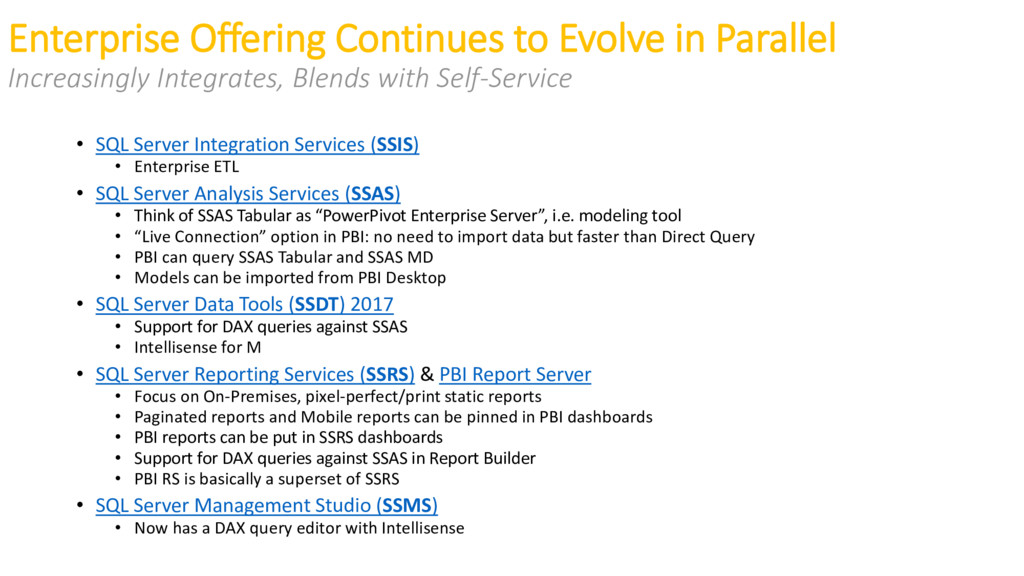
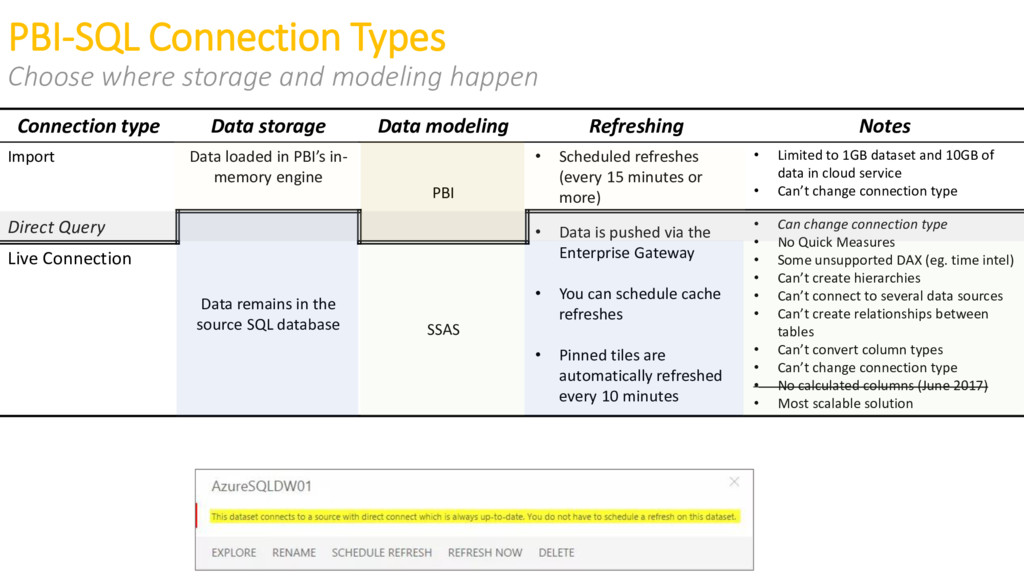
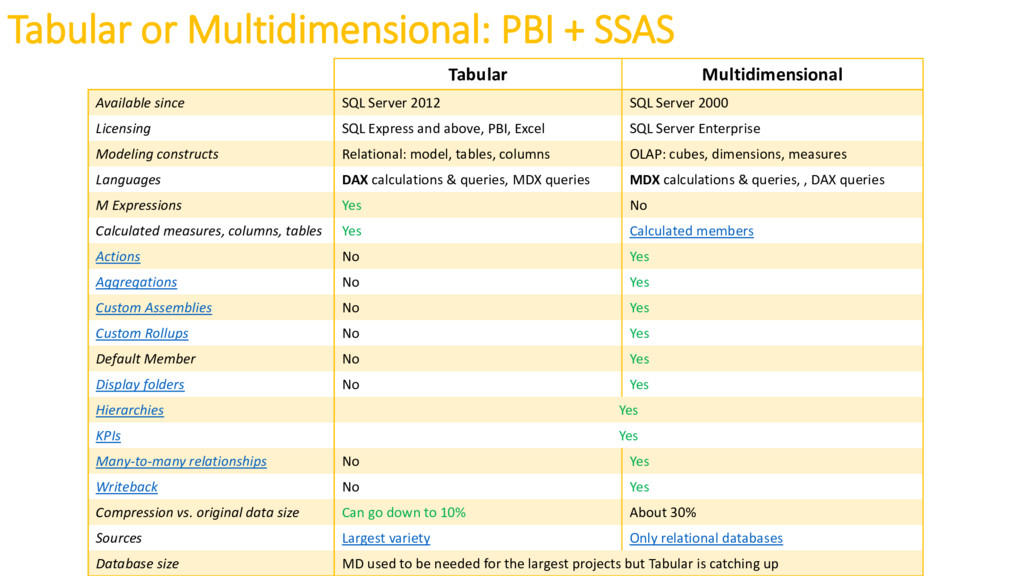
- Integration points between Power BI, Excel, SQL Server, Azure
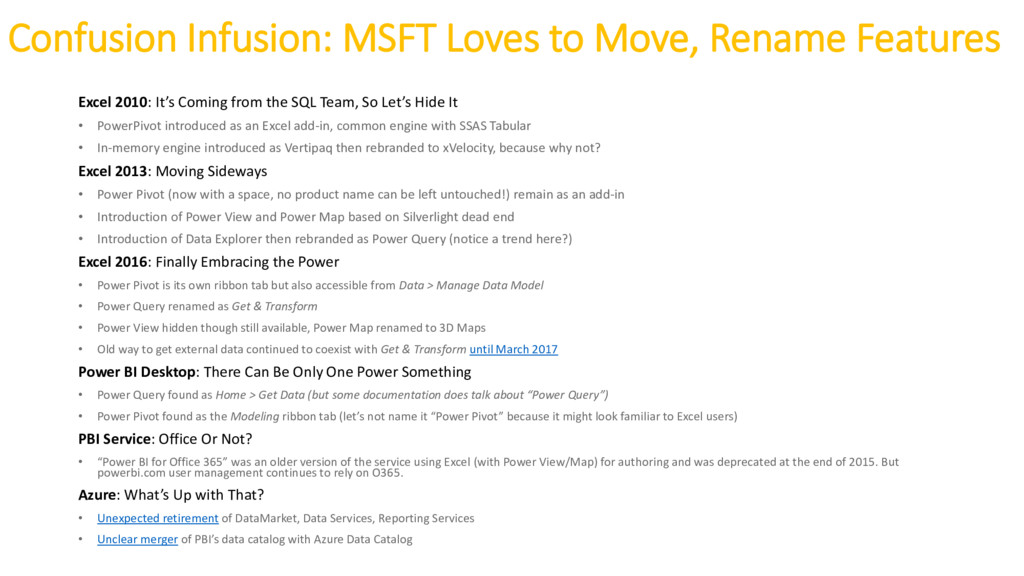
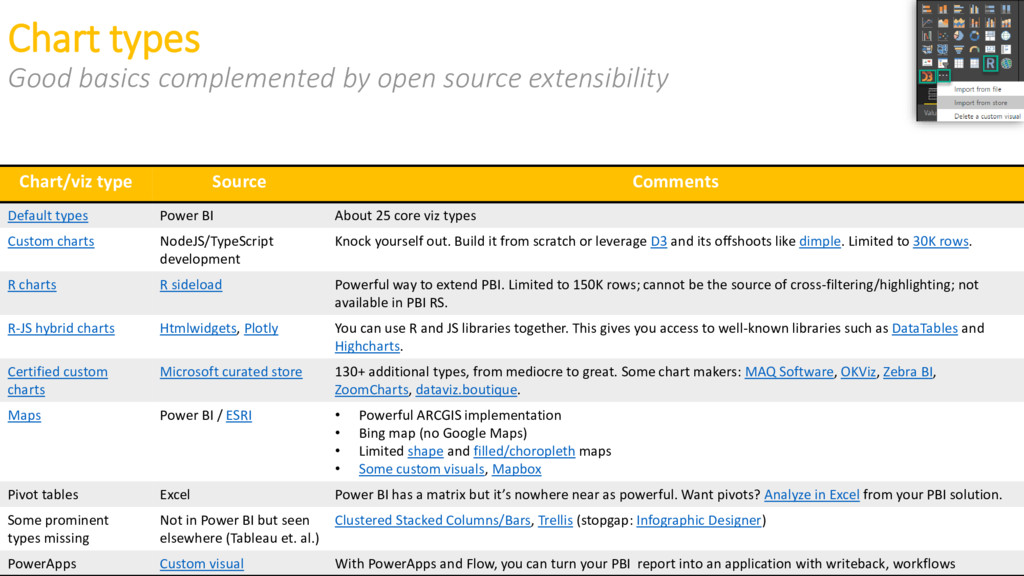
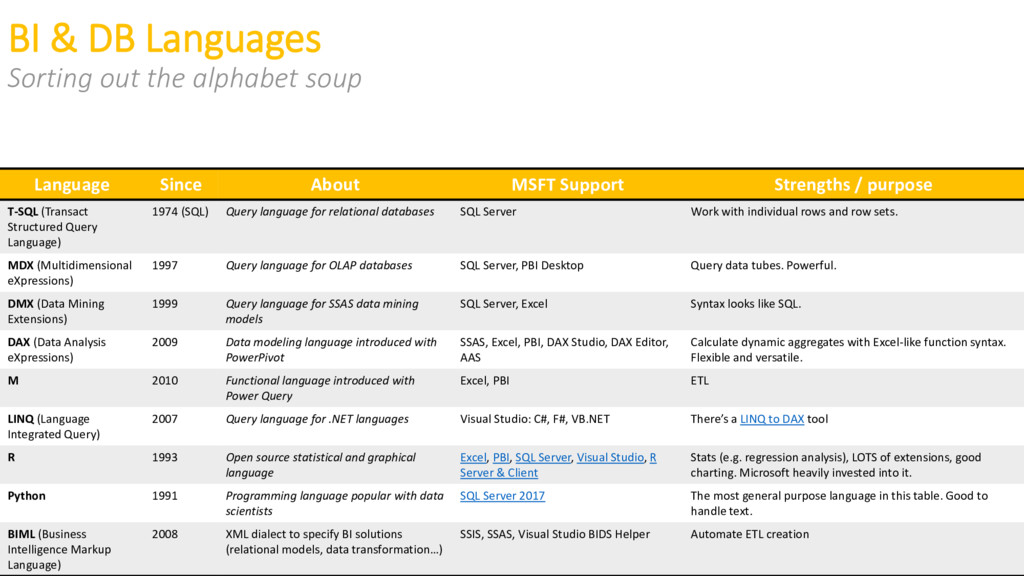
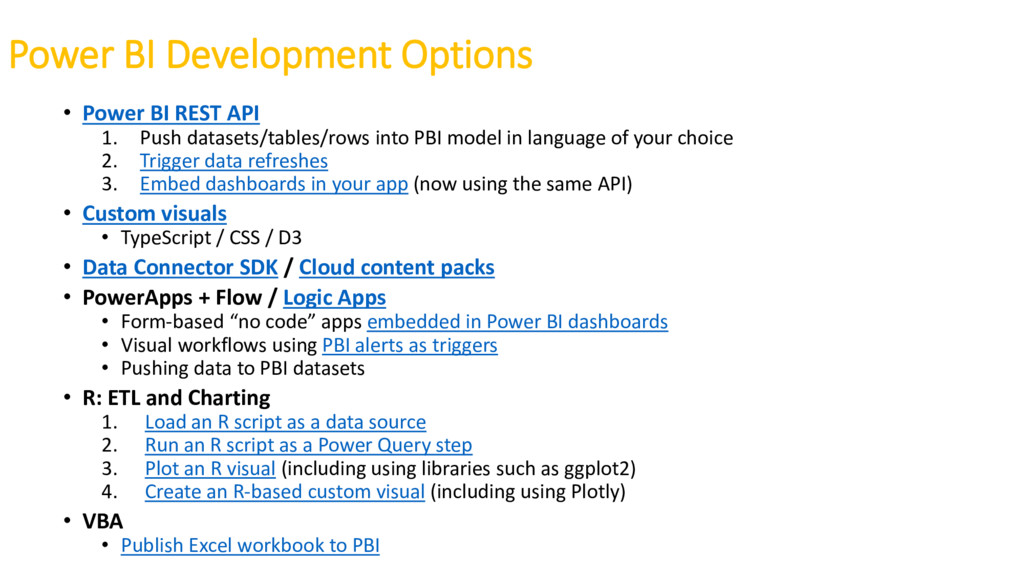
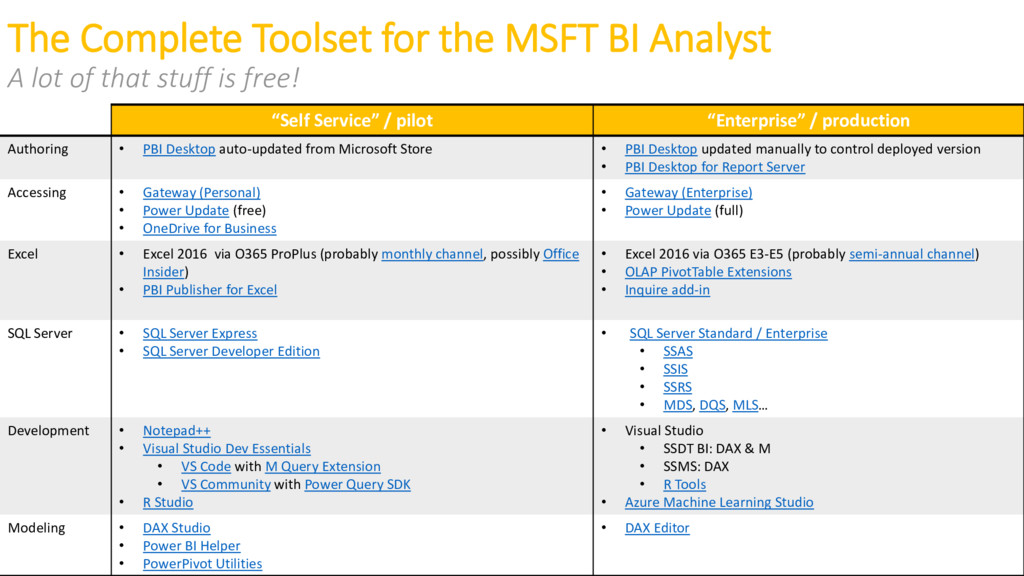
- Development languages and tools