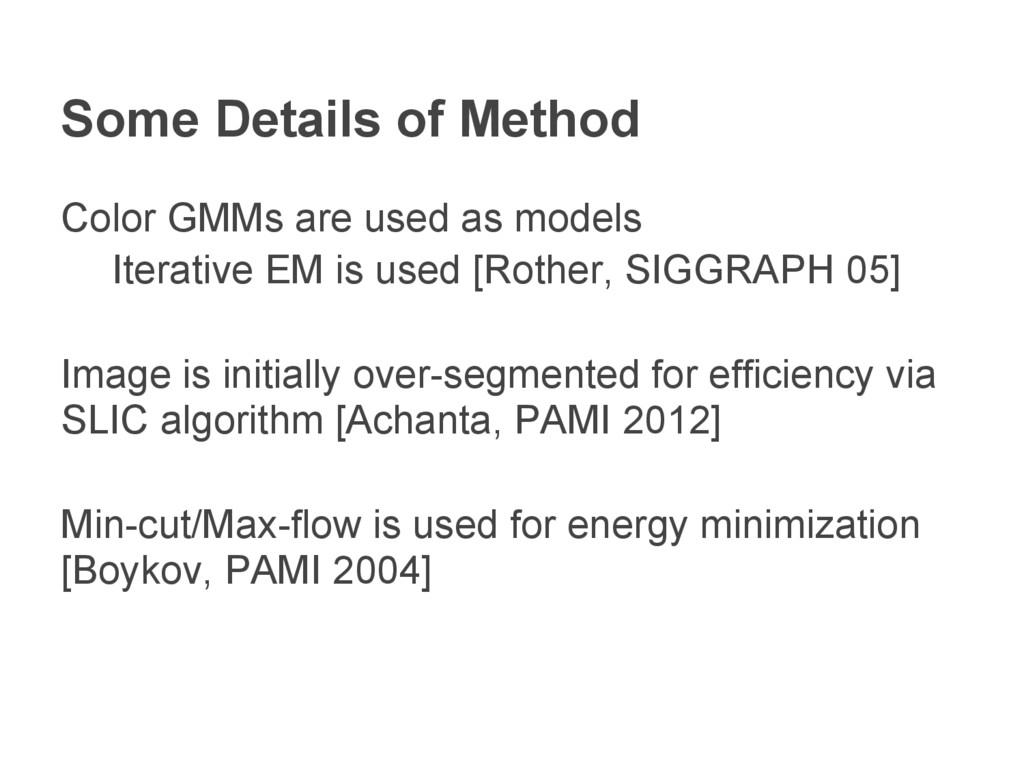
Iterative EM is used [Rother, SIGGRAPH 05] Image is initially over-segmented for efficiency via SLIC algorithm [Achanta, PAMI 2012] Min-cut/Max-flow is used for energy minimization [Boykov, PAMI 2004]
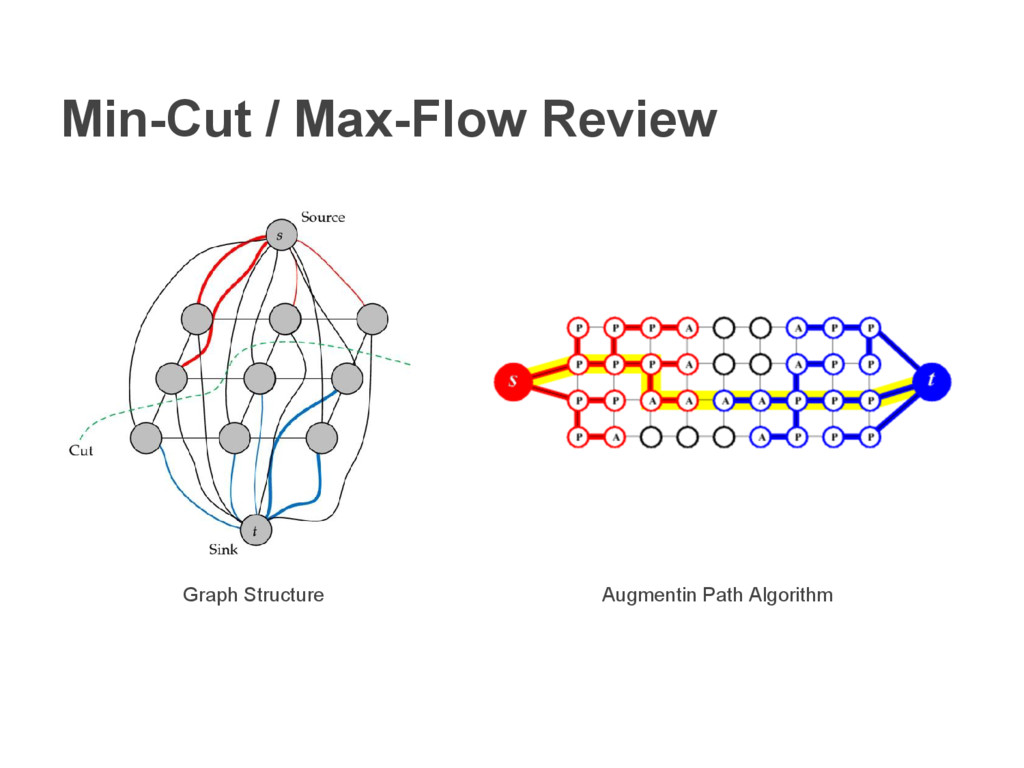
flows can be reused in the minimization [Kohli, PAMI 2007] Throughout the interaction graph structure does not change at all, but min-cut/max-flow is solved many times. Only problem which can arise is the edge weights and it can be solved via additional flow.
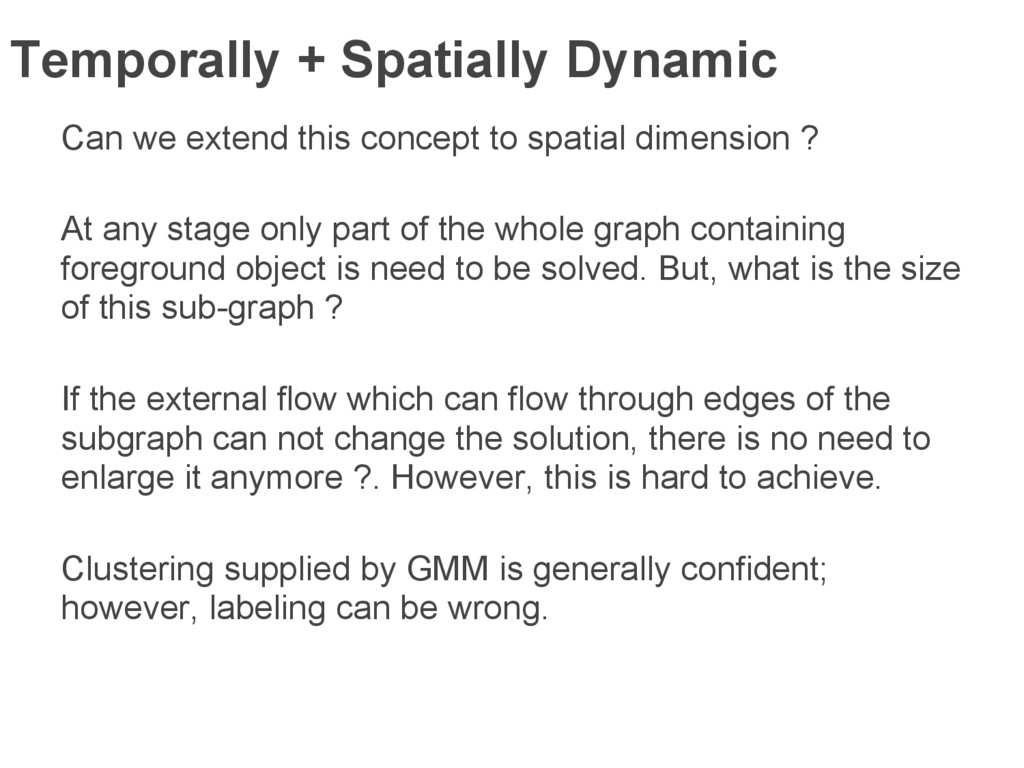
spatial dimension ? At any stage only part of the whole graph containing foreground object is need to be solved. But, what is the size of this sub-graph ? If the external flow which can flow through edges of the subgraph can not change the solution, there is no need to enlarge it anymore ?. However, this is hard to achieve. Clustering supplied by GMM is generally confident; however, labeling can be wrong.
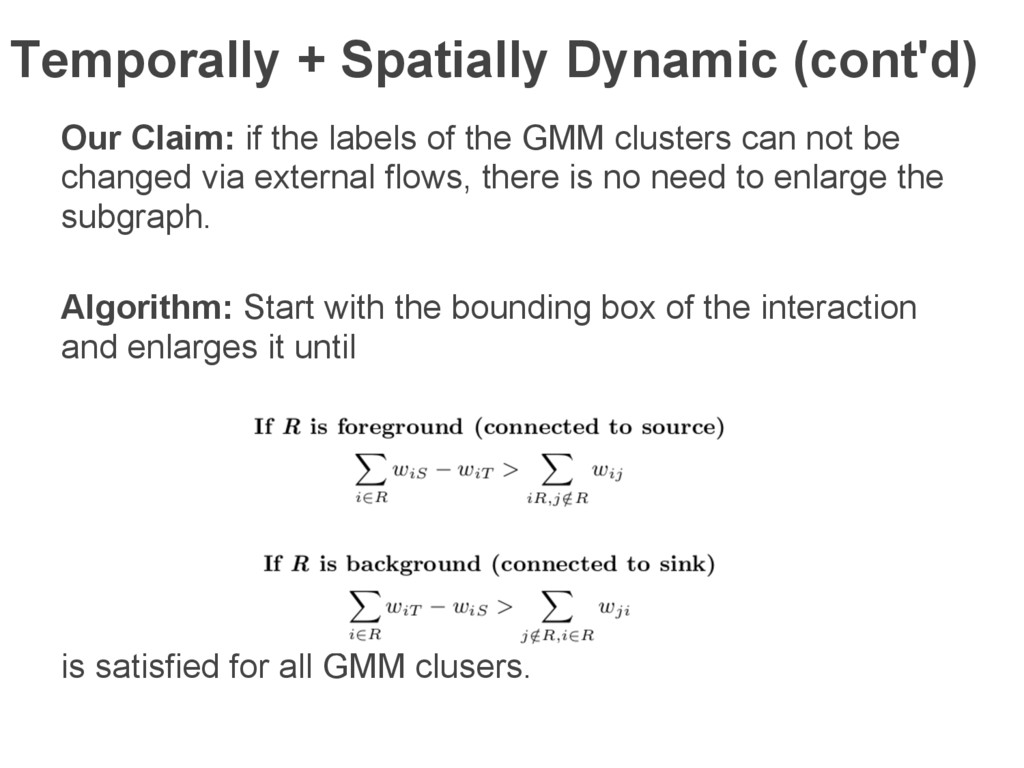
of the GMM clusters can not be changed via external flows, there is no need to enlarge the subgraph. Algorithm: Start with the bounding box of the interaction and enlarges it until is satisfied for all GMM clusers.
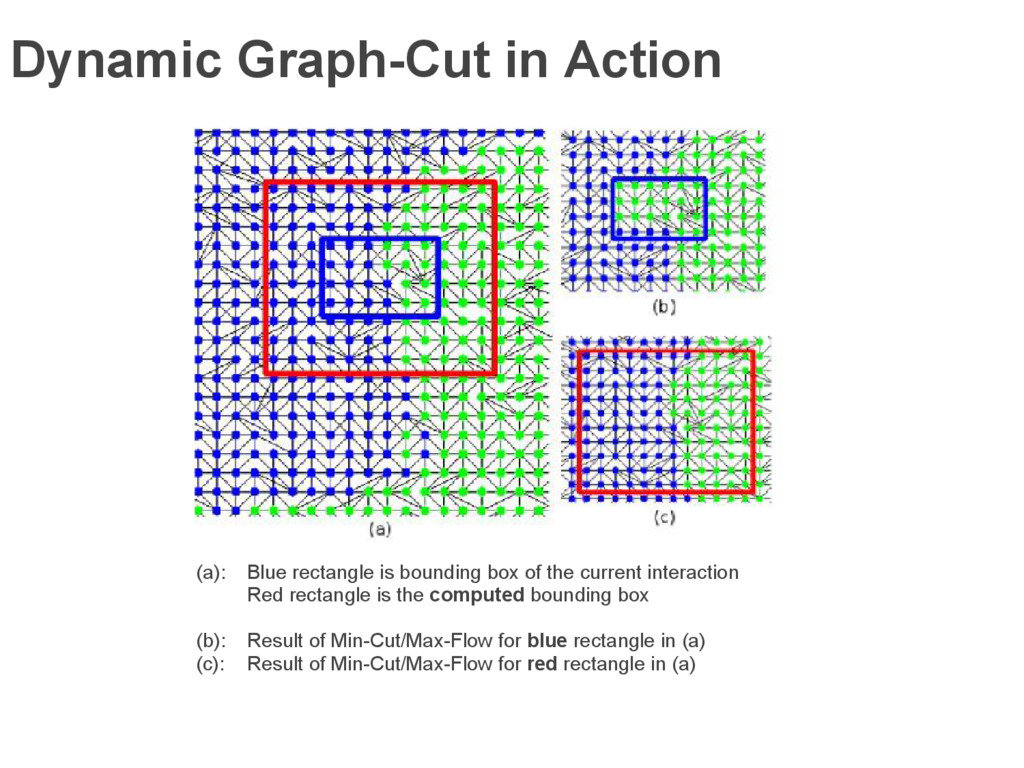
Red rectangle is the computed bounding box (b): Result of Min-Cut/Max-Flow for blue rectangle in (a) (c): Result of Min-Cut/Max-Flow for red rectangle in (a) Dynamic Graph-Cut in Action
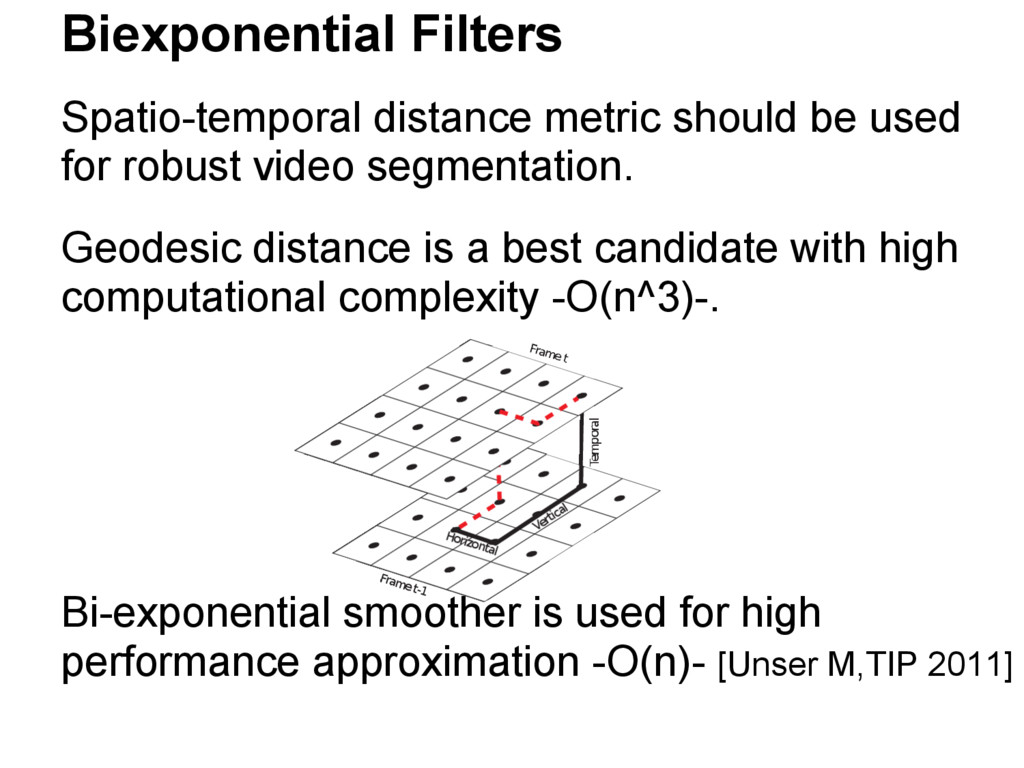
video segmentation. Geodesic distance is a best candidate with high computational complexity -O(n^3)-. Bi-exponential smoother is used for high performance approximation -O(n)- [Unser M,TIP 2011]
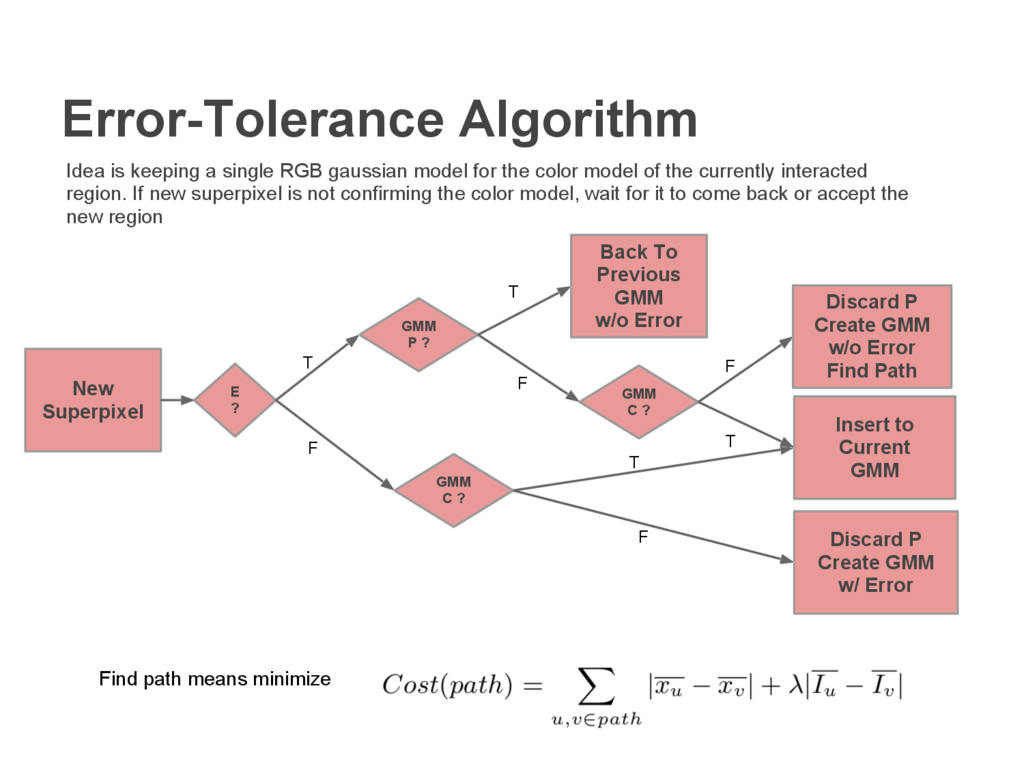
gaussian model for the color model of the currently interacted region. If new superpixel is not confirming the color model, wait for it to come back or accept the new region E ? GMM P ? Back To Previous GMM w/o Error GMM C ? Insert to Current GMM Discard P Create GMM w/ Error T F T T F F GMM C ? Discard P Create GMM w/o Error Find Path T F Find path means minimize
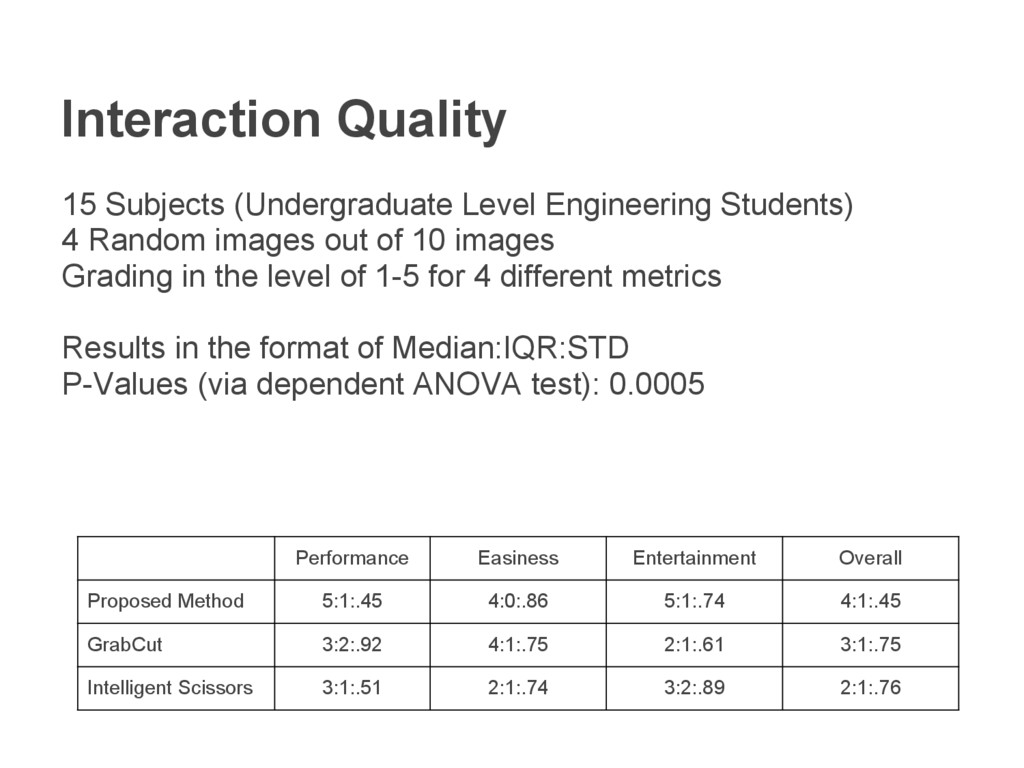
5:1:.74 4:1:.45 GrabCut 3:2:.92 4:1:.75 2:1:.61 3:1:.75 Intelligent Scissors 3:1:.51 2:1:.74 3:2:.89 2:1:.76 15 Subjects (Undergraduate Level Engineering Students) 4 Random images out of 10 images Grading in the level of 1-5 for 4 different metrics Results in the format of Median:IQR:STD P-Values (via dependent ANOVA test): 0.0005
![[Bounding Box + Color GMM + Min-Cut/Max-Flow] = [Rother, SIGGRAPH](https://files.speakerdeck.com/presentations/3124eddbe07f4979babc1a235133db2c/slide_2.jpg)
![Time vs Performance On Segtrack [Tsai BMVC 2010] dataset:](https://files.speakerdeck.com/presentations/3124eddbe07f4979babc1a235133db2c/slide_19.jpg)