of California, Inc. All rights reserved. FIND MEANING IN COMPLEXITY Phasing work by Jason Chin HIV mixture work by Michael Brown Empirical Phasing of Distantly-located Variants in Complex Non-homogenous Samples using SMRT® Sequencing
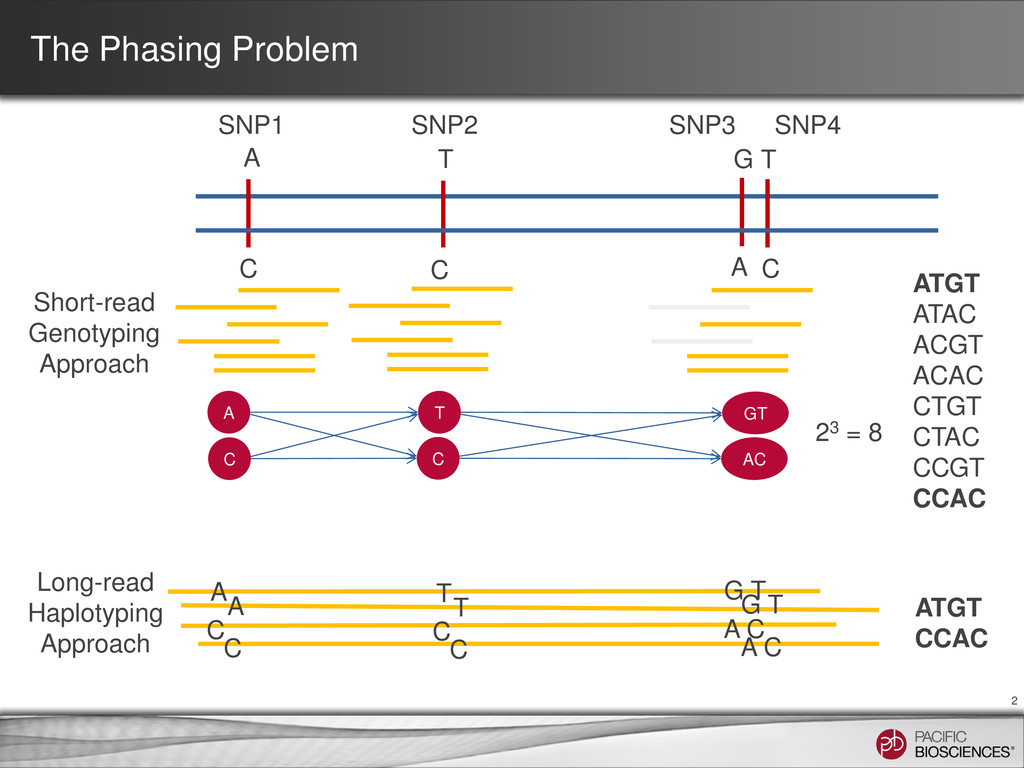
T C SNP1 SNP2 SNP3 SNP4 T ATGT ATAC ACGT ACAC CTGT CTAC CCGT CCAC 23 = 8 C GT A AC C Short-read Genotyping Approach Long-read Haplotyping Approach A T G T A C C C A C C C A T G T ATGT CCAC
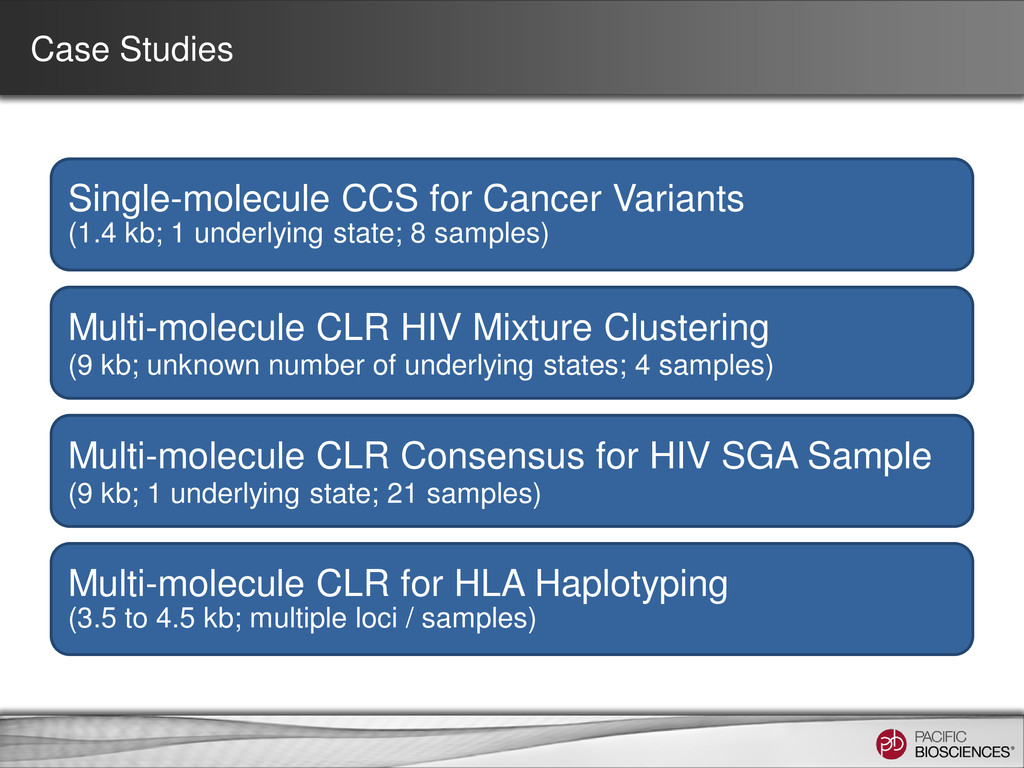
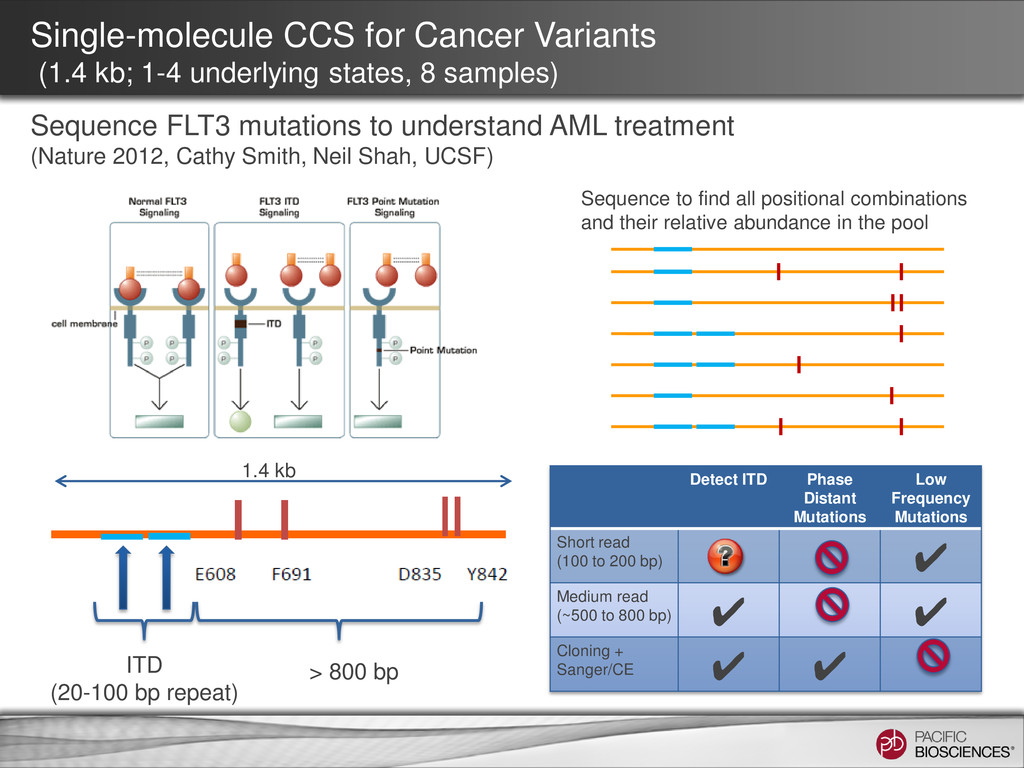
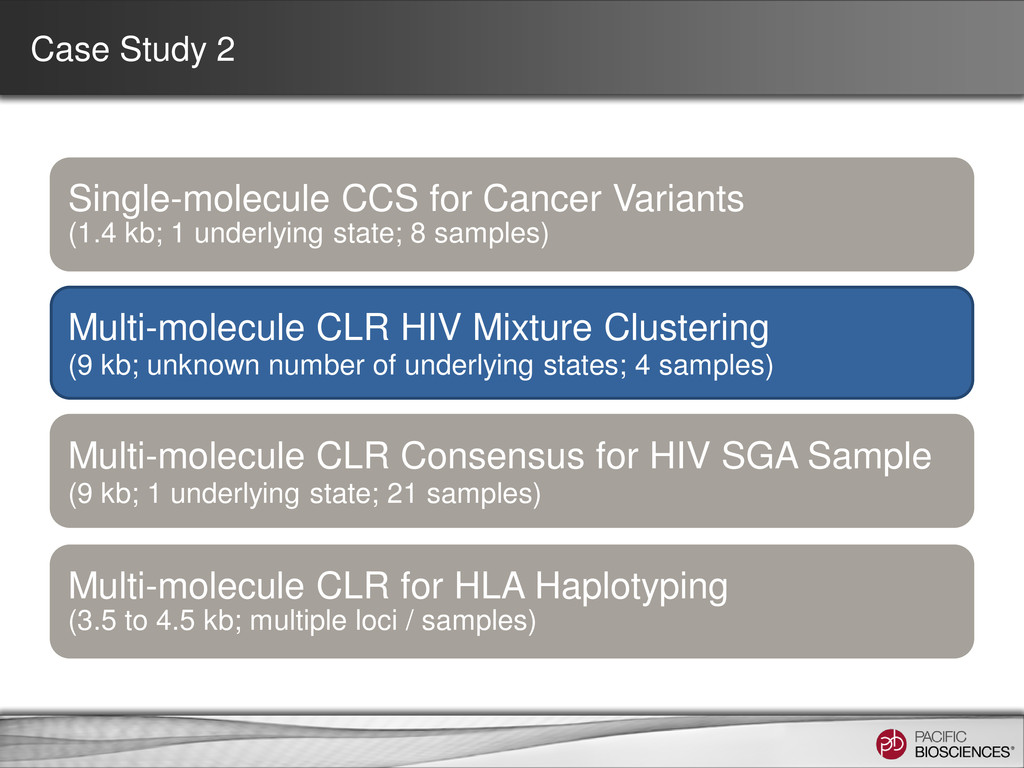
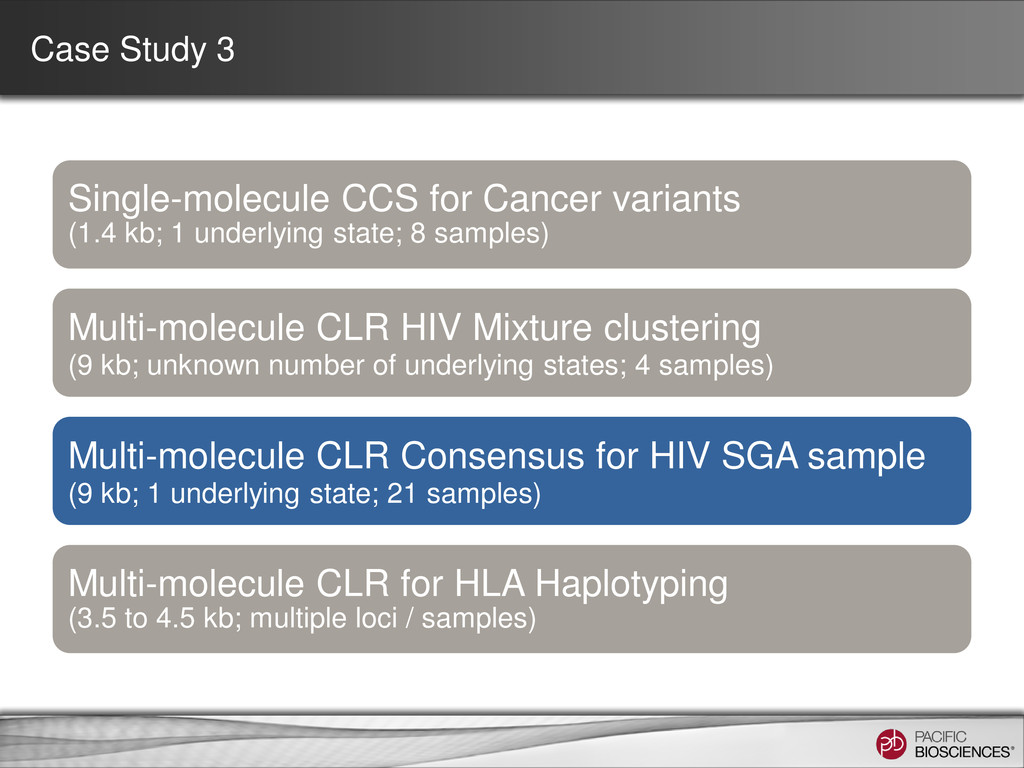
CCS for Cancer Variants (1.4 kb; 1-4 underlying states, 8 samples) Sequence FLT3 mutations to understand AML treatment (Nature 2012, Cathy Smith, Neil Shah, UCSF) Detect ITD Phase Distant Mutations Low Frequency Mutations Short read (100 to 200 bp) ✔ Medium read (~500 to 800 bp) ✔ ✔ Cloning + Sanger/CE ✔ ✔ Sequence to find all positional combinations and their relative abundance in the pool
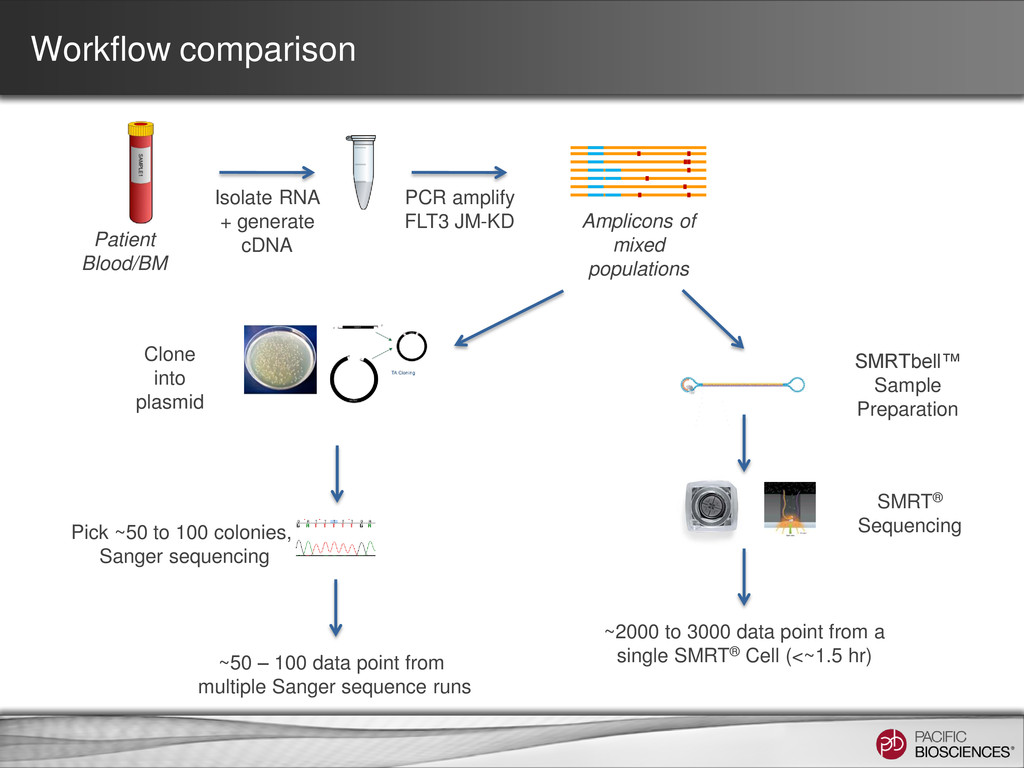
+ generate cDNA PCR amplify FLT3 JM-KD Clone into plasmid Pick ~50 to 100 colonies, Sanger sequencing ~50 – 100 data point from multiple Sanger sequence runs SMRTbell™ Sample Preparation ~2000 to 3000 data point from a single SMRT® Cell (<~1.5 hr) SMRT® Sequencing
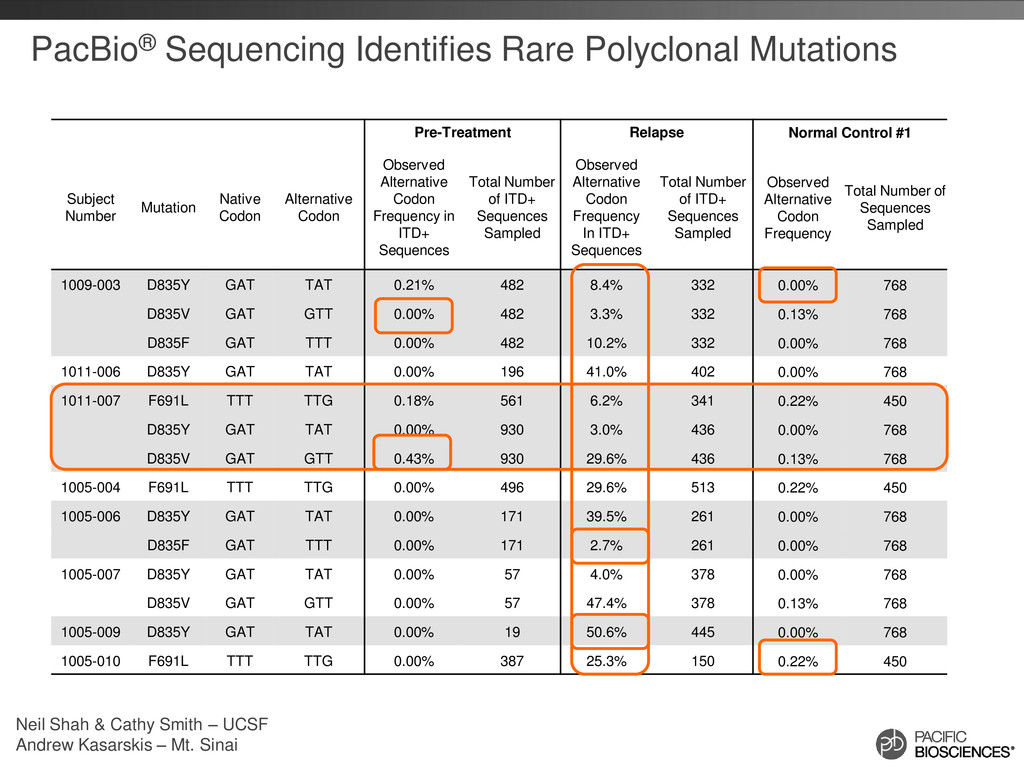
#1 Subject Number Mutation Native Codon Alternative Codon Observed Alternative Codon Frequency in ITD+ Sequences Total Number of ITD+ Sequences Sampled Observed Alternative Codon Frequency In ITD+ Sequences Total Number of ITD+ Sequences Sampled Observed Alternative Codon Frequency Total Number of Sequences Sampled 1009-003 D835Y GAT TAT 0.21% 482 8.4% 332 0.00% 768 D835V GAT GTT 0.00% 482 3.3% 332 0.13% 768 D835F GAT TTT 0.00% 482 10.2% 332 0.00% 768 1011-006 D835Y GAT TAT 0.00% 196 41.0% 402 0.00% 768 1011-007 F691L TTT TTG 0.18% 561 6.2% 341 0.22% 450 D835Y GAT TAT 0.00% 930 3.0% 436 0.00% 768 D835V GAT GTT 0.43% 930 29.6% 436 0.13% 768 1005-004 F691L TTT TTG 0.00% 496 29.6% 513 0.22% 450 1005-006 D835Y GAT TAT 0.00% 171 39.5% 261 0.00% 768 D835F GAT TTT 0.00% 171 2.7% 261 0.00% 768 1005-007 D835Y GAT TAT 0.00% 57 4.0% 378 0.00% 768 D835V GAT GTT 0.00% 57 47.4% 378 0.13% 768 1005-009 D835Y GAT TAT 0.00% 19 50.6% 445 0.00% 768 1005-010 F691L TTT TTG 0.00% 387 25.3% 150 0.22% 450 Neil Shah & Cathy Smith – UCSF Andrew Kasarskis – Mt. Sinai
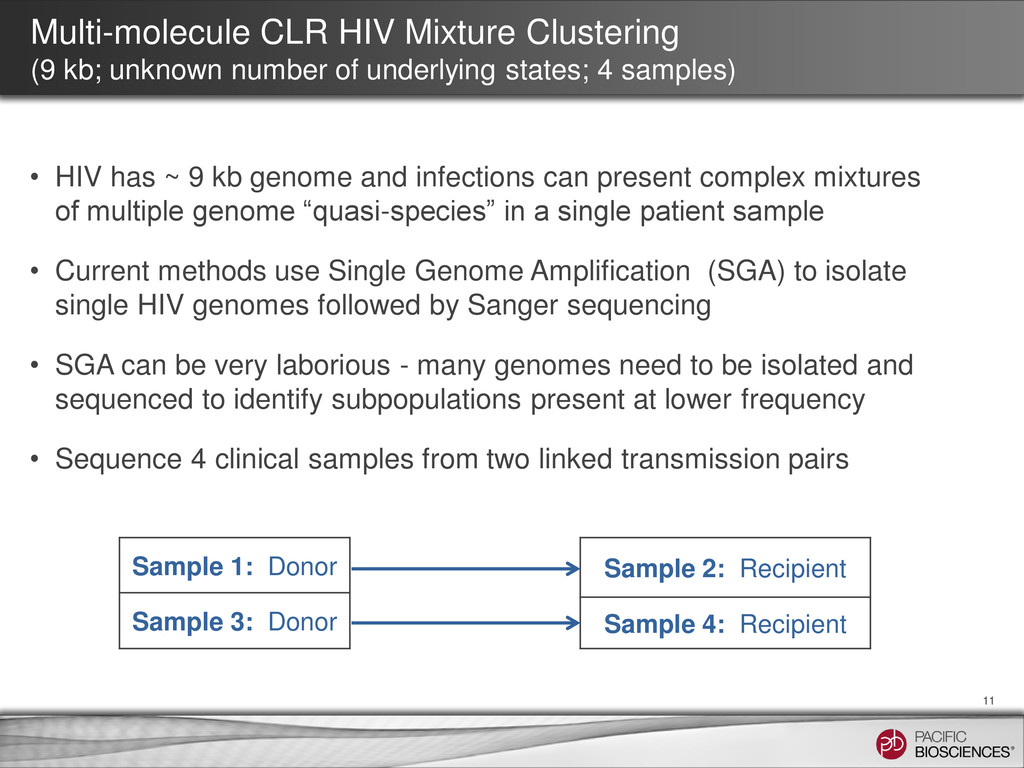
underlying states; 4 samples) 11 • HIV has ~ 9 kb genome and infections can present complex mixtures of multiple genome “quasi-species” in a single patient sample • Current methods use Single Genome Amplification (SGA) to isolate single HIV genomes followed by Sanger sequencing • SGA can be very laborious - many genomes need to be isolated and sequenced to identify subpopulations present at lower frequency • Sequence 4 clinical samples from two linked transmission pairs Sample 2: Recipient Sample 4: Recipient Sample 1: Donor Sample 3: Donor
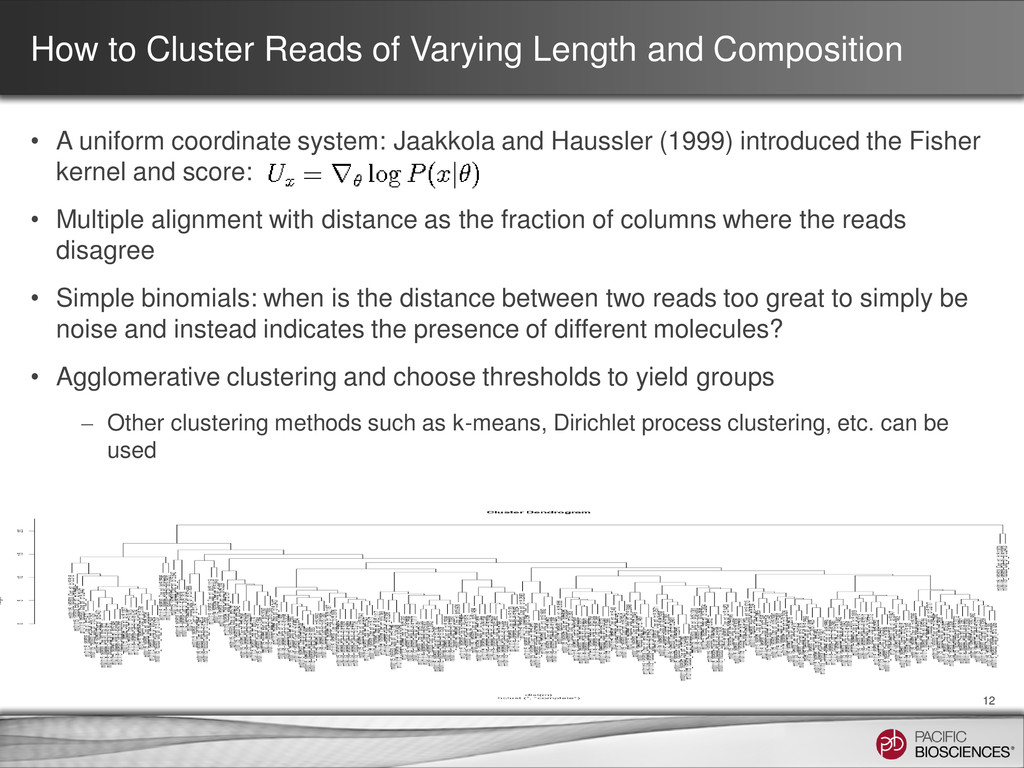
the Fisher kernel and score: • Multiple alignment with distance as the fraction of columns where the reads disagree • Simple binomials: when is the distance between two reads too great to simply be noise and instead indicates the presence of different molecules? • Agglomerative clustering and choose thresholds to yield groups – Other clustering methods such as k-means, Dirichlet process clustering, etc. can be used How to Cluster Reads of Varying Length and Composition 12
• Models of evolution across time - Drug resistance patterns. • Methods also demonstrated on – Real mixture of three Polio strains (7 kb genome) – BCR-ABL kinase domain in Leukemia (863 bases) – HLA Immuno-typing (3.5k)
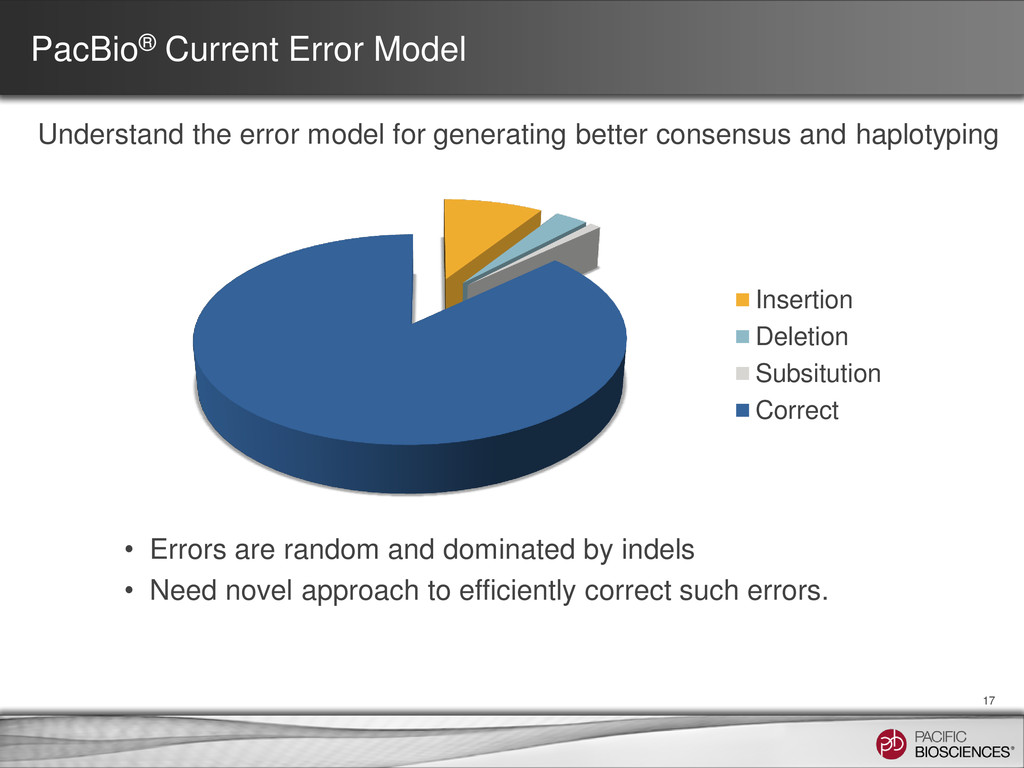
by indels • Need novel approach to efficiently correct such errors. 17 Insertion Deletion Subsitution Correct Understand the error model for generating better consensus and haplotyping
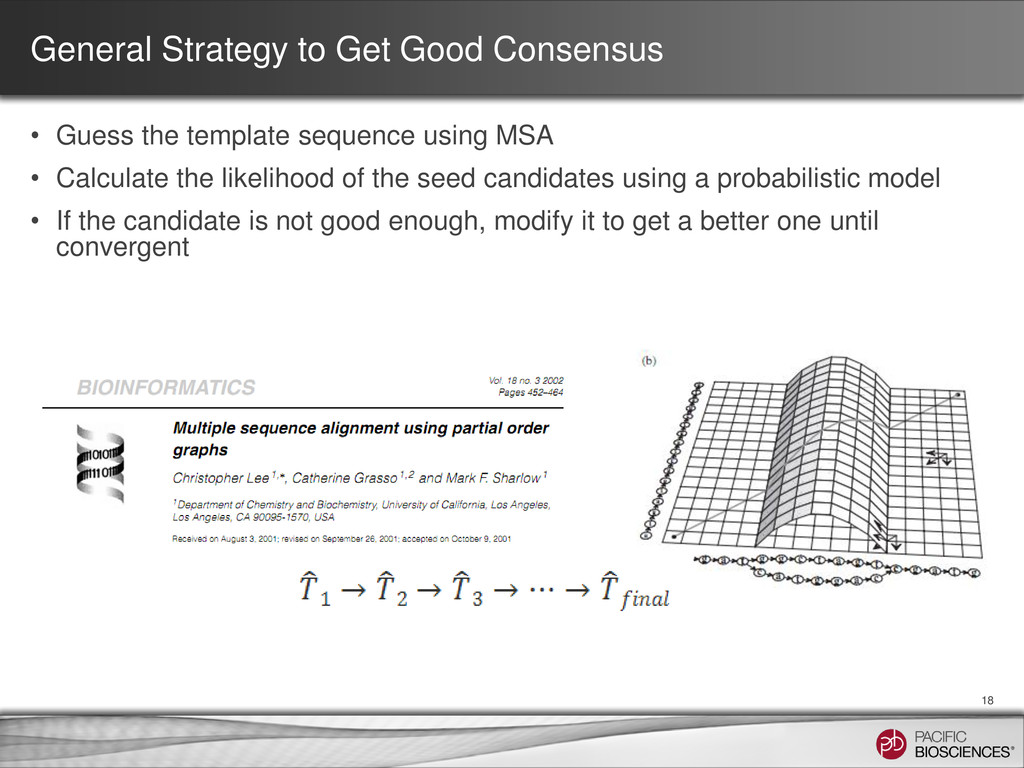
sequence using MSA • Calculate the likelihood of the seed candidates using a probabilistic model • If the candidate is not good enough, modify it to get a better one until convergent 18
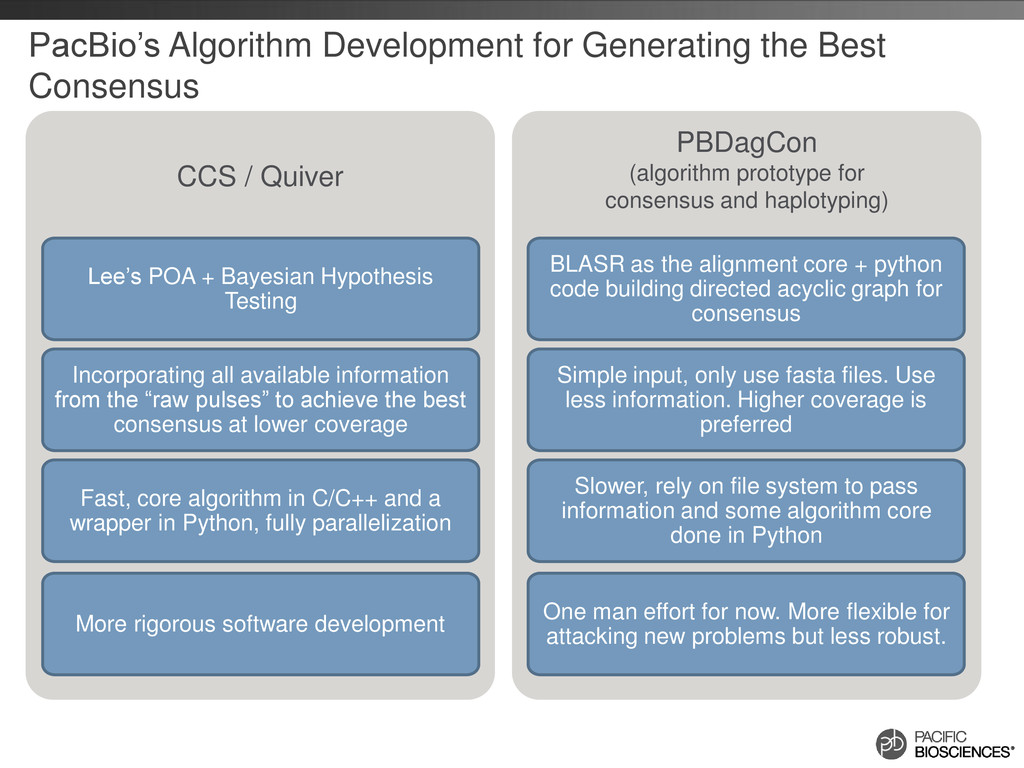
PacBio’s Algorithm Development for Generating the Best Consensus Lee’s POA + Bayesian Hypothesis Testing Incorporating all available information from the “raw pulses” to achieve the best consensus at lower coverage Fast, core algorithm in C/C++ and a wrapper in Python, fully parallelization More rigorous software development BLASR as the alignment core + python code building directed acyclic graph for consensus Simple input, only use fasta files. Use less information. Higher coverage is preferred Slower, rely on file system to pass information and some algorithm core done in Python One man effort for now. More flexible for attacking new problems but less robust.
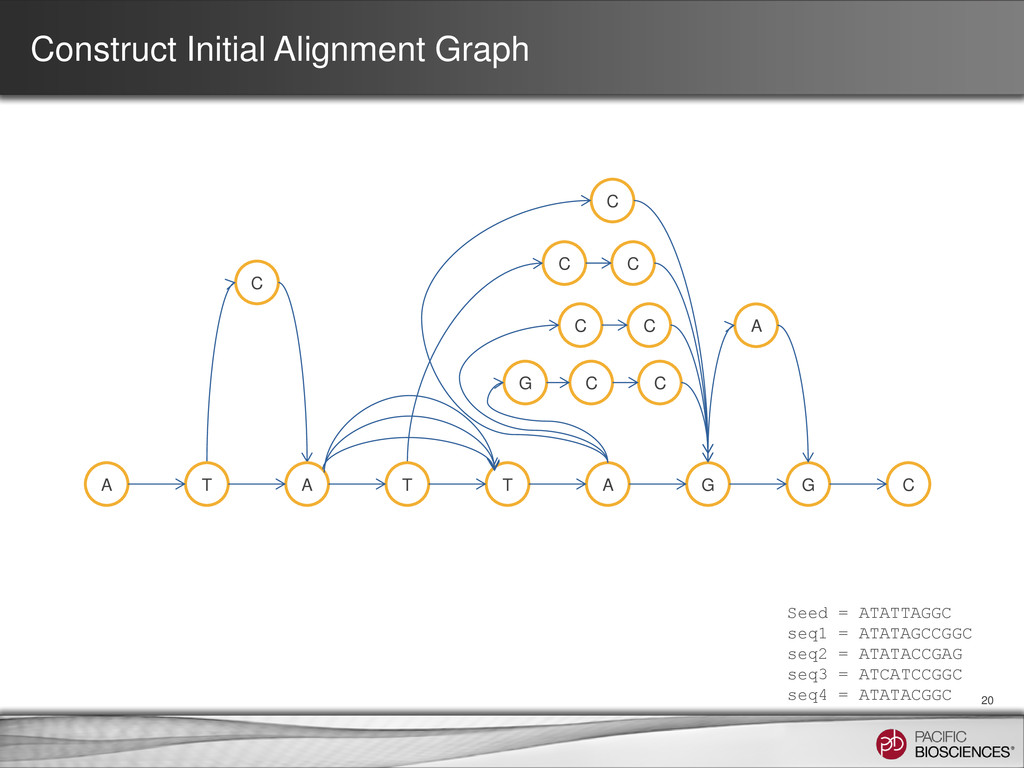
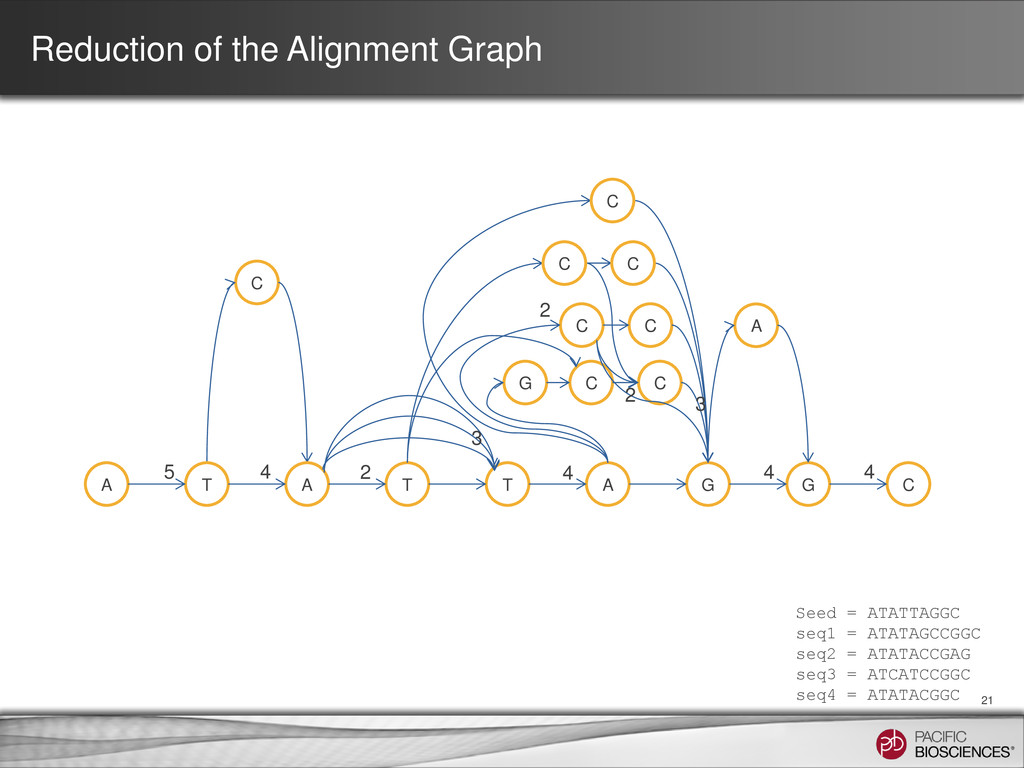
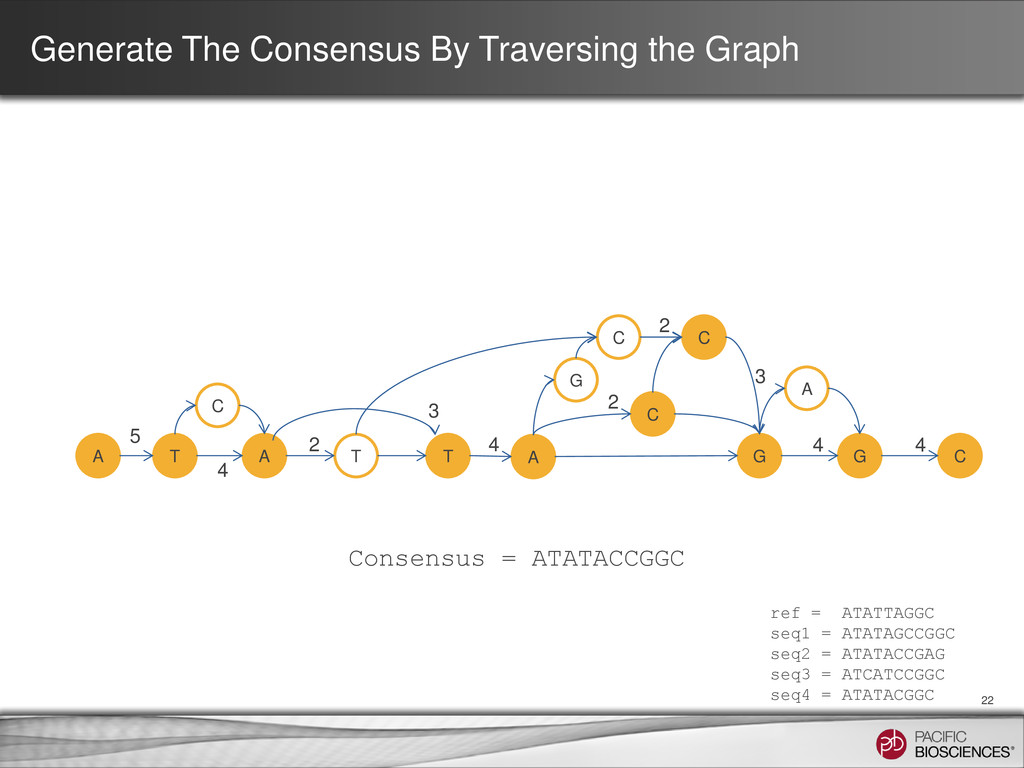
ATATTAGGC seq1 = ATATAGCCGGC seq2 = ATATACCGAG seq3 = ATCATCCGGC seq4 = ATATACGGC A T A T T A G G C G C C C A C 5 2 4 4 4 4 3 2 2 3 Consensus = ATATACCGGC
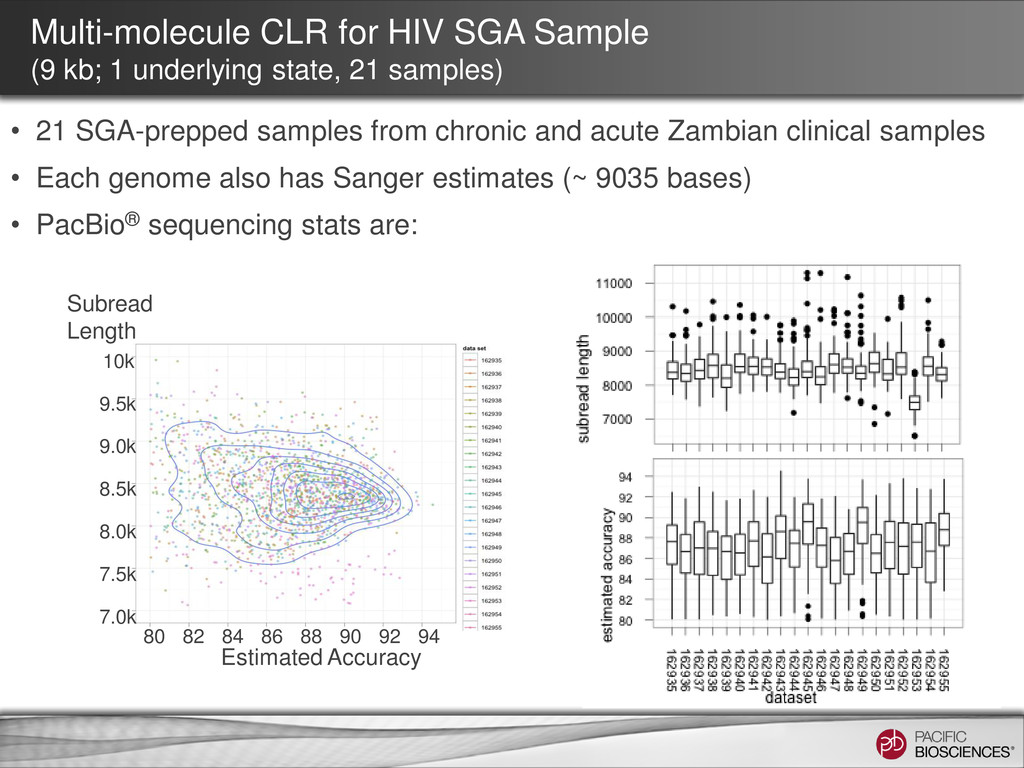
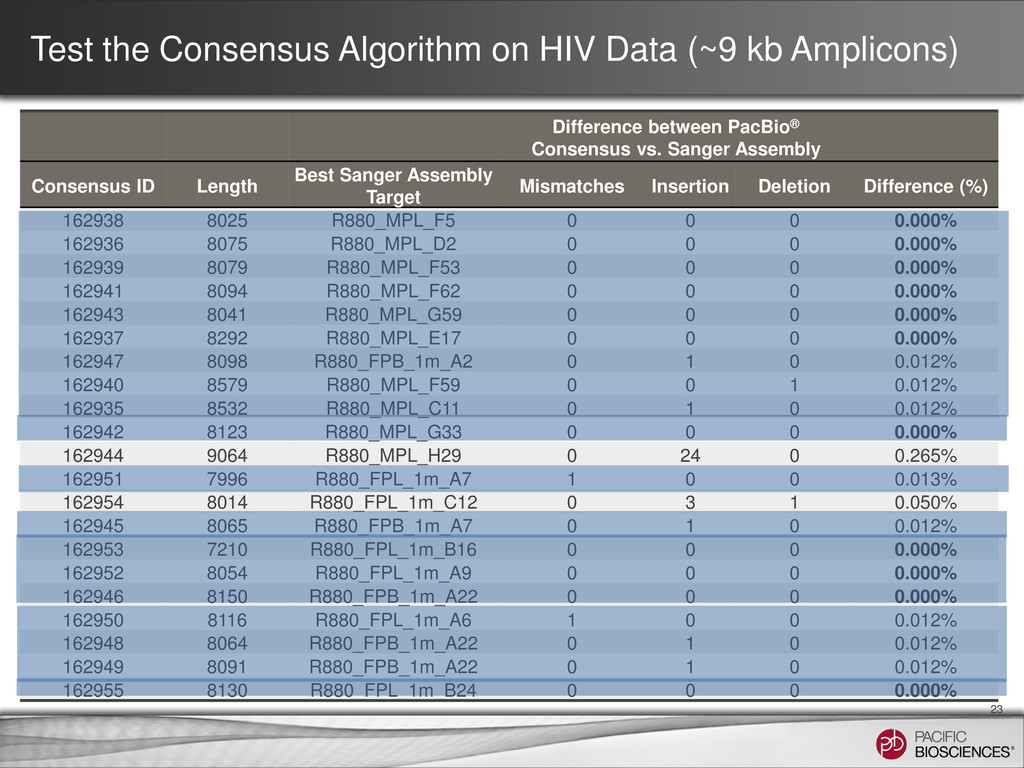
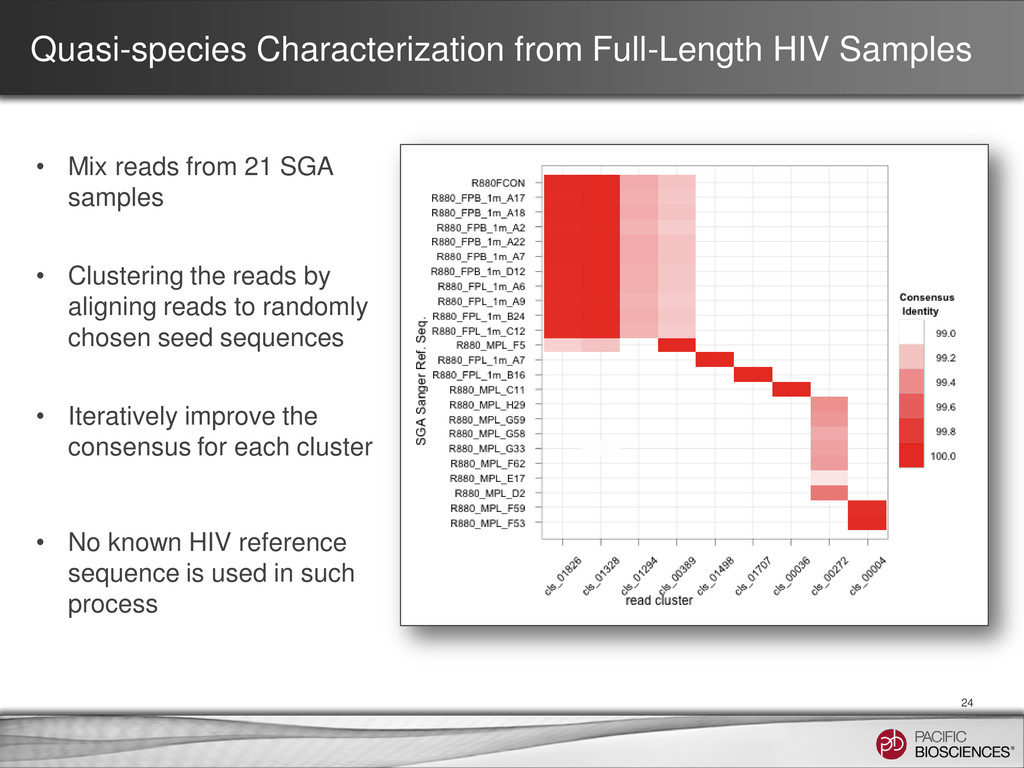
from 21 SGA samples • Clustering the reads by aligning reads to randomly chosen seed sequences • Iteratively improve the consensus for each cluster • No known HIV reference sequence is used in such process
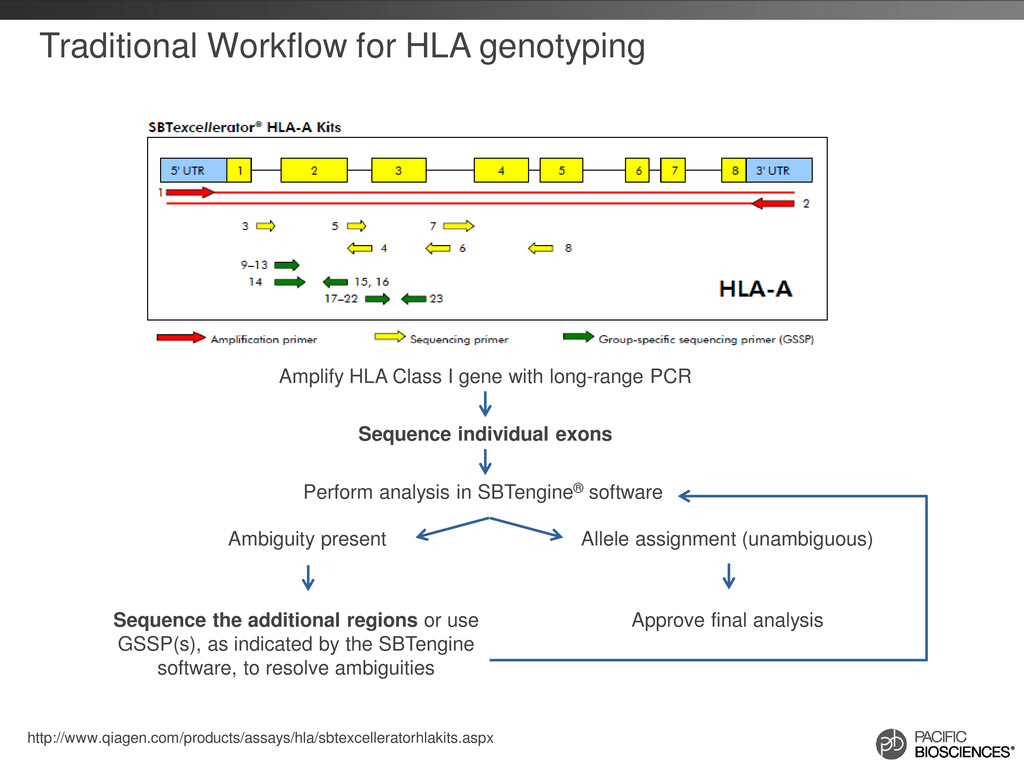
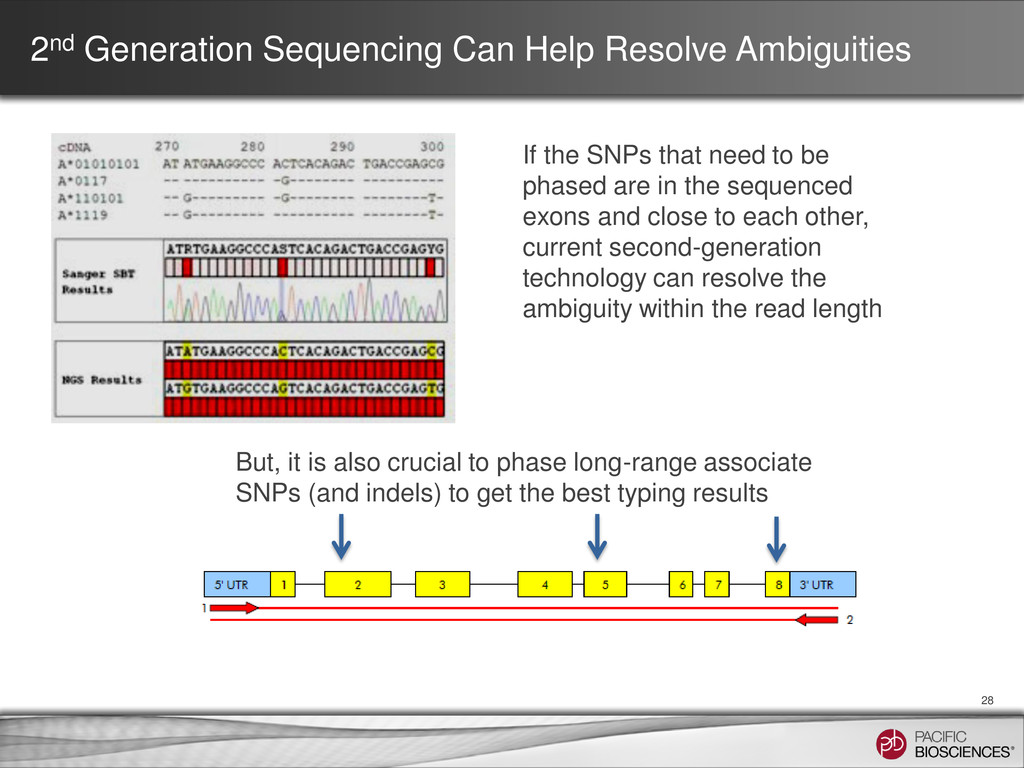
(unambiguous) Sequence the additional regions or use GSSP(s), as indicated by the SBTengine software, to resolve ambiguities Approve final analysis Perform analysis in SBTengine® software Amplify HLA Class I gene with long-range PCR Sequence individual exons
SNPs that need to be phased are in the sequenced exons and close to each other, current second-generation technology can resolve the ambiguity within the read length But, it is also crucial to phase long-range associate SNPs (and indels) to get the best typing results
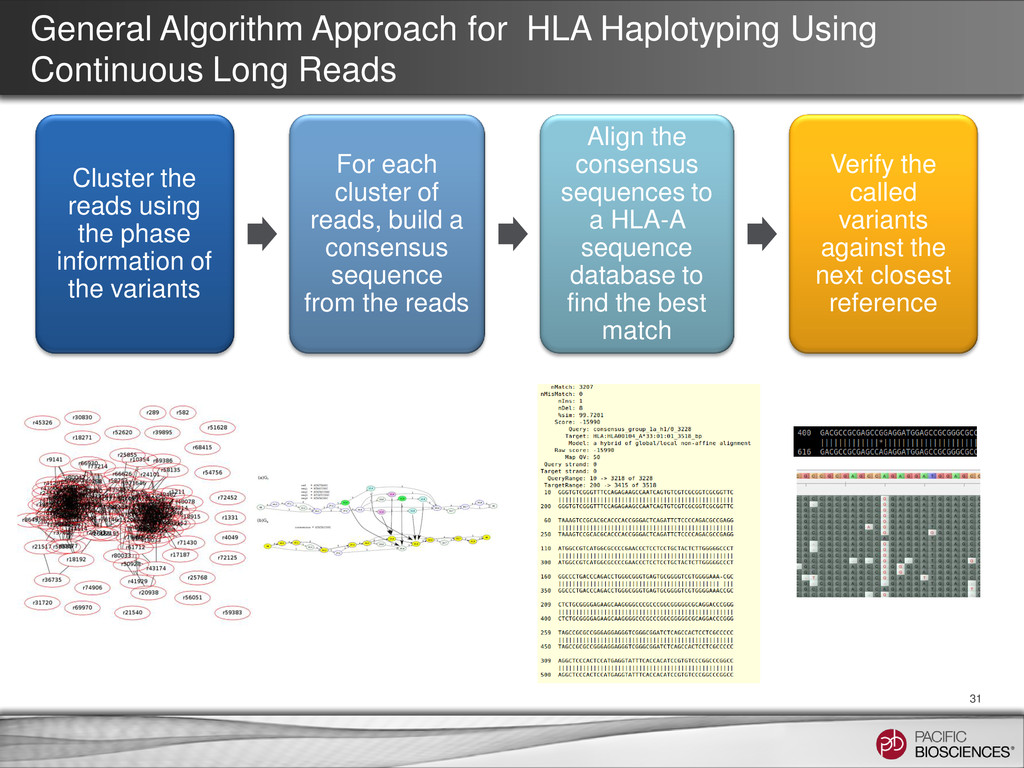
Data from single SMRT® Cell can provide full information (exons + all introns) for two haplotypes. Amplify HLA Class I genes with long-range PCR Sequencing whole gene (all exons+ all introns) to generate a set of long reads Resolve the two haplotypes computationally Simple alignment of the haplotype consensus to a HLA database to call the HLA types
31 Cluster the reads using the phase information of the variants For each cluster of reads, build a consensus sequence from the reads Align the consensus sequences to a HLA-A sequence database to find the best match Verify the called variants against the next closest reference
SNPs over the 3000 bp region 32 Sample 1 HLA-A Type Comment Best Match A*02:05:01 2nd Best Match A*02:06:01 5 SNPs from the best match Sample 2 HLA-A Type Comment Best Match A*02:01:01:01 2nd Best Match A*02:07:01 only one SNP from the best match
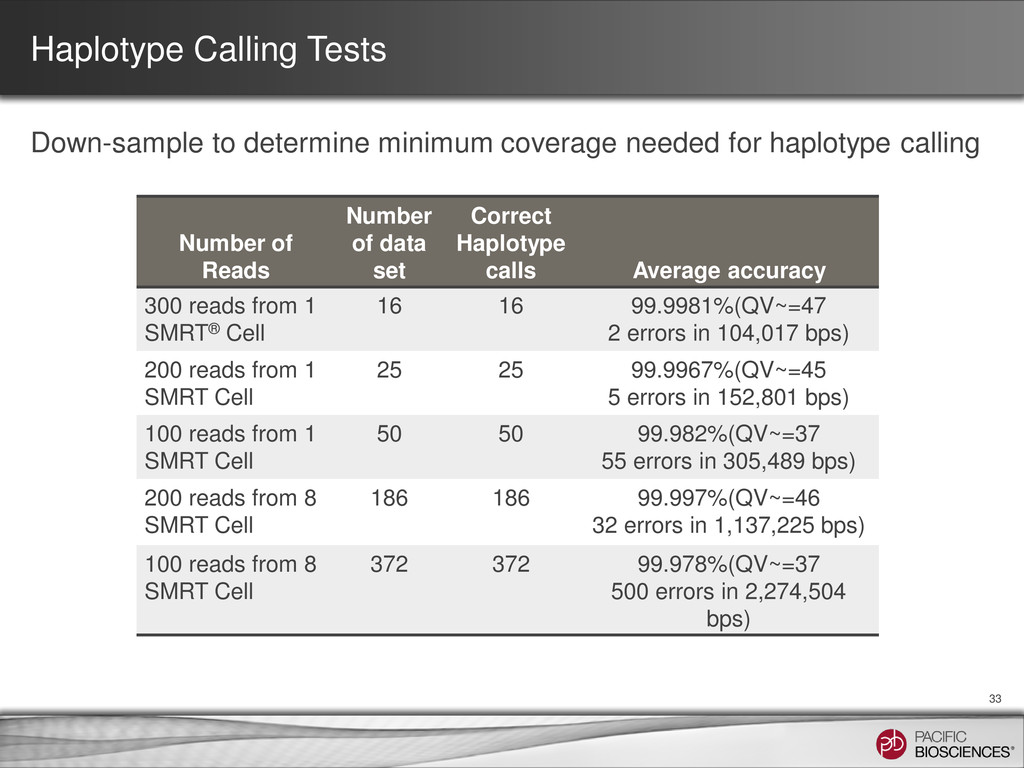
haplotype calling 33 Number of Reads Number of data set Correct Haplotype calls Average accuracy 300 reads from 1 SMRT® Cell 16 16 99.9981%(QV~=47 2 errors in 104,017 bps) 200 reads from 1 SMRT Cell 25 25 99.9967%(QV~=45 5 errors in 152,801 bps) 100 reads from 1 SMRT Cell 50 50 99.982%(QV~=37 55 errors in 305,489 bps) 200 reads from 8 SMRT Cell 186 186 99.997%(QV~=46 32 errors in 1,137,225 bps) 100 reads from 8 SMRT Cell 372 372 99.978%(QV~=37 500 errors in 2,274,504 bps)
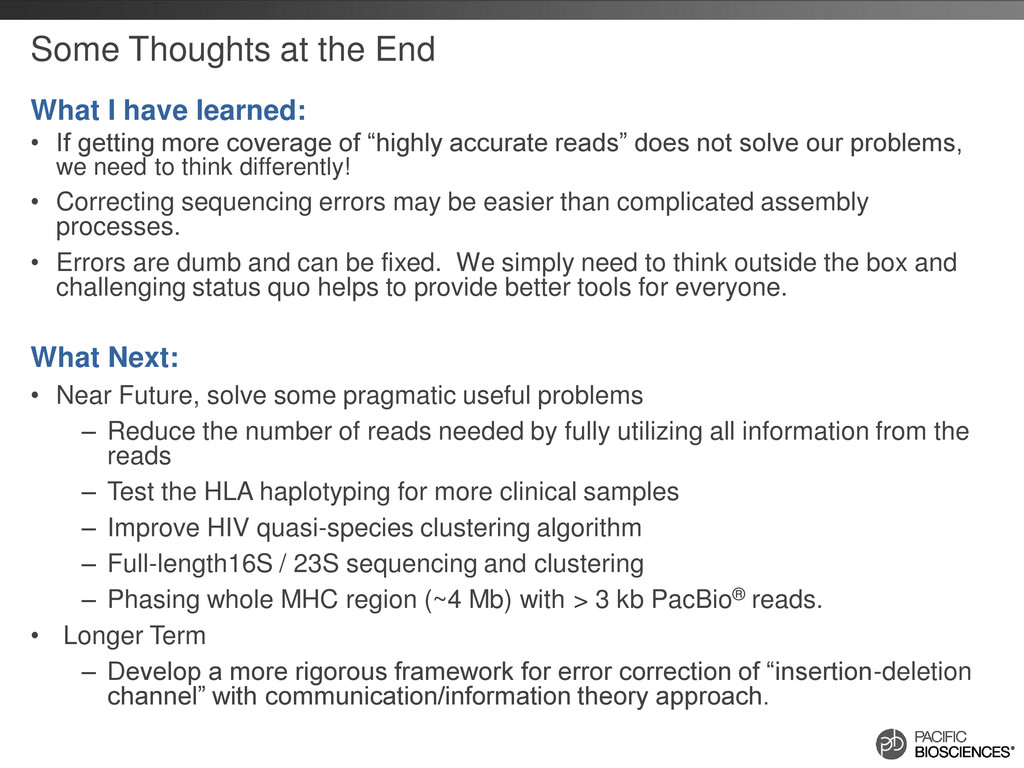
If getting more coverage of “highly accurate reads” does not solve our problems, we need to think differently! • Correcting sequencing errors may be easier than complicated assembly processes. • Errors are dumb and can be fixed. We simply need to think outside the box and challenging status quo helps to provide better tools for everyone. What Next: • Near Future, solve some pragmatic useful problems – Reduce the number of reads needed by fully utilizing all information from the reads – Test the HLA haplotyping for more clinical samples – Improve HIV quasi-species clustering algorithm – Full-length16S / 23S sequencing and clustering – Phasing whole MHC region (~4 Mb) with > 3 kb PacBio® reads. • Longer Term – Develop a more rigorous framework for error correction of “insertion-deletion channel” with communication/information theory approach.
(UCSF) – Jason Chin (PacBio) – Andrew Kasarskis, Eric Schadt (Mt. Sinai School of Medicine) HIV Complex Mixture Study – Ellen Paxinos, Yan Guo, Michael Brown (PacBio) – Emory University Center for Aids Research HIV SGA Study – Ellen Paxinos, Yan Guo, Michael Brown, Jason Chin (PacBio) – Eric Hunter, Schaefer Malinda, William Kilembe, Susan Allen (Emory University) HLA Study – Curt Lind, Jamie Duke, Dimitri Monos (Children’s Hospital of Philadelphia) – Dmitry Lyakhov, Matt Friedenberg (Gen-Probe) – Swati Ranade, Jason Chin (PacBio) 36
are trademarks of Pacific Biosciences in the United States and/or other countries. All other trademarks are the sole property of their respective owners.