theory of how to perform base modification detection using the PacBio® System • Requiring information on experimental design for DNA Base Modification Projects After the training, you will be able to • Understand key concepts used to analyze base modifications • Understand the features available in SMRT® Analysis v2.0.1+ that assist in detection of modified bases • Understand the potential benefits of a deep dive analysis • SMRT® Technology • PacBio® System Workflow • Experimental Design for De Novo Assembly
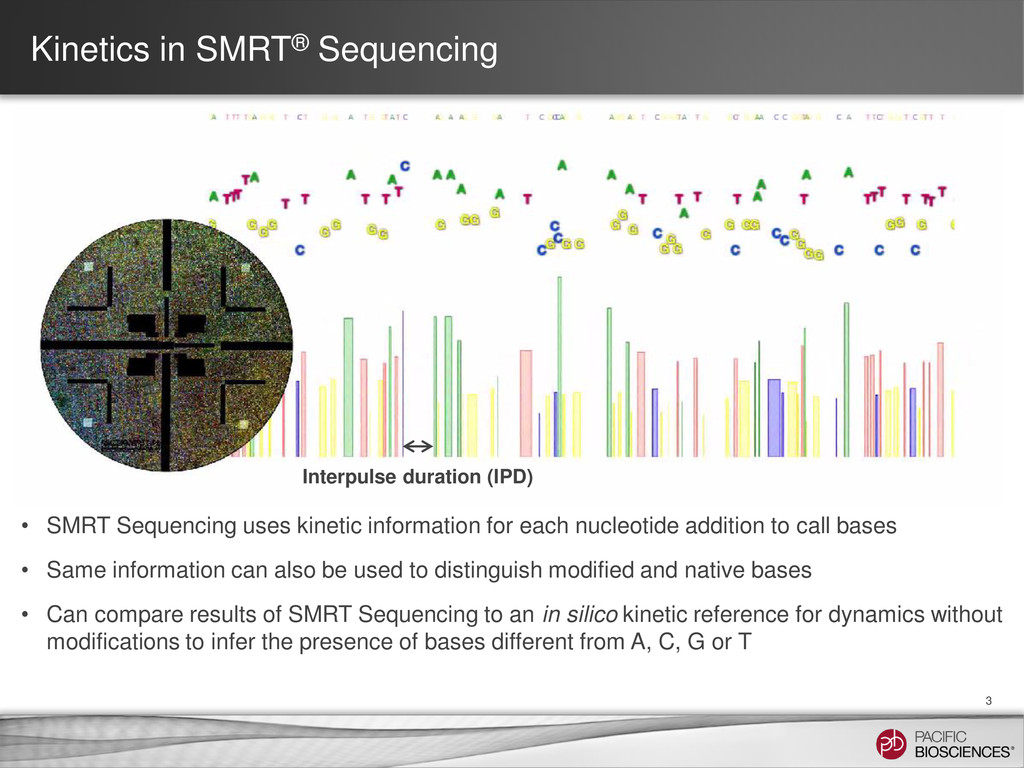
for each nucleotide addition to call bases • Same information can also be used to distinguish modified and native bases • Can compare results of SMRT Sequencing to an in silico kinetic reference for dynamics without modifications to infer the presence of bases different from A, C, G or T 3 Interpulse duration (IPD)
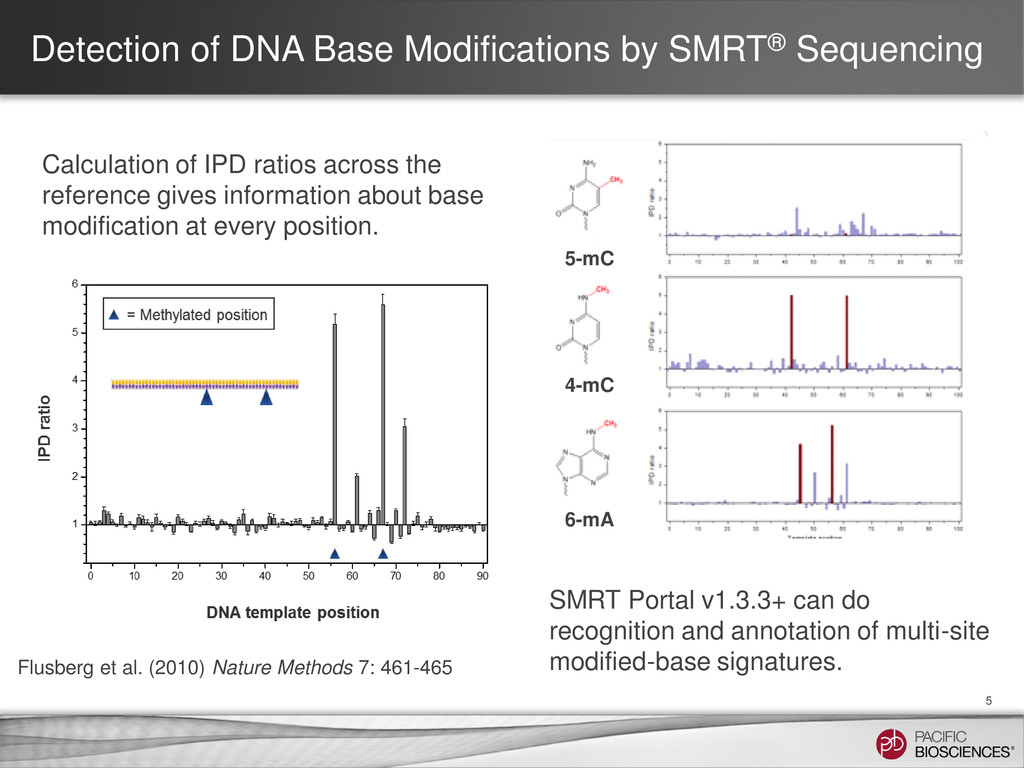
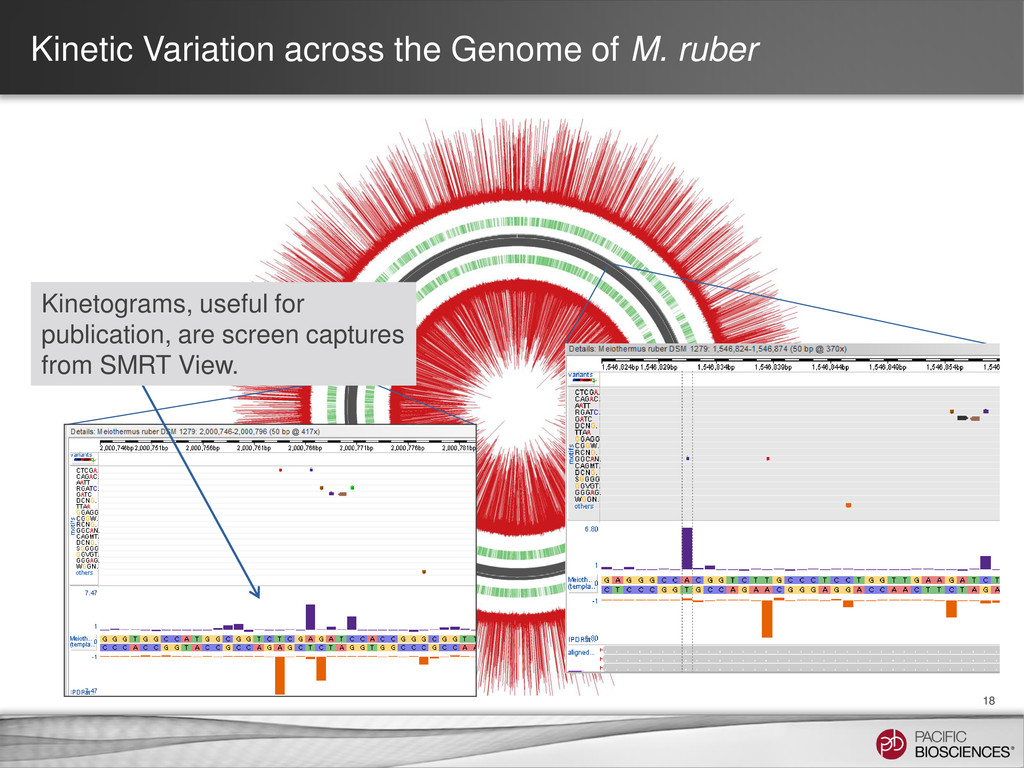
et al. (2010) Nature Methods 7: 461-465 SMRT Portal v1.3.3+ can do recognition and annotation of multi-site modified-base signatures. 5-mC 4-mC 6-mA Calculation of IPD ratios across the reference gives information about base modification at every position.
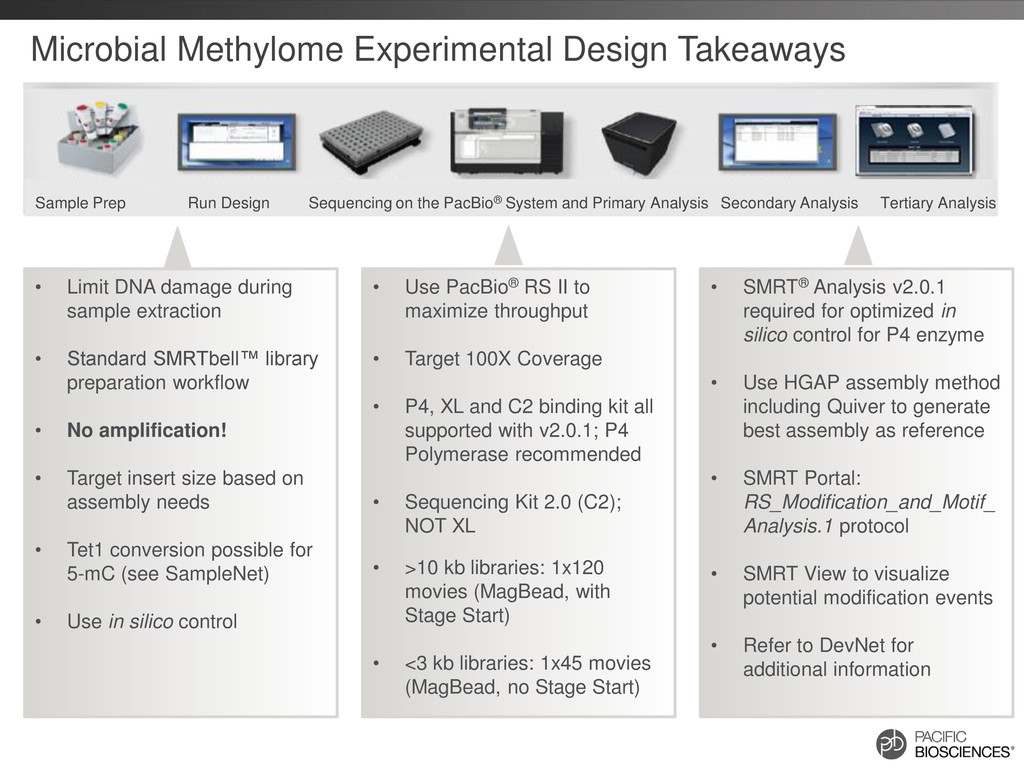
to maximize throughput • Target 100X Coverage • P4, XL and C2 binding kit all supported with v2.0.1; P4 Polymerase recommended • Sequencing Kit 2.0 (C2); NOT XL • >10 kb libraries: 1x120 movies (MagBead, with Stage Start) • <3 kb libraries: 1x45 movies (MagBead, no Stage Start) • SMRT® Analysis v2.0.1 required for optimized in silico control for P4 enzyme • Use HGAP assembly method including Quiver to generate best assembly as reference • SMRT Portal: RS_Modification_and_Motif_ Analysis.1 protocol • SMRT View to visualize potential modification events • Refer to DevNet for additional information • Limit DNA damage during sample extraction • Standard SMRTbell™ library preparation workflow • No amplification! • Target insert size based on assembly needs • Tet1 conversion possible for 5-mC (see SampleNet) • Use in silico control Sample Prep Run Design Sequencing on the PacBio® System and Primary Analysis Secondary Analysis Tertiary Analysis
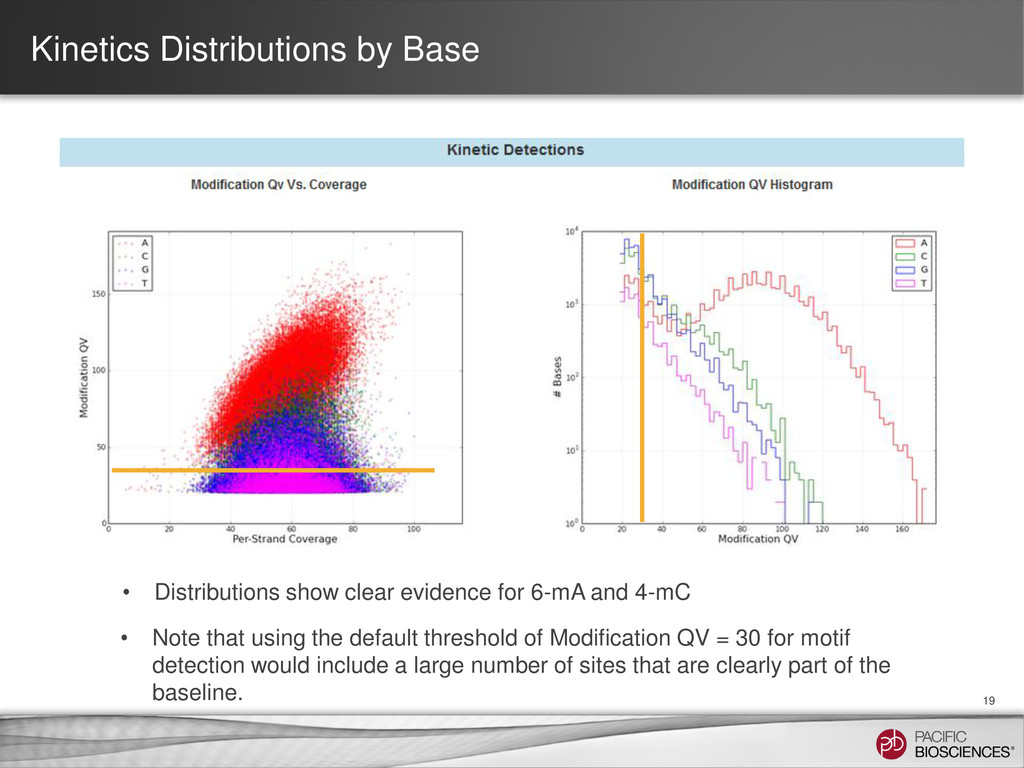
for 6-mA and 4-mC • Note that using the default threshold of Modification QV = 30 for motif detection would include a large number of sites that are clearly part of the baseline.
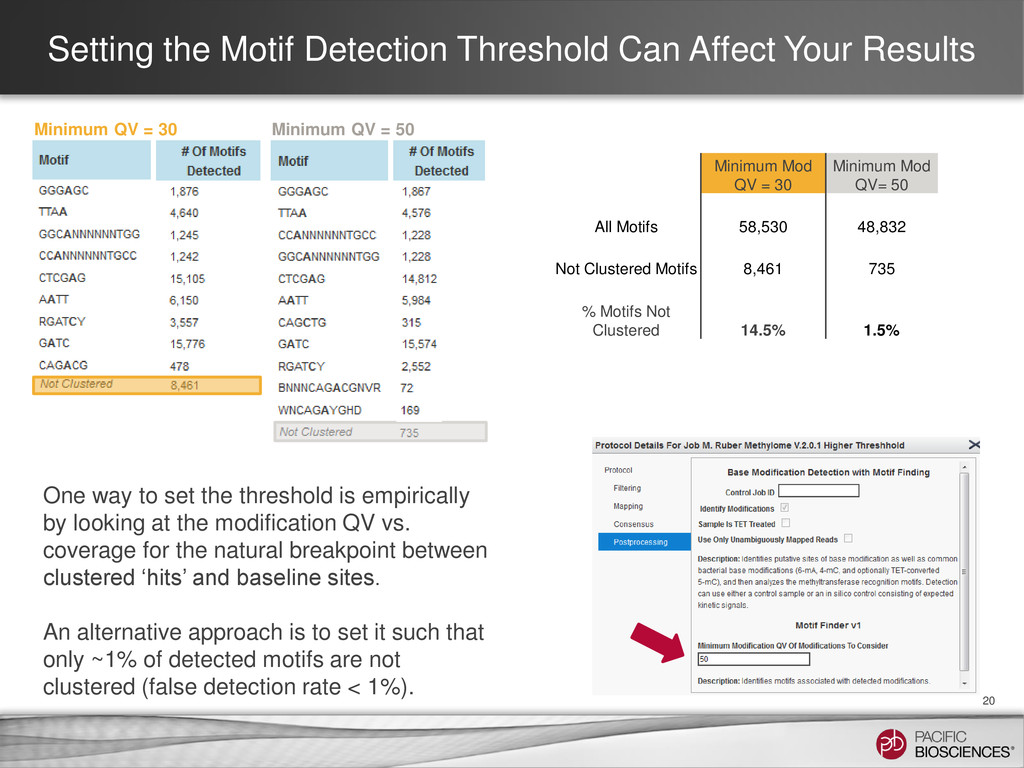
Minimum Mod QV = 30 Minimum Mod QV= 50 All Motifs 58,530 48,832 Not Clustered Motifs 8,461 735 % Motifs Not Clustered 14.5% 1.5% One way to set the threshold is empirically by looking at the modification QV vs. coverage for the natural breakpoint between clustered ‘hits’ and baseline sites. An alternative approach is to set it such that only ~1% of detected motifs are not clustered (false detection rate < 1%). Minimum QV = 30 Minimum QV = 50
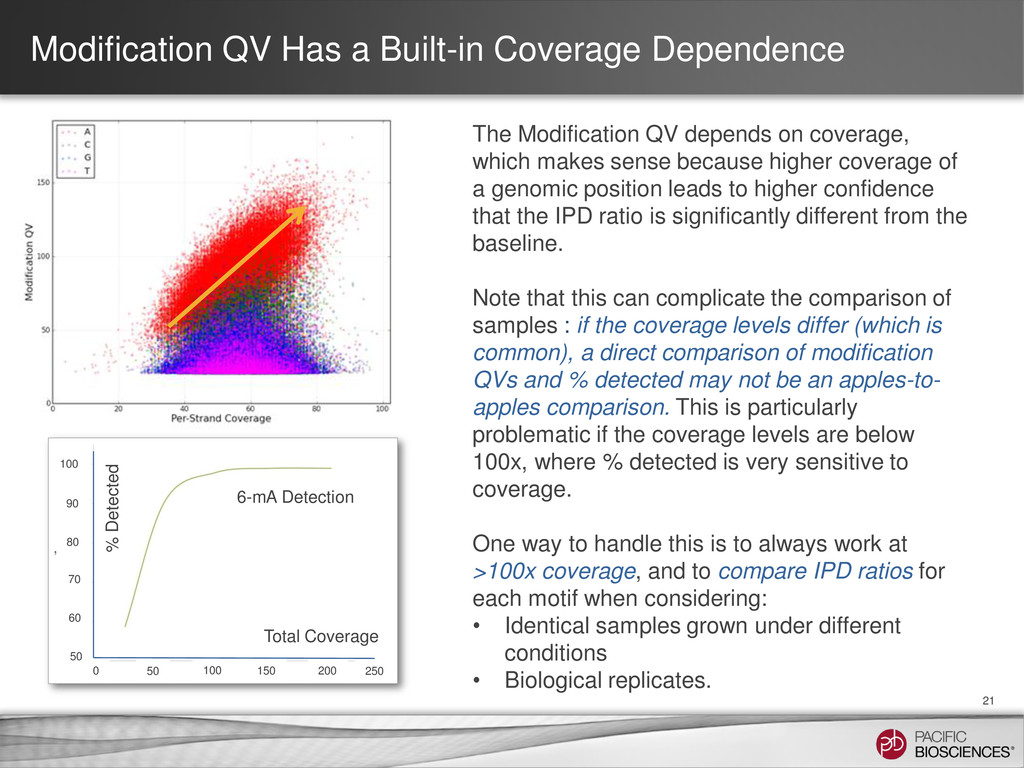
QV depends on coverage, which makes sense because higher coverage of a genomic position leads to higher confidence that the IPD ratio is significantly different from the baseline. Note that this can complicate the comparison of samples : if the coverage levels differ (which is common), a direct comparison of modification QVs and % detected may not be an apples-to- apples comparison. This is particularly problematic if the coverage levels are below 100x, where % detected is very sensitive to coverage. One way to handle this is to always work at >100x coverage, and to compare IPD ratios for each motif when considering: • Identical samples grown under different conditions • Biological replicates. 100 90 80 70 60 50 0 50 100 150 200 250 % Detected Total Coverage 6-mA Detection
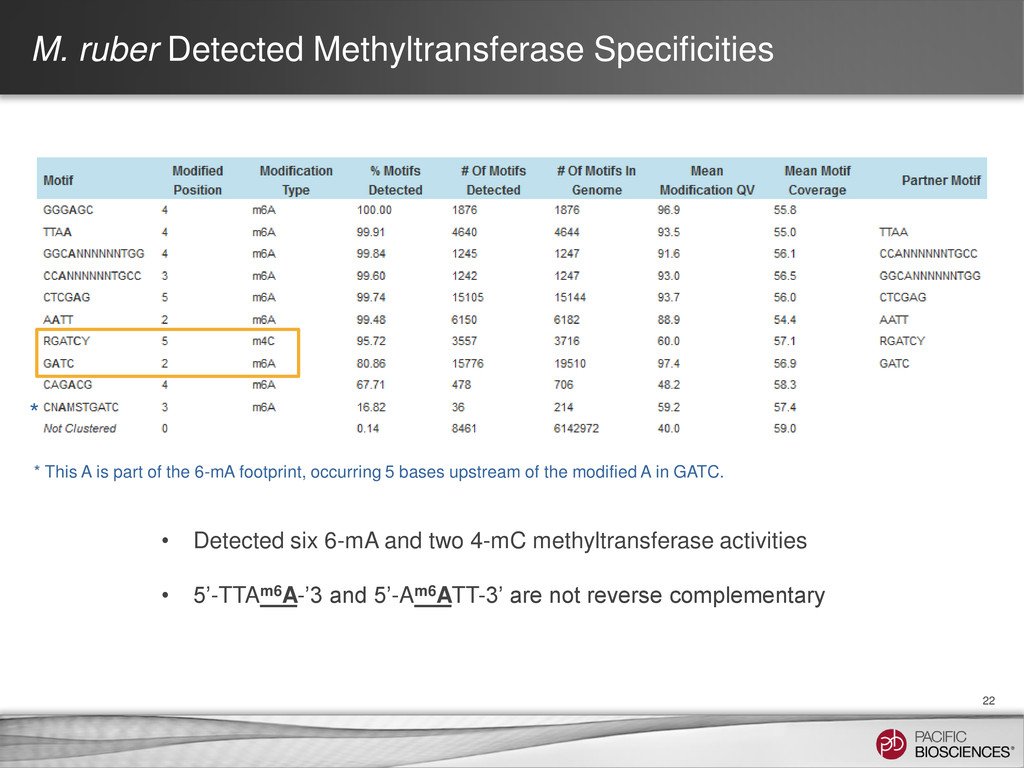
and two 4-mC methyltransferase activities • 5’-TTAm6A-’3 and 5’-Am6ATT-3’ are not reverse complementary * * This A is part of the 6-mA footprint, occurring 5 bases upstream of the modified A in GATC.
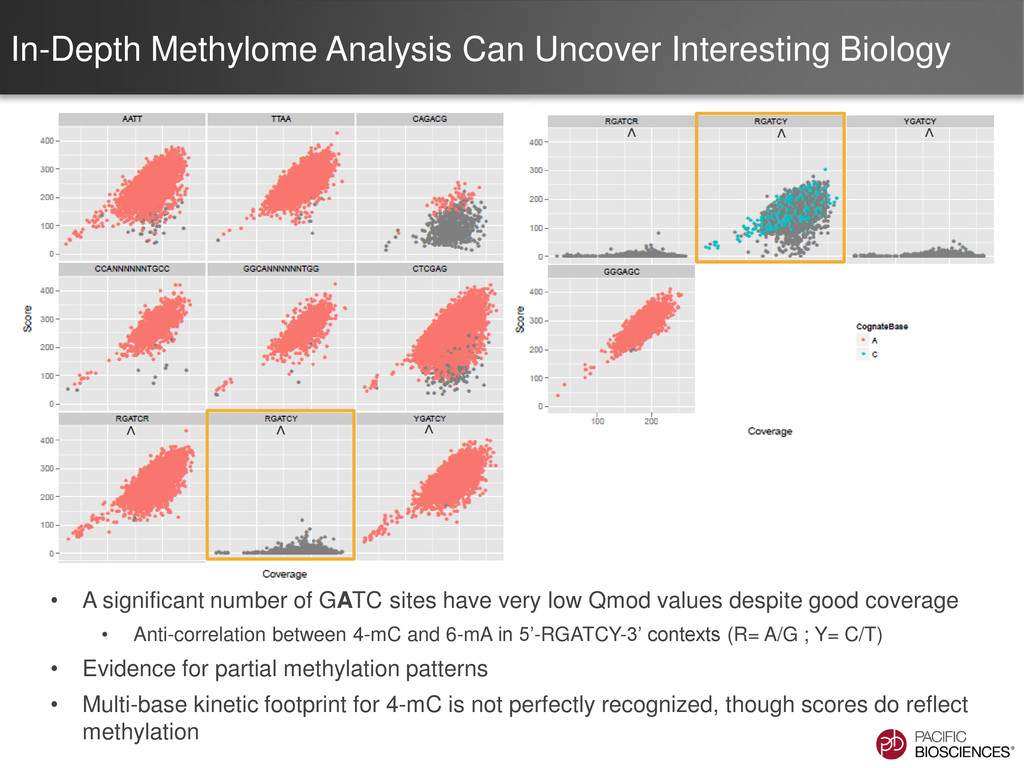
number of GATC sites have very low Qmod values despite good coverage • Anti-correlation between 4-mC and 6-mA in 5’-RGATCY-3’ contexts (R= A/G ; Y= C/T) • Evidence for partial methylation patterns • Multi-base kinetic footprint for 4-mC is not perfectly recognized, though scores do reflect methylation ^ ^ ^ ^ ^ ^
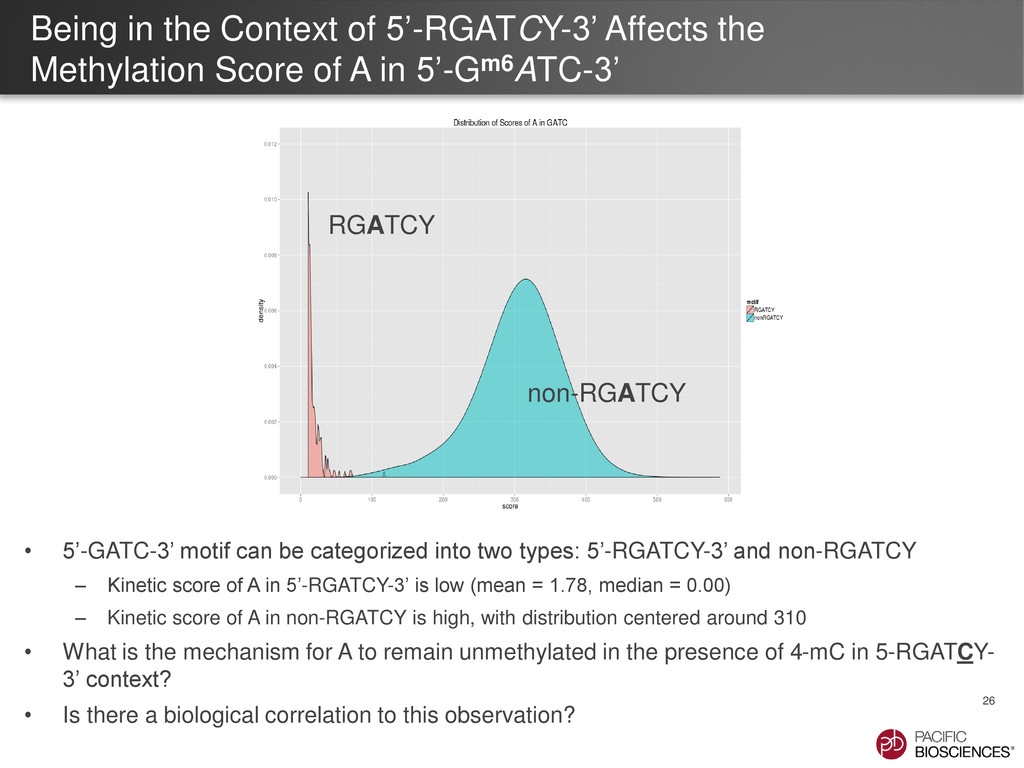
of A in 5’-Gm6ATC-3’ 26 • 5’-GATC-3’ motif can be categorized into two types: 5’-RGATCY-3’ and non-RGATCY – Kinetic score of A in 5’-RGATCY-3’ is low (mean = 1.78, median = 0.00) – Kinetic score of A in non-RGATCY is high, with distribution centered around 310 • What is the mechanism for A to remain unmethylated in the presence of 4-mC in 5-RGATCY- 3’ context? • Is there a biological correlation to this observation? non-RGATCY RGATCY
biochemical processes • SMRT® Sequencing provides a path to distinguishing numerous different modifications • SMRT® Analysis simplifies detection of putative modification events using IPD ratio analysis and a built-in motif discovery algorithm. • Guidance on experimental design and analysis recommendations available 27
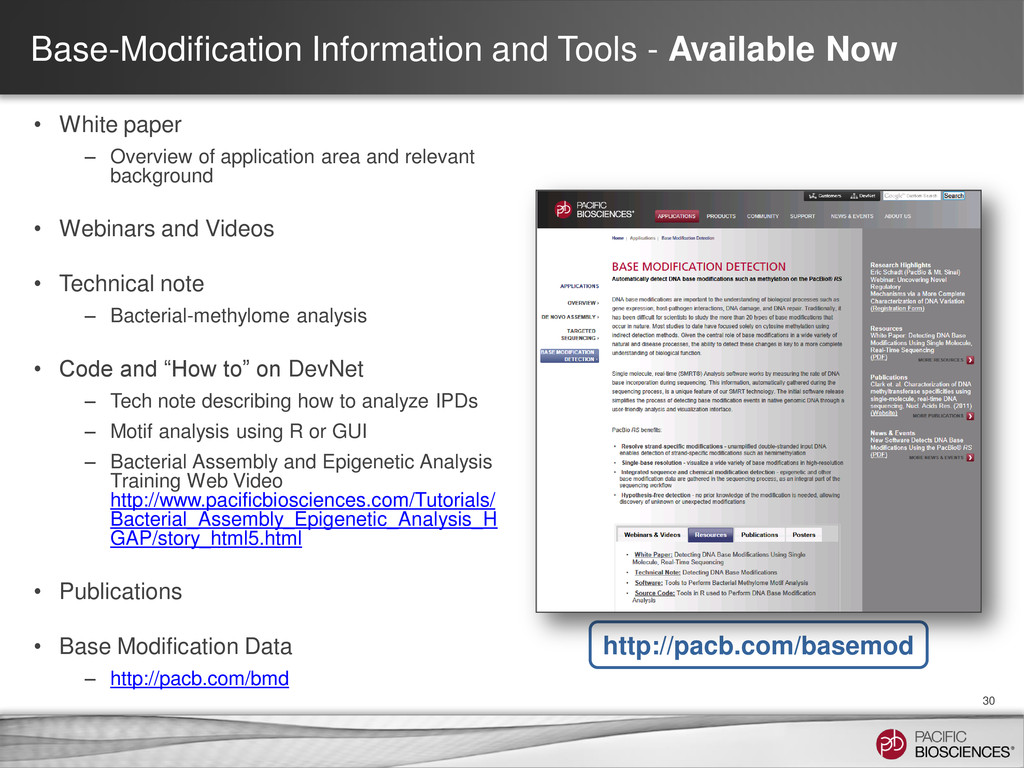
paper – Overview of application area and relevant background • Webinars and Videos • Technical note – Bacterial-methylome analysis • Code and “How to” on DevNet – Tech note describing how to analyze IPDs – Motif analysis using R or GUI – Bacterial Assembly and Epigenetic Analysis Training Web Video http://www.pacificbiosciences.com/Tutorials/ Bacterial_Assembly_Epigenetic_Analysis_H GAP/story_html5.html • Publications • Base Modification Data – http://pacb.com/bmd http://pacb.com/basemod
are trademarks of Pacific Biosciences in the United States and/or other countries. All other trademarks are the sole property of their respective owners.